


 English (pdf)
 Article in xml format
 Article references
 Send this article by e-mail
 Cited by SciELO
  Cited by Google
  Similars in
SciELO
Similars in
SciELO  Similars in Google
 Permalink
Introduction
Rare earth elements are the key elements in the development of high and new technology and have a very broad application prospect in the fields of materials, information, energy, ocean and space science and technology. Rare earth elements have some special geochemical properties, such as stable chemical properties, a high degree of homogenization, not easy to be disturbed by metamorphism, and so on. Once "recorded" in the terrane, it is easy to be preserved and so on, so it is a good geochemical indicator. As a good indicator and tracer, rare earth elements can be used to reverse the geochemical state and evolution process in the geological body. It is of great significance in judging the formation environment and conditions of sedimentary rocks, tracing the source of diagenetic materials of sedimentary rocks, and explaining the formation reasons of sedimentary rocks. At the same time, with the development of rare earth resources, rare earth elements inevitably enter the environment, food chain, and organisms in various ways. Since the sixties of this century, with the development of analytical and testing technology, not only the total content of rare earth in geological bodies but also the content of individual rare earth elements can be measured, which makes rare earth elements play an important role in the research work of diagenesis, mineralization and celestial evolution. However, due to more or less different physical and chemical properties of different rare earth elements, especially in different geological conditions, it often leads to a different distribution. In modern industrial automation production, quality control requires more and more high sensitivity for the determination of rare earth elements, and the chemical properties of rare earth elements are very similar, and their separation has always been rare One of the problems and hot spots in soil analytical chemistry. As a result, the study of rare earth element separation and analysis is not only of great theoretical significance but also of practical application value. Therefore, a tracing method of rare earth elements in the surrounding rock of geological formation based on a three-dimensional positioning algorithm is designed.
Material Method
Test reagent
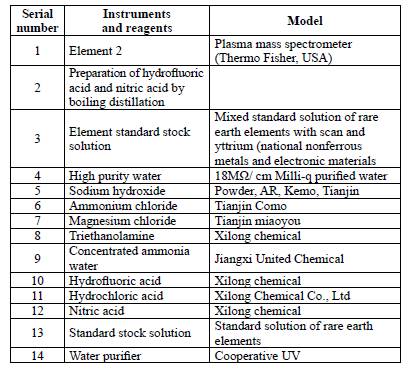
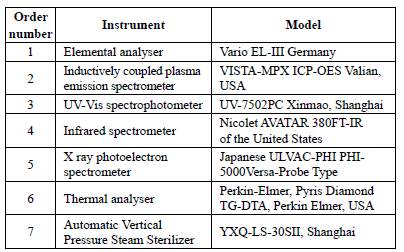
Before tracing the rare earth elements in the surrounding rock of the geological formation, in order to eliminate the interference of organic matter and suspended matter, oxidize the elements of various valence states into a single high valence state or transform them into inorganic compounds that are easy to be separated, so that the water sample can be concentrated, showing a clear, transparent and precipitation free state, the surrounding rock materials of the geological formation need to be digested (Wen et al., 2019), the main applied instruments and reagents are as shown in Table 1:
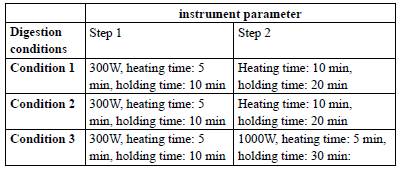
Preparation of standard solution (Vatin-Perignon et al., 2018): blank solution: 2mol L-1 hydrochloric acid; 1 μgml-1 rare earth element mixed standard solution: accurately transfer 5ml of 100 μg ml-1 mixed standard solution into a 50ml volumetric flask with a pipette, and fix the volume with 2mol L-1 hydrochloric acid (Kwan et al., 2019), and then dilute the solution 10 times to a 100ml volumetric flask to obtain 1 ugml-1 REE standard solution, which is ready for use. 5 μgml-1 rare earth element mixed standard solution: pipette 5ml 10 μgml-1 mixed standard solution to a 100ml volumetric flask, and use 2 molL-1 hydrochloric acid to fix the volume to obtain 5 μ gml-1REE, which is ready for use. After digestion, accurately weigh about 0.5g (accurate to 0.0001g) of sample gss-4 into microwave digestion tank, add 2ml of HCl, 2ml of HF, 5ml of HNO3 for digestion under the three different conditions (Li et al., 2018), then drive out the acid, and observe whether the digestion is complete. The digestion conditions are as shown Table 2:
After sample digestion, it is necessary to heat the sample and prepare rare-earth doped materials by microwave heating. The device is mainly composed of a multi-mode microwave resonator, magnetron, insulation system, turntable, and other parts. The magnetron is used to emit microwaves, and the resonator makes the microwaves resonate in the cavity, while the turntable is used to load the raw materials in the resonator at a uniform speed, so as to make the raw materials rotate at a uniform speed. The raw materials are evenly radiated by microwave. It is worth mentioning that in the whole process, due to the high temperature of the reactant, a large amount of heat generated by microwave will be dissipated in the resonant cavity in the form of thermal radiation (Bidhendi & Geitmann, 2018), heat conduction, and other forms, resulting in energy waste and damage to the resonant cavity and electronic components. Therefore, it is necessary to insulate the reaction raw materials, as shown in Figure 1:
Among them, 1 is a multi-mode microwave cavity, 2 is a magnetron, 3 is a thermal insulation device, 4 is the raw material to be heated, and 5 is a turntable. In addition, if the raw material is directly put into the microwave cavity for heating, according to the microwave heating principle, the microwave will rapidly increase the temperature of the reactant in the way of "body heating", at this time, the surrounding environment temperature is relatively low, and the high-temperature reactant will exchange heat with the surrounding air through the way of heat conduction or heat radiation, which will reduce the surface temperature, resulting in the high inside and low outside of the reactant Temperature gradient, resulting in uneven heating.
In order to avoid this kind of situation, the microwave heating and insulation device as shown in Figure 2 came into being. The device is a combination of the buried powder insulation layer and basket insulation layer and realizes the insulation of reactants through multi-layer insulation structure. The outermost layer is an aluminosilicate (3Al2O3-2SiO2) container with a thickness of about 3cm, which is transparent to the microwave, so the microwave can penetrate almost without damage; The thermal conductivity (Cemlyn et al., 2018) is small, which can play a very good role in heat preservation; moreover, it is resistant to high temperature, has a uniform expansion, and is still stable at 1700 °C. The innermost layer is a corundum crucible with reactant powder, good microwave permeability, and high-temperature resistance. Outside the corundum, crucible is a layer of graphite crucible, which serves as a microwave sensor. Because of the good coupling of graphite to microwave, this setting can not only improve the uniformity of heating but also preheat the reactant, which plays the role of indirect heating. The space between the aluminosilicate container and the graphite crucible, between the graphite crucible and the corundum crucible, is filled with quartz sand, so as to reduce the space between the insulation layer and the reactant as much as possible, achieve the purpose of further insulation, and minimize the temperature difference on the surface and inside of the reactant.
In fact, the heat preservation device has three functions of microwave coupling (Makridakis, 2018), heat preservation, and heat insulation. On the one hand, it can reduce the temperature gradient inside and outside the reactant, improve the heating uniformity, and at the same time, it can maintain the high-temperature thermal field environment inside the reactant for a period of time after the microwave radiation stops, so as to protect the reaction sample; On the other hand, due to the existence of the microwave coupling graphite, the microwave conventional mixed heating of the reaction sample is realized in a very simple way, which provides a uniform heat field for the sample, accelerates the heating speed and improves the heating environment; Third, it can insulate the high temperature inside the insulation body and protect the microwave cavity and electronic components.
Pretreatment of test samples
After crushing, the sample is sieved through 180 mesh and dried at 105 °C for standby.
The sample pretreatment was carried out in the super clean laboratory of Grade 100. The specific steps are as shown:
A. Accurately weigh 50 mg of the sample into a 25 ml polytetrafluoroethylene beaker, moisten with a small amount of water, and repeat three times;
B. Add 1 m LHF and 1 m lhno3 respectively, put them into a high-pressure tank and heat them up to 190 °C, and keep them warm for 72 hours;
C. Take out the high-pressure tank, cool it, open the cover and evaporate it to dryness. When the solution is nearly dry, add 1m 1100pg / ml RH internal standard solution, 1ml HNO3 and 4-5ml of three times water, put it into the high-pressure tank, seal and heat it to 140 °C, keep it warm for 5 hours, so as to dissolve the residue and ensure complete extraction;
D. After the solution is cooled, take 0.2ml to 10ml polytetrafluoroethylene test tube, volume it, shake it, and then test it on the machine. The acidity of the solution is 2% HNO3.
First separation:
Microwave acid decomposition method: in the digestion solution, NaOH solution (about 5g, dissolved in 30ml water) is used to precipitate the digestion solution for the first time, making rare-earth ions precipitate in NaOH alkaline condition, separating with matrix interference ions which do not precipitate in alkaline condition, and adding triethanolamine (1 + 1), making a large amount of Fe, Al, Zr in the soil and so on, forming a complex with it, filtering and being separated and removed, then dissolving and settling the solution with HCl hot solution to obtain the solution (Wen et al., 2018), and then selecting different precipitants for secondary precipitation separation to further remove the interference elements of the matrix in the soil (Hebaz et al., 2018).
Muffle furnace alkali melting method: add triethanolamine (1 + 1) into the digestion solution to form a large number of Fe, Al, Zr, and other complexes in the soil, filter them and remove them. After that, use HCl hot solution to dissolve and precipitate the solution, and then select different precipitants for secondary precipitation and separation to further remove matrix interference elements in the soil.
The second separation adopts the two methods:
First, add 2.5% (M / V) cupferron (Su et al., 2018) into the solution, stir it continuously until there is no precipitation, filter it, take the filtrate with a beaker, then heat it on a hot plate to concentrate it to 3ml, and then fix the volume to 10ml colorimetric tube. To be tested;
Second, add 3G of NH4Cl to the digestion solution, 50ml of water, and then add ammonia drop to produce a large amount of precipitation. Add about 50ml of ammonia to the solution until the pH value is greater than or equal to 12, then heat and boil it, cool and filter it, discard the filtrate, dissolve the hot HCl (2mol / L) used for precipitation in a beaker, heat it on a hot plate to concentrate to 3ml, and fix the volume to 10ml In the colorimetric tube, to be tested.
After heating, the whole sample treatment process is divided into the stages:
First, the formation stage, which is the main physical and chemical reaction stage, in which various chemical and physical changes are carried out for each component in the matrix raw material, and most of the gas products are discharged;
Second, as the temperature continues to rise, the raw material becomes a melt, and the sintering products diffuse to each other and form a network. At the end of this stage, there are basically no matrix raw material particles in the melt;
Third, the homogenization stage of the melt, that is, under long-term high temperature preservation, the components in the melt gradually evenly distributed;
Fourth, the rapid cooling stage, this stage is mainly to make the products fragile and convenient for ball milling later;
Fifthly, in the phase of ball milling and mixing, this is the last stage of the whole sample treatment, which is mainly to grind the products of the large particles to make them mix with different materials according to different needs and make the required samples.
Test instruments
All instruments used in the experiment are as shown in Table 3:
Inductively coupled plasma mass spectrometer is mainly used for quantitative analysis of multi-element in surrounding rock materials. The main parameters are as as shown in Table 4:
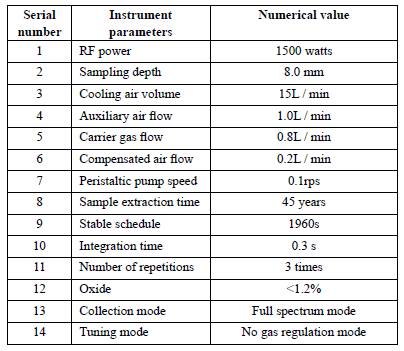
On this basis, the ICP-MS analysis instrument is very complex. It has many analysis functions and variable working parameters. Among the working parameters of the instrument, some are given by the instrument, some can be determined by experiments. However, there are many factors that directly affect the sensitivity, precision and detection limit of ICP-MS (Bernardi et al., 2018). In addition to the working parameters given above, the working parameters of the ion mirror system in MS and the calibration of the peak position are more important. In multiple parameters of ion mirror (Budko & Martynova, 2019), as long as one of the parameters changes, other conditions also need to be adjusted accordingly to obtain the corresponding sensitivity and precision, and then the next measurement after peak position calibration can be carried out. And with the long-term use of sampling cone and cutting cone, the surface and cone hole will change accordingly. Therefore, before each start-up test, it is necessary to do the instrument condition optimization experiment to determine the corresponding working parameters.
There are 7-10 working parameters of the ion mirror system, and the conditions obtained after each optimization experiment are not the same. For the simultaneous determination of elements in the whole range from light mass number to heavy mass number, the optimization experiment of instrument conditions is particularly important. In this experiment, the solution of 1 μg/ul containing the elements is used, and the isotopes are selected for tuning.
Determination method
When the sample is tested, it must be separated and purified as much as possible, and at the same time, the concentration and medium of the sample and the standard should be consistent as much as possible. Therefore, it is necessary to evaluate the recovery rate of each sample. Only when the recovery rate is guaranteed, the ideal data can be obtained. The two methods are adopted for data quality control in this experiment. After all the samples are dissolved, take one solution before and after chemical separation to test the trace element one, so as to evaluate the overall recovery rate and matrix removal effect. According to the current evaluation, the overall recovery rate is up to, while the removal rate of the matrix, such as the main same heavy elements or molecules, ions, is basically close, so as to ensure the mass fractionation effect that may be brought about in the chemical pretreatment process and the matrix effect in the mass spectrometry determination process. In the chemical pretreatment process, the standard solution that has been calibrated and several parallel samples are added for synchronization Learn to handle (Varney & Bousfield, 2018).
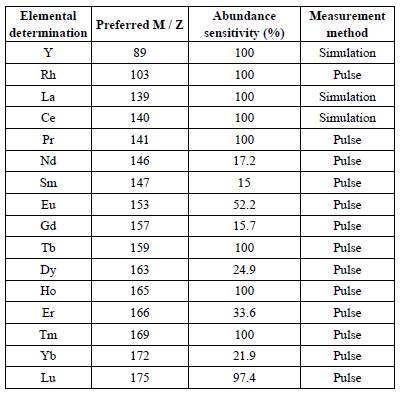
Generally, the relative comparison method is used to determine the content of elements in the sample, so is the three-dimensional positioning algorithm. It is also the most common method to configure a series of standard solutions or use a series of standard substances to make the working curve. In this experiment, a national level geochemical reference material was selected, which was prepared into a solution according to the sample decomposition procedure and used as the working curve of the standard solution. The element content of reference material is the standard value or recommended value provided by many analytical methods and laboratories after many times of analysis. With this method, the matrix effect is compensated to some extent because the operation is completely consistent with the sample analysis procedure. After the experiment, the selected sample can be completely decomposed, all the measured elements enter the solution, and the concentration does not exceed the linear range. The correction results and practicability are very satisfactory. At the same time, another 2-3 national standard samples are inserted into the sample (Abbott, 2018) for further verification, and the analysis results are very reliable. The relevant isotopes selected in the analysis and the determination method are as shown in the Table 5:
Blank and standard drift
The analysis of trace sample is very important for the control of blank. In addition to the process blank of sample, the instrument blank will also affect the quality of sample data seriously. The instrument blank will drift in the determination process. Generally speaking, the strength is high at the beginning of determination. Therefore, the negative value often appears for the low content sample. At the same time, the drift degree of each element in the determination process may not be good as such, gaps and standards need to be monitored frequently.
Internal calibration is one of the quantitative calibration methods often used in many analytical techniques. The function of internal standard is:
Monitor and correct the short-term drift of the signal;
Monitor and correct the long-term drift of the signal;
Correct the second element;
Correction of general matrix effects. The internal standard correction method (Cao & Wen, 2019) is used in ICP-MS, especially in the determination of large quantities of samples. It is better to add internal standard at the beginning of the experiment, especially for the experiment with separation and enrichment steps (it is required that the internal standard is consistent with the recovery rate of the elements to be measured), so that the loss in the experiment process does not affect the results, and when transferring the solution, there is no need to clean and fix the volume, which saves a lot of time, because the ratio of the elements to the internal standard to be determined is unchanged.
The selection principle of ICP-MS internal standard elements is that the elements to be determined do not contain the selected internal standard elements, the interference of the internal standard elements is as little as possible, and the mass spectrum behavior is as consistent as possible with the elements to be measured, which is very difficult for the determination of geochemical samples. In addition, when the multi-element determination is carried out, the elements are grouped according to the mass spectrum behavior, and multiple elements are selected as the internal standard. The determination effect is more ideal, but the elements that can be selected as the internal standard are more limited.
Dissolution of test sample residue
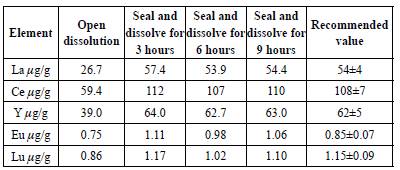
Because HF is used to decompose samples, but HNO3 can't completely drive HF out (Remon et al., 2018), some experimental sample precipitates remain in the residue. For surrounding rock samples, when opening dissolution, the result of REE is seriously low. Only under a certain temperature and pressure, these precipitates will be dissolved. However, at 140 ° C, closed dissolution (Du et al., 2018) for 3 hours, the results were basically consistent with the recommended values. Table 6 is the experimental data table of the relationship between the dissolution amount and time of the national standard sample of surrounding rock.
Mass and non mass interference in rare earth element tracing
In plasma mass spectrometry, there are two kinds of interference: mass spectrum interference and non mass spectrum interference. Mass spectrum interference includes isometric interference, background interference and polyatomic ion interference (oxide, hydroxide and bicharged ion generation are interference, among which matrix effect and polyatomic ion interference are the main factors restricting the accuracy and precision of analysis.
Non mass spectrum interference mainly comes from matrix effect, which refers to the enhancement or inhibition effect of matrix elements on the analysis signal strength. It is a kind of nonlinear interference, and its dynamic drift degree varies with the mass number. The so-called matrix refers to the collection of all components with their own properties. This "all components" should include analytes, but not additives. The combined effect of each component of the matrix on the analysis signal of the element to be measured is matrix effect, that is to say, it is the combined interference effect of all accessories except additives. In the early analysis of ICP-MS, the behavior and interpretation of matrix effect are relatively scattered, but generally speaking, there are several common conclusions as shown: high concentration matrix can inhibit the analysis signal, and the degree of inhibition is related to the quality; the inhibition effect of heavy matrix is greater than that of heavy analyzed elements; the matrix effect is related to the lens system of the instrument. With the development of research, the mechanism of matrix effect is gradually clear, and space charge effect is considered as the main reason. The influences on the determination are: (1) reducing the taper hole; (2) consuming energy in ionization, affecting the ionization rate. For the same concentration of elements, the signal strength of the matrix with high concentration is low and the reduction is fast. When the geological samples are diluted more than 2000 times (0.5 mg / ml), the matrix effect is small.
The more prominent problems in the determination of trace rare earth elements (Habal, 2018) are the interference of polyatomic ions, especially the interference of oxides of light rare earth elements, the interference of hydroxides to heavy rare earth elements, and the interference of oxides formed by seven natural isotopes of barium and hydroxides to light rare earth elements. The yield of rare earth oxides and hydroxides (REO (H) + is affected by the power of the ionomer, the velocity of carrier gas, the depth of sampling, the diameter of the sampling cone and the diameter of the intercepting cone, while the high plasma power and the low velocity of carrier gas can effectively reduce the yield of oxides. Many analytical scientists have done research in this field, including the influence of the aperture size of the sampling cone and the intercepting cone on the oxide signal.
Characterization of rare earth element doped materials in surrounding rock of geological formation
By using a polycrystalline X-ray diffractometer to analyze the structure and phase of the anti-counterfeiting powder, the average grain size of the powder can be measured. According to the diffraction, the grain size can be calculated by Scherrer equation (1):
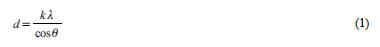
In equation (1), cos θ represents the diffraction angle of crystal surface, k is constant, and X represents the wavelength of the target source.
The size distribution, morphology and agglomeration of particles were directly observed by Philips xl-30tmp environmental scanning electron microscope (SEM) and Nova nanosem 430 field emission scanning electron microscope (FESEM). The specific steps are as shown in Figure 3:
In order to characterize the application of the materials in spectrum anti-counterfeiting and laser protection, the reflection spectrum and fluorescence emission spectrum of the synthesized powders were measured after they were uniformly mixed into the coating to make the anti-counterfeiting and protective coating. When the light hits the ink surface, part of it is reflected, reflection coefficient:
In equation (2), U represents the incident light intensity, L represents the reflected light intensity, and I represents the change parameter of the reflection coefficient with the wavelength.
Trace of rare earth elements in surrounding rock of geological formation
According to the above process, the three-dimensional positioning algorithm is used to trace the rare earth elements in the surrounding rock of geological formation, and the microwave is used for initial positioning before tracking. Microwave, also known as ultra-high frequency wave, refers to electromagnetic waves with very high frequency. Its wavelength lies between infrared light and radio waves. The microwave frequency is 2.45GHz and the wavelength is 12.2cm. Microwave high temperature heat treatment is a kind of heating method which uses microwave radiation instead of traditional heat sources. When the dielectric is in the microwave field, the electric field component of the microwave will give a force to the charged particles inside the dielectric. If the charged particles can move freely in the medium, they will generate current in the medium; if the charged particles are bound, they can only keep the same phase with the external electric field, that is, the polarization of the medium. According to the different kinds of charged particles in the medium, the polarization of the medium can be divided into four parts: dipole turning polarization, electron polarization, atomic polarization and interface polarization (Litasov, 2018), which is expressed as shown in equation (3):
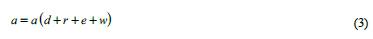
In equation (3), α is the total dielectric polarization, d is the dipole polarization caused by the permanent dipole in the medium, is the electronic polarization caused by the electrons rotating around the atomic nucleus, e is the atomic polarization caused by the atomic nucleus, and W is the interface polarization caused by the charges at the interface.
On the basis of the above processing, a three-dimensional positioning algorithm is used to trace the rare earth elements in the surrounding rock of the geological formation. The anchor nodes in the three-dimensional positioning algorithm are used as the reference for the location of unknown nodes, which are usually uniformly or randomly distributed in the wireless sensor network, usually with high energy. The anchor node has the ability to control the transmitting power. In an ideal environment, the relationship between the transmitting power of the signal and the radius of the area covered by the signal can be described by the equation (4):
In equation (4), p is the signal power received by the sensor node, v is the transmit power, C is the distance between the receiver and the transmitter, a is the speed of light, f is the transmission frequency.
From the above equations, it can be seen that when other parameters remain unchanged and the minimum receiving power of the receiving node is fixed, the stronger the signal transmitting power of the transmitting node is, the farther its propagation distance is, so as to track relevant information, realize self positioning (Wu & Zou, 2018), and generate information table. The information in the information table contains all the received effective beacon information broadcast by the anchor node. Anchor nodes will broadcast beacon information at different levels of power repeatedly. Therefore, an unknown node will listen to multiple identical beacon information. Only when the number exceeds the beacon decision threshold can the beacon information be determined as true. But at this time, the beacon information has not been saved to the information table. After the anchor node broadcasts its own beacon information, the unknown node may decide that several beacon information from the same anchor node is true. At this time, the beacon information with the lowest transmitting power level is taken as the correct information from the anchor node, which is stored in the information table to complete the tracking of rare earth elements in the surrounding rock of the geological formation.
Experimental Study
In order to verify the feasibility of the three-dimensional positioning algorithm for tracking rare earth elements in the surrounding rock of geological strata, the traditional method is compared with the designed method, and the tracking accuracy of the two methods in different time periods is compared. It is as shown in Figure 4.
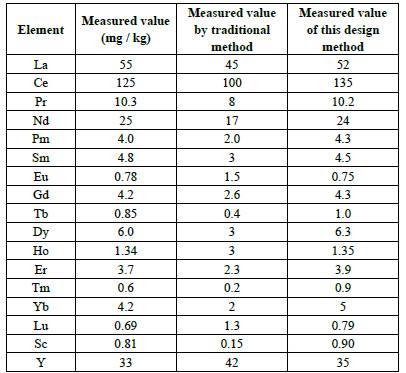
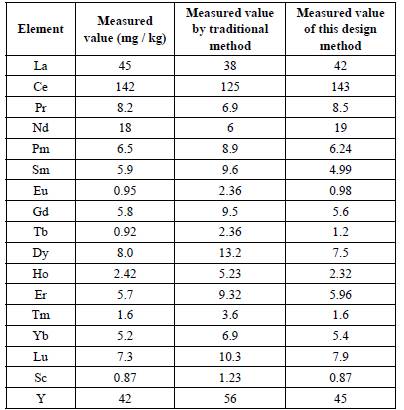
Four samples of rare earth in the surrounding rock of geological strata were measured to determine the element values of these four samples. The accurate determination of the element values represents the trace effect of rare earth elements. Which is as shown in Table 7.
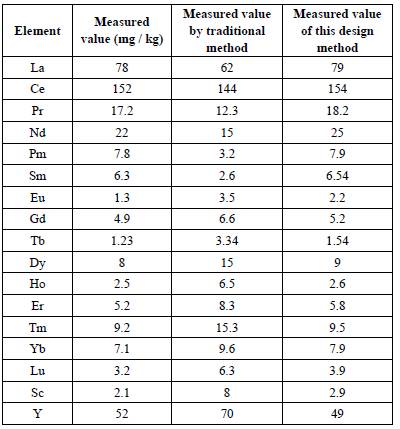
The measured values of sample 2, traditional methods and the designed values are as shown in the Table 8:
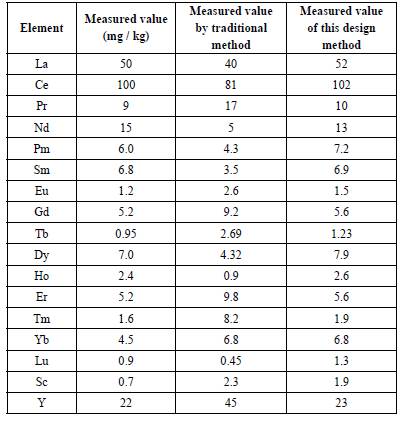
The measured values of sample 3, traditional methods and the designed values are as shown in Table 9:
The measured values of sample 4, traditional methods and the designed values are as shown in Table 10:
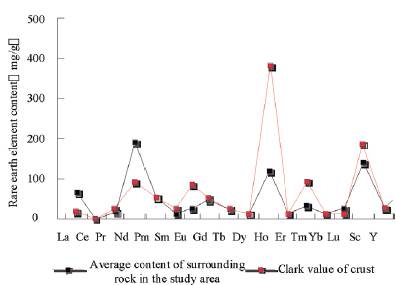
From the above table 7, table 8, table 9 and table 10, it can be seen that the tracking value of the designed tracking method for rare earth elements in the surrounding rock of geological strata based on the three-dimensional positioning algorithm has a small difference from the measured value, and there is a timely error, which is also within a standard value. However, there is a big difference between the traditional method and the actual measurement value, so it can be proved that the designed method based on 3D positioning algorithm is better than the traditional method. According to the content of rare earth elements, the correlation curve was drawn. Which is as shown in Figure 5.
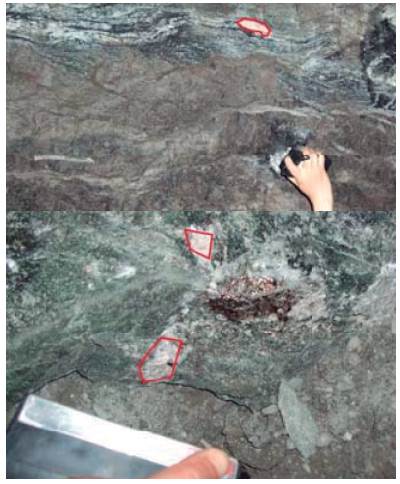
Scanning electron microscopy was used to characterize the morphology of surrounding rock. Rare earth elements have good dispersion. The abscissa represents the spectral wavelength, and the ordinate represents the three primary color stimulus values needed to match the spectral colors. The chromatogram of rare earth element tracing detection is as shown in Figure 6.
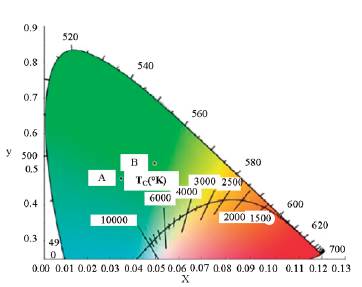
Point A and point B are in the green area. Point B is darker than point A, and the higher the color saturation is, which is conducive to the trace detection of rare earth elements. In this paper, the interference of mass spectrometry and non mass spectrometry in rare earth element tracing is analyzed, and the three-dimensional positioning algorithm is used to trace rare earth elements in the surrounding rock of geological strata, which has better tracking effect.
Conclusions
In this paper, based on the three-dimensional positioning algorithm, the study of rare earth element tracking in the surrounding rock of geological formation is proposed, and the interference of mass spectrum and non mass spectrum in rare earth element tracking is analyzed. The three-dimensional positioning algorithm is used to track rare earth elements in the surrounding rock of geological formation. Compared with the traditional method, it has better tracking effect. In the next step of research, we need to establish a more reasonable channel model to verify the effectiveness of the tracking method. We can use simulation software or build a more real network environment to experiment the method, so as to promote the application in the actual network environment. This is a problem that needs to be seriously considered.

