


 English (pdf)
 Article in xml format
 Article references
 Send this article by e-mail
 Cited by SciELO
  Cited by Google
  Similars in
SciELO
Similars in
SciELO  Similars in Google
 Permalink
Introduction
China is a country with many geological disasters. There are many kinds, wide distribution, frequent activities, and serious geological disasters, which is one of the most serious countries in the world. Geological disaster refers to the event or phenomenon where the geological environment is destroyed suddenly or gradually due to geological processes (natural, artificial, or comprehensive), and human life and property are lost (Kleemann et al., 2019). For the classification of geological disasters, there are different angles and standards, which are more complex. In terms of its causes, the geological disasters mainly caused by natural variation are called natural geological disasters; the geological disasters mainly induced by human actions are called human geological disasters. According to the different ways of energy release, its main types include earthquake, volcanic eruption, mountain collapse, landslide, debris flow, land subsidence, ground fissure, etc. Although geological disaster is an inevitable phenomenon in the process of earth evolution, its occurrence will bring great influence and destructive power to people (Masson et al., 2018). Due to the impact of geological disasters on human society, many scholars have been exploring the general laws of these disasters, trying to find a way to prevent or evaluate geological disasters. At present, the research on geological disasters mainly focuses on risk assessment, risk analysis, early warning, and prediction model, while the research on the relationship between different combination forms of geomorphic morphology and spatial distribution of geological disasters is relatively less (Galbraith & de Lavergne, 2019). At the same time, slope, length, and density of ravines are often used in the study of geomorphic form, which is characterized by only one aspect of a single geomorphic type and highly generalizing the linear characteristics of geomorphic form. It not only causes partial distortion of geomorphic form information but also does not fully reflect the essential characteristics of complex and broken geomorphic form, namely, the amount of its comprehensive properties is not enough. However, with the development of fractal theory, its purpose is to explore the common, unpredictable, unstable, and very random systems, phenomena, and processes in nature, and try to find a new order between order and disorder, macro-micro and global-local. Using the simple fractal function, we can depict the Mandelbrot landscape which can reach the truth. Like the real natural landscape, they have no characteristic length, which is difficult to realize by any mathematical physical model, and have been widely used in many subjects. Although the fractal theory is still in its infancy in the study of geological disasters, it is gradually found that the geomorphic morphology shows fractal characteristics, and fractal can be used to quantify the geomorphic morphology of different structures (Hansen et al., 2018).
The geomorphic form is the final form of modern tectonic movement (Cui & Wang, 2019), one of the important underlying factors affecting the rainfall, runoff, and sediment yield process, and one of the important factors for the prediction of water and soil loss in the basin. Due to the diversity of basin geomorphology and the complexity of spatial combination, the scientific and accurate quantification of basin geomorphology has become one of the key problems to be solved in the establishment of a widely applicable basin water and soil loss prediction model. Domestic and foreign researchers generally choose one or more of the average slope, average slope length, watershed height difference ratio, gully density, and gully cutting depth as the quantitative parameters of the geomorphic factors in the watershed water and soil loss prediction model, but these quantitative parameters only represent the characteristics of one aspect of the watershed topography, and the expression of the integrity and comprehensiveness of the watershed topography is not very reasonable. Therefore, there are obvious limitations in the application of this method in the field of water and soil loss assessment and prediction (Soloviev et al., 2018).
The fractal theory is an important branch of mathematics in nonlinear science. It was founded by American mathematician B. B. Mandelbrot in the mid-1970s. The fractal theory aims to explore the common, unpredictable, unstable, and very irregular systems, phenomena, and processes in nature, and try to find a new order between order-disorder, macro-micro, and whole part, which is an important part of the modern scientific theory of complexity. Although the geomorphic morphology (such as mountains, water systems, coastlines, etc.) seems to be messy and complex, it can be found that they still have certain mathematical (geometric) laws by fractal theory analysis and can be quantitatively described by fractal dimension (Benammi et al., 2018). The fractal theory has opened up a new way for the non-linear study of geomorphic morphology description and simulation, geomorphic development process, etc. However, continuous research and practice have found that the complexity of geomorphic phenomena can not be completely described only by a single fractal dimension which depends on the overall characteristics. The complexity of geomorphic morphology shows obvious multifractal characteristics, which can be regarded as a large number of fractal sets with different scale-free areas. Therefore, in order to solve the complexity problem in geomorphology effectively, it must focus on the complex multifractal problem, which is of great significance to comprehensively grasp the characteristics and formation laws of various geomorphic phenomena. Multifractal theory, as the leading edge of fractal theory, is the further development of fractal theory. It is proposed to study the phenomenon of non-uniformity and dissimilarity in nature. It uses spectrum function to describe the special structure behavior and characteristics caused by different local conditions or different levels in the evolution process of the fractal structure and discusses the distribution law of probability measure of characteristic parameters by the method of statistical physics. The introduction of multifractal can deeply describe the complex features of landforms, thus revealing more information on landforms. With the development of computer and GIS technology, a digital elevation model (DEM) can directly display and express the three-dimensional shape of the basin landform. Taking the basin landform DEM as the research object, according to the fractal theory and the multifractal correlation calculation model, it is possible to directly quantify the multifractal characteristics of the basin three-dimensional landform (Ali & Lee, 2018).
The correlation analysis between the multifractal characteristics of regional geomorphology and the development of geological disasters
Description of multifractal characteristics of regional landform
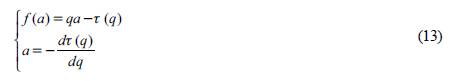
When describing the multifractal characteristics of regional geomorphology, we use the basic fractal characteristics of self-similarity or scale invariance to describe quantitatively through fractal dimension index. It is a common phenomenon in many fields such as geomorphology to synthesize self-similarity and invariance. Therefore, for many fractal bodies with non-uniform and singularity, one dimension cannot describe all their characteristics, so it needs to use multiple dimensions fractal measures (Chardon et al., 2018). Let μ be a probability measure distributed on region O. If the concentration of μ changes greatly, that is, for a very small r, it has the following relations:

In the above equation, B (x, r) represents the local neighborhood ball with radius r, a is the singular index, and the singular index a corresponding to different subsets is different. Therefore, μ is a multifractal measure, multifractal measure is a singular measure, and it does not have a density function. Therefore, multifractal is an infinite set of singular measures defined on fractals and composed of multiple scale indexes (Salin et al., 2019).
In the study of the distribution of measure yields on fractal volume F, fractal volume F can be divided into several units with scale r, and u is used to represent the average value of measure yields in the i -th unit. There is the following scaling relationship between the average measure u and scale r of each cell:

In the above equation, α i is the singularity index. If some elements have the same singularity index α, their measures can be expressed by μ(α). If .Fa is used to represent the subsets of the elements with the same singularity index a, then the S-dimensional Hausdorff measure of Fα can be defined as:
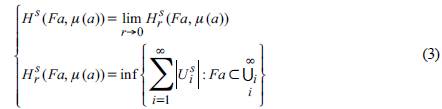
Moreover, the s-dimensional Hausdorff measure H S (Fα, μ (α)) satisfies the following relations:
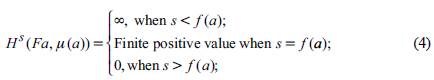
In the equation above, f (α) is the Hausdorff dimension of the subset. If in the interval [α, α+dα], the number of elements whose measure is μ (α)is N(α), then
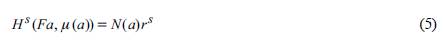
Thus, it exists

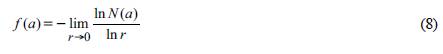
According to the above Equations 4 and 6, only when the following equation is satisfied,

So that H S (Fα, μ(α)) can be taken as a finite value, from which we can get:
For uniform measure distribution, there is only a value; for non-uniform measure distribution, f (α) is a convex function of a. In multifractal theory, f (α) is the singular spectrum of multifractal. a is the singularity of different sub regions, and its size is determined by the measurement distribution of the generating unit of the corresponding sub regions. f(α) is the fractal dimension of the sub regions with the same singularity a. From Equation 6, we can see that its size is related to the number of subregions with the singularity a. f(α) reveals the distribution structure and change of different singularity a in the fractal body, which is a measure of the complexity, irregularity and unevenness of the fractal body. It describes the physical characteristics of different localities or layers on the fractal body (Alejo & Montes-Rojas, 2018). Here f (α) is a basic language to describe multifractal.
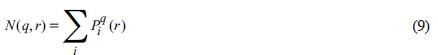
The multi-fractal shape of regional geomorphology is divided into small units with scale of r, P.(r) is defined as the probability of Unit i, μ is the probability measure, and when q>> 1 and P i >>P the q step of probability measure μ can be defined as:
If there is a critical index t(q) that depends on the q-order distance of P i , when t(q) is defined as the mass index, then the generalized dimension can be defined according to the q-order distance of μ, and the calculation results are as follows:
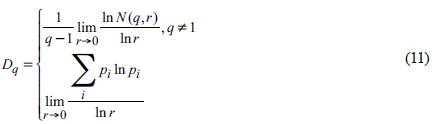
In the above equation, D q is the sum of the /-power of each subset of space's singular measures, reflecting the degree of singularity of each subset from the overall point of view, and calculating the generalized multi-fractal characteristic dimension curve of regional landform, as shown in the following figure:
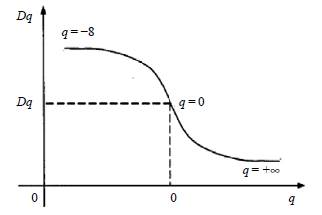
According to the characteristic curve shown in the figure above, D q and t(q) satisfy the following relationship:
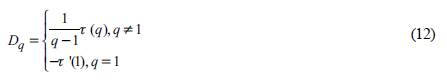
When D q and t(q) are differentiable, there is a Legendre transformation, as follows:
In the above equation, x is the Legendre transformation coefficient. So for the general multifractal spectrum f (α) is a single peak convex function about a, it increases monotonically in q >0 part, decreases monotonically in q <0 part, when q=0 , f (α) gets the maximum value, and the multifractal spectrum image obtained is shown in Figure 2 below:
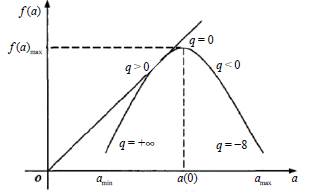
It can be seen from the above figure that the physical meaning of f (α) is a measure of the complexity, irregularity and unevenness of fractal structure.
Different singular indexes α reflect the properties of different probability measure subsets (Sachica & Martinez, 2018). For a simple fractal, the multifractal spectrum a ~f (α) is transformed into a point. At this time, this point is the multifractal feature of the regional landform described. Retaining the multifractal feature points of the regional landform, combining the spatial relationship of the development of geological disasters, and calculating the correlation coefficient between the multifractal feature of regional landform and the development of geological disasters, the correlation analysis of the two can be completed.
Analysis of spatial relationship of geological disaster development
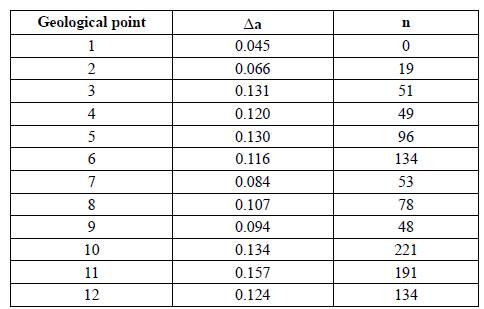
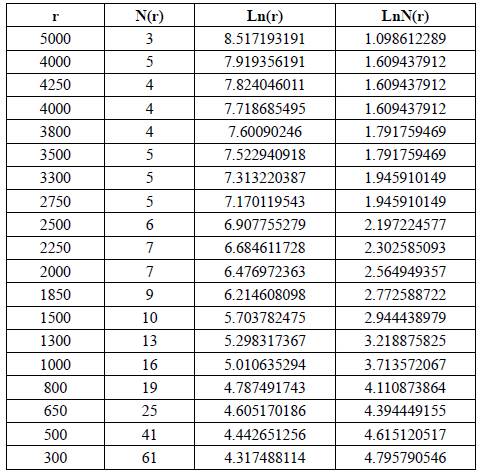
Before analyzing the spatial relationship of geological hazard development, 12 geological points are selected first, and then the geological hazard is divided into landslide, collapse and debris flow by using the fractal characteristic parameters of landform and the spatial distribution characteristic parameters of geological point landslide hazard. Firstly, the corresponding relationship between the width of fractal spectrum Aa and the number of landslides and hidden dangers is established, as shown in the following table:
According to the data shown in the above table, the relationship among Δa and the number of landslides and hidden geological disasters is obtained, as shown in the following figure:
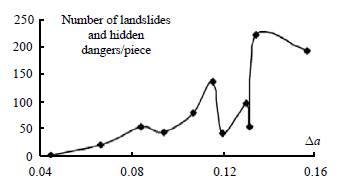
According to the above diagram, the following landslide coupling spatial relations can be concluded:
In general, with the increase of Δa, the number of landslides also increases, which indicates that there is a significant correlation between the multifractal characteristics of geomorphic morphology and geological disasters of landslides. Furthermore, with the increase of Δa, the complexity of geomorphic morphology and the probability of occurrence of landslides increase, the number of landslides will also increase (Zhang et al., 2019).
The number of landslides can be divided into three levels: when Δa<0.100, there is a positive correlation between Δa and the number of landslides. That is to say, with the increase of Δa, the number of landslides and potential disasters increases, but the number of landslides in this section is less, up to 53.When 0.100< Δa<0.134, the number of landslides fluctuates relatively large, indicating that the change range of geomorphic singular index is in this area, and the occurrence of landslides is very unstable, showing a certain degree of volatility.When 0.134 < Δa< 0.157, the number of landslides is about 200, indicating that when the change range of geomorphic singular index is in this area, landslides are more likely to occur.
In the case of collapse, according to the fractal characteristic parameters of geomorphology and the spatial distribution characteristic parameters of particle collapse and hidden geological disasters in different places, the corresponding relationship table between the depth of geomorphic pleomorphic spectrum and the number of collapses n is established in the same way as landslide, as shown in the following table:
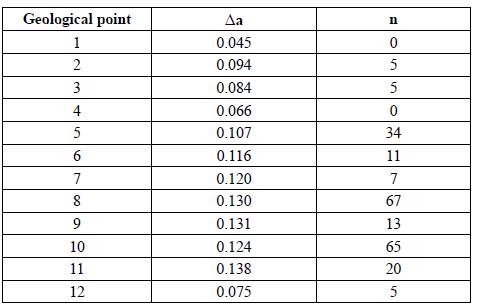
According to the data shown in the above table, the relationship among Δa and the number of collapse and potential geological disasters is obtained, as follows:
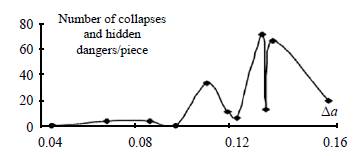
Figure 4 Relationship among Aa and the number of geological disasters caused by collapse and hidden danger
From the diagram above, the following spatial relation of collapse coupling can be concluded:
Generally speaking, with the increase of Δa, the number of collapses also increases, indicating that there is a significant correlation between the multifractal characteristics of geomorphic morphology and the geological disasters of collapses, and further indicating that with the increase of Δa, the complexity of geomorphic morphology increases, the probability of collapses increases, and the number of collapses will also increase. When the number of collapse disasters changes with the change range of geomorphic singular index Δa, the change characteristics can also be divided into three levels: when Δa<0.100, the number of collapse and hidden danger disasters is very small, and there is almost no collapse geological disaster phenomenon in this section (Leonarduzzi et al., 2018).When 0.100<Δa<0.134, although the number of collapses increases with Aa, it also shows some volatility in this range, especially between 0.130 and 0.134, the number of collapses first increases, then decreases and then increases, indicating that the change range of geomorphic singular index is in this region, and the disaster phenomenon of collapses is very unstable; when 0.134< Δa<0.157, the number of collapse disasters is large, but there is a downward trend, which may be related to the disaster prevention measures taken by people in engineering activities.
Similarly, when analyzing the spatial relationship of the development of debris flow geological disasters, the corresponding relationship table between the depth of geomorphic pleomorphic spectrum and the number of debris flows is established, as shown in the following table:
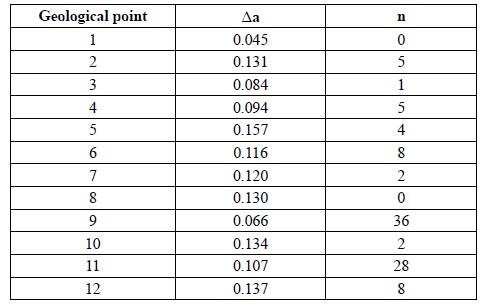
Similarly, the relationship among Δa and the number of debris flow and potential geological disasters is obtained as follows:
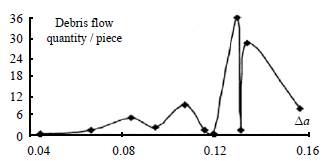
From the above diagram, the following coupling spatial relations of debris flow disaster can be concluded:
In general, with the increase of Δa, the number of debris flow increases, which indicates that there is a significant correlation between the multifractal characteristics of geomorphic morphology and the geological disasters of debris flow. Furthermore, with the increase of Δa, the complexity of geomorphic morphology and the probability of debris flow disasters increase, the number of debris flow disasters will also increase. The number of debris flow disasters can also be divided into three levels according to the variation range of geomorphic singular index Δa. When Δa<0.120, there is a positive correlation between Aa and the number of debris flow. That is to say, with the increase of Δa, the number of debris flow disasters increases, but the number of debris flow in this section is less.When 0.120<Δa<0.134, although the number of debris flow increases with the increase of Aa, it also presents certain volatility in this range, especially between 0.130 and 0.134, the number of debris flow increases first, then decreases and then increases, indicating that the change range of geomorphic singular index in this region, the disaster phenomenon of debris flow is very unstable.When 0.134 < a < 0.157, the number of debris flow disasters is large, but there is a downward trend, which may be related to the disaster prevention measures taken by people in engineering activities (Fan et al., 2018).
To sum up, the change characteristics of the number of geological disasters at the twelve selected geological points in the change range of geomorphic singular index Δa can be roughly divided into three levels: when Δa<0.100, there is a positive correlation between Δa and the number of disasters, that is, with the increase of Δa, the number of disasters increases, but the number of disasters in this section is less; When 0.100 <a <0.134, the fluctuation of the number of disasters is relatively large, indicating that the change range of the geomorphic singular index is in this area, the landslide disaster phenomenon is very unstable, showing a certain degree of volatility; when 0.134<Δa<0.157, the number of disasters is large, indicating that the change range of the geomorphic singular index is in this area, the geological disaster phenomenon is more likely to occur. According to the spatial analysis of the spatial relationship of the development of geological disasters, combined with the multifractal characteristics of regional landforms, the correlation coefficient between the two is calculated, and the correlation analysis between the multifractal characteristics of regional landforms and the development of geological disasters is completed.
Calculation of correlation coefficient
When calculating the correlation coefficient between the multifractal characteristics of regional landforms and the development of geological disasters, combining the above-mentioned spatial relations of geological disasters and the multifractal characteristics of regional landforms, the weights of the two are calculated firstly, and then the area is divided into T units of the same area, among them, D units are landslide units and D units are non landslide units. In this case, the weight in the geological space can be defined as:
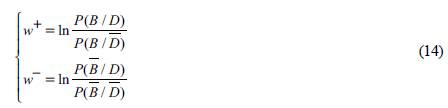
Where, w+ and w- are weight values of evidence factor existence and nonexistence respectively, and for the missing area of original data, their weight values are 0. B is the number of units in the area where the evidence factor exists, and
 is the number of units in the area where the evidence factor does not exist. The above equation (14) is processed by Bayes rule, and the change of the above equation (14) is as follows:
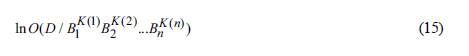
Where, O is the probability, O = P / (1-P ), D is the number of unit grids with landslides, B j . is the j-th evidence layer, and K (j) is the j-th evidence layer. Assuming that there are related variables in equation (15), the logical function of the correlation coefficient is established as follows:
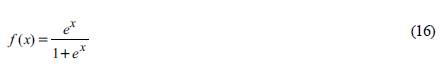
According to the definition of expected value of discrete random variable, when P represents the probability of y = 1, we can get:
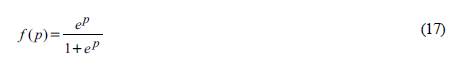
From the above equation, the change of function f (p) to x is insensitive and slow near f (p) = 0 or f (p) = 1, and the degree of nonlinearity is high. In this case, the logistic transformation of f(p) is introduced, namely:
Therefore, at this time, the correlation coefficient between the multifractal characteristics of regional geomorphology and the development of geological disasters can be calculated
From the above equation, p is the final correlation coefficient. Using the above calculation and derivation process, when analyzing the correlation between the multifractal characteristics of regional landforms and the development of geological disasters, the correlation is converted into numerical value, and the data between the two are constantly transformed to obtain the change of the other caused by the change of one party, so as to obtain the correlation between the multifractal characteristics of regional landforms and the development of geological disasters, and complete the analysis of the correlation between the two (Valenza et al., 2018).
Experiment
Experiment preparation
The computer experiment environment for experiment preparation is shown as follows:
The of geomorphic multiplicity characteristic and the coefficient of geological disaster development of the experimental preparation area are shown in the following table:
Table 4 Parameters of regional geomorphic multiplicity characteristic and geological disaster development data
Based on the above data preparation, two traditional correlation analysis methods and the correlation analysis methods for regional geomorphic multifractal characteristics and geological disaster development are used for experiments, and the accuracy of the three correlation analysis methods is compared (Yang et al., 2020).
Analysis of experimental results
Using the correlation coefficient calculation equation, the coefficients in Table 4 is calculated, and finally the experimental results obtained by the three correlation analysis methods are as follows:
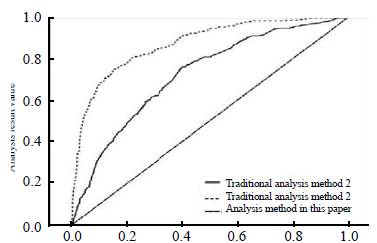
From the above experimental results, it can be seen that with the increase of the parameters of regional geomorphic multiplicity characteristic and geological disaster development data, the analysis results obtained by traditional analysis method 1 show irregular changes. Compared with the traditional analysis method 2 (Wu et al., 2020), the correlation analysis method of regional geomorphic multifractal characteristics and geological disaster development is larger, and the error of correlation analysis is larger. However, the results of traditional correlation analysis method 2 show linear alternation between regular and irregular, and the error of correlation analysis is small. However, the correlation analysis method of the multifractal characteristics of regional geomorphology and the development of geological disasters shows a linear change, which shows that there is a strong correlation between the multifractal characteristics of regional geomorphology and the development of geological disasters, and there is almost no error in the actual analysis, so it is suitable for the actual correlation analysis (Cheng et al., 2020).
Conclusions
Taking topography and geomorphology as the research object, using fractal, multifractal theory and GIS technology, combined with geomorphology, disaster statistics and other interdisciplinary theories and methods, taking digital elevation model as the basic data source, the multifractal calculation model of temperature geomorphology and the realization method based on GIS technology are proposed, and the spatial-temporal characteristics of main types of geological disasters are analyzed (Gao et al., 2018). The related parameters such as the multifractal spectrum, linear interval and surface area distribution probability of the three-dimensional landforms in this area are calculated, the multifractal characteristics of the three-dimensional landforms are revealed, and a coupling model based on the relationship between the multifractal characteristics of the landforms and the number of geological disasters is established (Gao et al., 2019). The coupling relationship between the multifractal characteristics of the landforms and the number of main types of geological disasters is analyzed, and the rationality of multifractal feature of geomorphology as a comprehensive quantitative index to study geological hazards is revealed.

