


 English (pdf)
 Article in xml format
 Article references
 Send this article by e-mail
 Cited by SciELO
  Cited by Google
  Similars in
SciELO
Similars in
SciELO  Similars in Google
 Permalink
Introduction
Remote sensing technology (RS) is a high-tech applied to agriculture in the late 1970s. According to the theory of electromagnetic waves, it is a comprehensive technology (Chen, 2017) to collect, process, and image the electromagnetic wave information radiated and reflected by a longdistance target using various sensing instruments, which allows detection and identification of multiple scenes on the ground. The popularization of RS technology has driven the development of some related technologies, and its application has been continuously improved. Now it is widely used in the dynamic monitoring of land use. It can quickly and accurately analyze the dynamic changes in the interpretation of landforms, textures, colors, or other features in towns, rice fields, gardens, woodlands, and specific locations. (Li et al., 2016).
For the research of remote sensing of natural resources, the coupling research of natural resources and ecological environment system supported by remote sensing technology is paid more attention in the world at present, which is very important for mastering the spatial and temporal distribution law of the quantity and quality of natural resources (Du et al., 2018; Hu, 2018; Lisowski, 2018; Zeng et al., 2018). Typical research examples include NASA, engineers, and soldiers. They use the method of combining remote sensing and natural resource models to study the integrated natural resource simulation and management in the United States (McRoberts et al., 2018). The environmental simulation and resource management of four rural natural resources in the Netherlands conducted by the Netherlands soil research Institute (Bi, 2020; Pan, 2018; Pei et al., 2018). The main contents of these studies are the migration of natural resources and their behavior process in the ecosystem, the driving and restricting factors of the behavior process of natural resources. With the advent of multi-angle remote sensing, it is possible to determine the structure parameters of the ground and then the spectral parameters of the components through the inversion of the bidirectional reflection model, which makes the expectation of quantitative remote sensing higher and higher. In the 1990s, Verstrateet, Pinty, and Myneni published their research results, trying to theoretically and conceptually define the potential and limitations of remote sensing inversion to extract surface information. All three scholars are experts who have made great achievements in modeling bidirectional reflection and multi-angle remote sensing. They have a profound understanding and incisive opinions on the essence and difficulties of remote sensing inversion. They have incisive discussions on many aspects, such as the limitations of empirical models, the necessity of quantitative remote sensing, the information fusion of multi-angle remote sensing and multispectral remote sensing, and put forward the "model for (specific data)". At present, experts engaged in remote sensing model inversion in China have done a lot of work in the inversion of soil moisture, vegetation biomass, and other surface parameters. Scholars and professors represented by Li Xiaowen have summed up the "data-based inversion target decision" from practice, and the staged segmentation of data set and parameter set based on the "uncertainty and sensitivity matrix of parameters". The development of hyperspectral resolution remote sensing or imaging spectral remote sensing technology is one of the major technological breakthroughs made by human beings in earth observation in the future and is the leading technology of remote sensing at present. After a long time of development, a series of hyperspectral imaging systems have been successfully developed in the world and have been widely used in aviation platforms (Dong et al., 2018; Kundakci & Nas, 2018; Li et al., 2018). After a series of important technical problems in the application of hyperspectral remote sensings, such as the calibration and quantification of hyperspectral imaging information, the visualization and multi-dimensional expression of imaging spectral image information, image spectral transformation, and extraction of spectral information, a large amount of data processing, spectral matching, spectral recognition, and classification, they have been basically solved. On the one hand, hyperspectral remote sensing is in the experimental research stage gradually turns to the practical application stage (Cai et al., 2017).
The remote sensing instrument used in this paper is MODIS, which is used to monitor the natural resources of the Libo scenic area. After image processing, the image is segmented and classified in multi-scale. On this basis, the stepwise regression analysis method based on the least square estimation is used to build the model, which can improve the water resources and forest resources in Libo scenic spot Action monitoring (Xie et al., 2018).
Materials and methods
Research object
Libo scenic spot is located in Libo County in the south of Guizhou Province, belonging to Qiannan Buyi and Miao Autonomous Prefecture. It is the abbreviation of Zhangjiang national key scenic spot (National 5A level) in Libo, which is composed of eight natural scenic spots and five red scenic spots. It belongs to the subtropical monsoon humid climate area. The general trend of temperature distribution is higher in the South and lower in the north. When the terrain is increased by 100 m, the temperature drops by 0.55°C; The valley area is higher than the mountain area of the same height, the East-West Valley is higher than the North-South Valley, the south slope is higher than the north slope, and the closed valley basin is higher than the same high slope. The annual average temperature of the county is 18.3°C. The hottest month is July and the coldest month is January. The average temperature in July is below 27.0°C, and the extreme maximum temperature is not more than 40.0°C; The average temperature in January is above 5.5°C, and the extreme minimum temperature is above -10.0°C. The terrain gathers the comprehensive advantages of the Guizhou Plateau and Guangxi hills. There are both mountains and hills, which belong to the karst landform. The rivers in Libo belong to the Longjiang river system and Pearl River Basin. The larger river systems in the county include the Dagou river system (including the mainstream of Zhangjiang River and the tributaries of Fangcun River), the Sancha River system, and the Jiacai river system. Libo scenic spot contains typical cone-shaped karst landform and related surface and underground karst morphology; Special karst primitive forest ecosystem known as "Emerald" and related natural elements such as rock, soil, hydrology, animal and plant communities, which show the ongoing biological ecological process; Many endangered, endemic and protected animals and plants and their dependence Habitat for survival; It also includes various landforms and ecological landscapes showing the natural beauty of this area. Libo scenic area has rich natural resources and beautiful scenery.
Remote sensing data processing
The flow chart of remote sensing image processing with MODIS is shown in Figure 1.
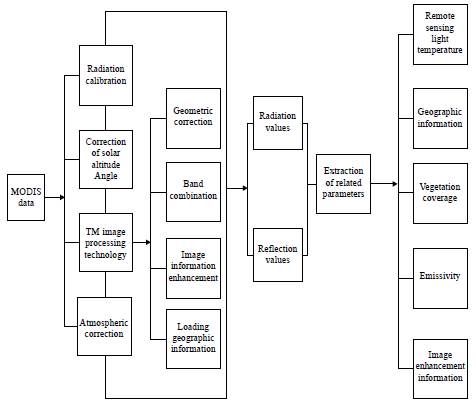
The OMDIS detector is a passive swing scanning detector with a transverse scanning angle of ±55'. Each scan line consists of 13 541 km pixels or 2 708 500 m pixels or 5 461 250 m pixels. Due to the curvature of the earth, the actual span of the scan line is approximately 2 340 km (Reiche et al., 2018). For each scan, the MODIS detector travels 10 km along the orbit, forming a scan strip. After obtaining MODIS remote sensing data, TM image processing technology is used for image processing, and the solar altitude angle, geometry, and atmosphere are corrected. After obtaining the reflection value and radiation value, relevant parameters are extracted. The applied parameters include remote sensing brightness temperature, vegetation coverage, image enhancement information, geographic information, and specific radiation rate.
TM remote sensing image processing technology
The main purpose of remote sensing image processing is to grasp the situation of forest resources in a wide range, to provide information quickly and macroscopically, to output high-quality images, and to provide a basis for visual interpretation and classification.
(1) Geometric correction
According to the characteristics of the TM remote sensing image, we choose the geometric correction method of a quadratic polynomial. When using this method for correction, we choose the same name ground feature points that are evenly distributed and easy to determine on the image map and topographic map, such as the intersection of farmland forest network; The intersection of roads, rivers, canals, etc. (Wei et al., 2016). In general, as long as the control points are selected properly and used accurately, the error is usually less than one pixel.
(2) Band combination
The information of TM channels is related to the spectral characteristics of vegetation reflection, so it is very important to optimize TM band combination for the application of TM image in forest resource monitoring. According to the characteristics of plant reflection spectrum and vegetation TM spectrum, the combination of TM4.5.3 band is a better pseudo color synthesis scheme.
(3) Image information enhancement
For the pseudo color image of TM4.5.3 after synthesis, in order to highlight the information of remote sensing image and distinguish different land type features, the multi-stage gray stretch transform is adopted, which can stretch all the ground objects linearly in the range of 0-255 of national radiance level, or stretch different targets in a certain gray range, and compress other non-target ground objects processing to achieve the purpose of extracting and enhancing the target features (Pahlevan et al., 2017).
The general expression of the multi-segmental gray-scale twist to stretch transformation is as follows:
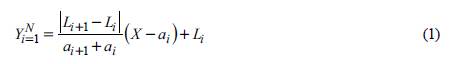
Where: X and Y are the luminance values X,Y Є(0- 255) after TM image stretching transformation; α i+1 and α i , L i+1 and L i . are the stretching range required by the original image determined by the user and the corresponding luminance value range after stretching; N is the number of segments.
(4) Loading geographic information
In order to facilitate the use of images, loading the geographic grid information can make the satellite image better applied. Combined with the fourth reexamination of forest resources in Liaoning Province, 2kinx2kin network and 1/50000 international topographic map frame line were loaded. Use a topographic map for a sampling survey to verify whether the grid point is correct.
After processing the MODIS remote sensing image, in order to obtain high-precision remote sensing images, it is necessary to correct and remove the interference data in the image. The specific methods are as follows.
Atmospheric correction
From the perspective of radiation data processing, the radiation distortion components entering the sensor include extinction (absorption and scattering) of the atmosphere, sky-light (atmospheric scattering) irradiation = path radiation. It is difficult to correct the influence of the atmosphere on radiation transmission because of the inaccuracy of atmospheric environmental parameters (Liang et al., 2016). There are two kinds of common correction methods. One is to solve the radiative transfer equation (approximately). Another method is to use the data of a ground survey. Set a marker with known radiation characteristics, and the sensing instrument outputs its radiation data. At the same time, the measurement does not include the radiation output data of the atmospheric path. By comparing the two, we can get the effect of the atmosphere. It is obvious that this method is limited by the correction factor to eliminate the influence of the atmosphere.
Using American Modtran4, 6S, Lowtran7 and other atmospheric correction software to carry out an atmospheric correction for MODISBI data FLAASH is an extension module of ENVI for rapid atmospheric correction analysis of spectral data. The purpose of atmospheric correction is to eliminate the influence of atmosphere and light on the reflection of surface objects and to obtain the real physical model parameters of the surface, such as the reflectance, emissivity, and surface temperature. FLAASH can not only eliminate the influence of water vapor, oxygen, carbon dioxide, methane, and ozone on the surface reflection but also eliminate the influence of atmospheric molecules and aerosol scattering. FLAASH can process any hyperspectral data, satellite data, and aviation data (860lnn/1135lnn). Acceptable sensor types include HTMAP, VAIRIS, CASI, HYDICE, OrbView-4, NEMO, and more (Yang et al., 2016). At the same time, FLAASH can also correct the vertical imaging data and the observation imaging data. This module is initiated by AirForCeResearchLabs (AFR)L, which studies DTRAN atmospheric transport models. It is developed by SpectarlSeienceS, Inc. (551), a leader in atmospheric correction algorithm research. Research Systems, Inc. (RSI) is responsible for the GUI design and module integration of the FLAASH module.
Solar height angle correction of reflectivity
(1) MODISLBI data product is the radiation and reflection of the top layer of the atmosphere (to) a, which has been positioned and calibrated. The reflectivity conversion formula is:

Where Reflectante is the reflectivity, refc tan ce - scale [B] is the reflection calibration coefficient, reflectance - offsets[B] is the reflection offset, and SI is the standard quantity.
(2) The reflectivity is related to the solar altitude angle and changes with the change of the solar altitude angle. The relationship between reflectivity and solar altitude angle: p = p cosθ, where p is the TOP reflectivity; θ is the solar altitude angle.
(3) Because the influence of the atmosphere on MODIS 1, 2, and 6 band data is relatively small, the influence of the atmosphere can be ignored.
Data bad value and noise removal
Due to the bad band value of the data caused by the sensor's test sale, the sensor drift causes noise in the data. The interpolation and the Fourier transform are used to eliminate the noise as much as possible. The elimination of the bad value of the strip is to use the method of linear mashing to fill the bad points with the linear combination of the values of the adjacent points (Li, 2016). The data obtained from the remote sensing sensor is the radiation value of the atmosphere surface (TOA). In the process of data processing, it is converted into the reflection value (p*=p cosθ) according to the following formula:
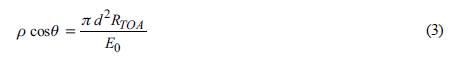
Where, R TOA is the radiation value of the surface layer of the atmosphere; p cosθ is the reflectivity; E0 is the solar radiation in outer space; (Wm-2um-1)d is the distance from the sun to the earth.
In practical application, we need the p value of solar vertical reflectance, so we need to divide the existing reflectance data by the reflectance of vertical solar radiation cosθ. In the high-resolution remote sensing image, the influence of solar height angle is very small because of the small scanning width. However, for MODIS data with a wide scanning range, the correction of solar height angle is very necessary. If the data describing the solar altitude angle cannot be obtained in the calculation process, for example, the resolution data of 250 m and 500 m only contains coordinate data, and the satellite and solar position data need to be obtained from 100 m data. In this case, the solar high angle of production can be calculated directly through the longitude and latitude information. Because the Terra satellite belongs to a sun-synchronous satellite, the transit time is 10:30 a.m. local time. If the Terra satellite is an eArra satellite, the transit time is 2:30 p.m., which can be converted into Greenwich time: 2:30 and 6:30 respectively, so that the value of solar altitude angle at any position on the earth can be determined.
The Dynamic Monitoring method of natural resources
After removing the interference data in the image and obtaining high-precision remote sensing images, the following methods are used to carry out dynamic monitoring of natural resources in Libo scenic areas.
Multiscale segmentation of remote sensing image
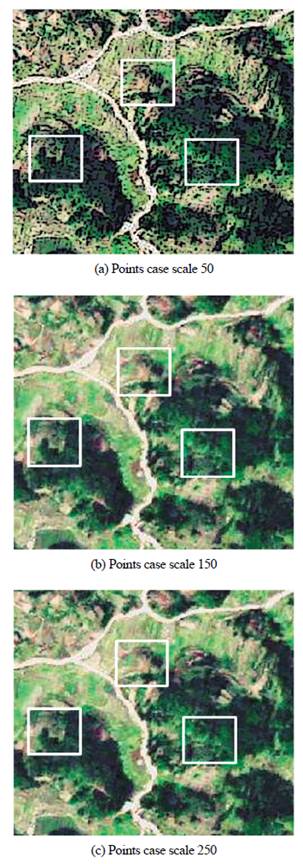
Because the multi-scale segmentation considers the multi-level of the field pattern of the earth's surface and overcomes the fixed size of the data source, it can make full use of all kinds of information and select the most appropriate segmentation scale to segment-specific terrain types, so this segmentation adopts the multi-scale segmentation method. Firstly, the small spot layer and remote sensing image are overlapped, and the image is initially segmented by using the chessboard segmentation algorithm. The boundary of the segmented object is the small spot boundary, and each polygon corresponds to a small spot object. Using this method to segment, the boundary information of the original small spot layer can be preserved completely, which is conducive to updating the small spot data after the completion of classification. If the image is directly segmented for image segmentation, the boundary generated by the segmentation object will be inconsistent with the original speckle boundary, resulting in a larger work amount of updating the speckle after classification (Sun, 2016). Then the segmentation is carried out again, and the segmentation scale is selected as 50, 150, and 250. The comparison of the segmentation effect of the test sample area is shown in Figure 2. After a comparative analysis of the segmentation results of the three corresponding regions in the figure, it is found that when the segmentation scale is set to 150 (Figure 2(b)), the land class can be segmented better, and there are fewer over-segmentation phenomena. After re-segmentation, a new class hierarchy is generated, and the original land class information is integrated, and then each object generated after segmentation is given. At this time, the generated object is the fine segmentation object inside the original speckle object. After classification, the changing area can be quickly extracted.
Hierarchical supervision classification
The method of hierarchical supervised classification can make full use of the inner land classes of each layer. When selecting the training sample area, aiming at the phenomenon of the same object and different spectrum, the method of type subdivision can be used to improve the separation degree between land classes and improve the classification efficiency and accuracy to a certain extent. Therefore, this classification adopts the method of hierarchical supervision and classification.
In this classification, all land types are divided into forest land and non-forest land. After the forest land classification system is determined, the classification is directly carried out in ecognition. For eight different bands, different combinations of different bands or image bands can be selected. The most significant difference between different categories or a certain number of training samples can be selected to supervise the classification and gradually extract the objects of different categories. Finally, the objects of different categories can be obtained.
Taking no forest land (200 > DL > 1500) as an example, this paper introduces the process of changing area extraction in no forest land thematic layer. In view of the small spot objects that have become forestland, the normalized vegetation index (NDVI) is selected for discrimination extraction. By selecting a certain number of training samples, it is found that the threshold value is set to 0.25, then the small spot objects (200 > DL > 150, NDVI > 0.250) that have become Forestland in the original forestland free area can be extracted, and the small spot objects (mainly including water) that have become non-forestland for the forestland free area can be extracted. In the false-color image, the water body is dark black, and the color of cultivated land and construction land without crops is gray or white, which is obviously different from other types of objects. The training samples can be selected, the nearest classifier can be used to supervise and classify, and these three types of objects can be extracted; For sparse forest land, unforested forest land, nursery land, and cultivated land with crops. Because the area of these four kinds of ground objects is not large, they can be modified manually later.
Based on the natural resource change map obtained by classification monitoring, a model is established to monitor the dynamic changes of natural resources.
Model building
With the help of remote sensing (RS), geographic information system (GIS), and global positioning system (GPS), the remote sensing monitoring of various variables of natural resources in Libo scenic spot has been studied by many scholars at home and abroad. The basic idea is generally, the gray value, gray ratio, and GIS information of the RS image corresponding to the ground sample plot are used as independent variables, and the sample plot volume is used as the dependent variable. Through the quantitative method, the monitoring model between the resource change and the independent variable is established. The variable monitoring model of natural resources is generally expressed as formula (4):
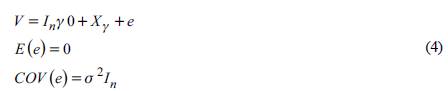
In the formula, y0 is the parameter of the undetermined constant term, e is the vector of nx 1 which represents the random error of observed value of resource change, COV(e) is the covariance matrix of the observed value of canopy density or resource change of n sample plots, σ2 is the observed variance of canopy density or resource change of sample plots, I n is the unit matrix of n order.
In the data obtained in this study, there are few independent variables that can be used as a resource change monitoring model, which is suitable for least square regression modeling. In the limited independent variables, in order to ensure the significance of the variables in the model, stepwise regression analysis is needed. Therefore, in this study, the stepwise regression analysis method based on the least square estimation is used to establish the model.
The independent variable LDLX is land type, PD is slope,X1 is TM 1, X2 is TM (5 + 7-2)/(5 + 7+2), X3 is TM (4+5-2)/(4+5+2), X4 is TM5/4, X5 is NDVI, Y is unit volume. Through the stepwise regression analysis of the least square, the optimal monitoring model is finally established as follows:
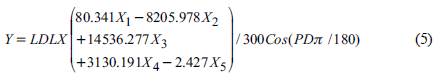
Where Cos(PDϖ/180) is the cosine of the slope (radian).
From formula (5), it can be seen that the variable LDLX (land type) is the slope of the model, which plays an important role in monitoring the change of natural resources; the land type is not a fixed value, and different land types have different values, that is to say, the change of resources is monitored in layers according to the value of land type. The complex correlation coefficient of the regression model is 0.650, which can better reflect the relationship between resource change and remote sensing variables. The significance test of the regression model uses statistics as an F test. When the test reaches the significant or extremely significant level, it can be considered that the regression model has a significant linear regression relationship. F test the regression model. The F (6, 53) value is 6.466. According to the F distribution table, the F value is 2.93 at the level of significance 0.05, less than 6.466, and P = 0.000. The F test reaches an extremely significant level. Therefore, it is considered that there is a significant linear regression relationship between resource changes and remote sensing variables.
Results
Libo scenic area is located in the south of Guizhou Province. The charming karst landform breeds unique scenery and rich natural resources. Among them, Laya waterfall, 68 level waterfall group, primitive forest on the back of tortoise, and water forest are famous in China and abroad. Aiming at the characteristic forest resources and water resources in the Libo area, this paper uses the method to carry out dynamic monitoring.
Dynamic monitoring results of forest resources
The distribution map and current situation map of forest resources change in Libo scenic area monitored by this method are shown in Figure 3.
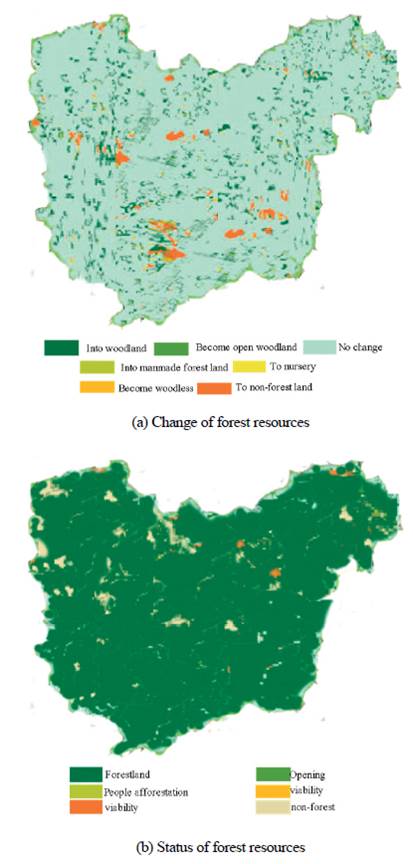
It can be seen from Figure 3 that the area of positive change (change of increase of forest coverage) and reverse change (change of decrease of forest coverage) of forest resources in Libo scenic spot reaches 5205.186 hm2 and 546.524 hm2 respectively, the area without change is 42159.603 hm2, the area with original land type empty is 895.514 hm2, and the area with positive change is obviously large in the area of reverse change.
In the early years, in order to develop the economy in the Libo area, the forest burning and logging in large areas greatly reduced the forest area and destroyed the ecological balance of the original forest. In recent years, the tourism industry has been vigorously developed. Under the policy of returning farmland to the forest to maintain the original forest landform in the Libo scenic area, the large-scale forest building activities in the Libo area have achieved positive results, overcoming the impact of large-scale economic construction on the reduction of forest area. At the same time, the forest coverage area has been greatly increased, providing an ecological guarantee for the long-term development of the Libo scenic area.
This classification accuracy evaluation is mainly based on the data collected by remote sensing technology and field investigation. It mainly focuses on the inspection and verification of the changed objects, especially the reverse change objects of forest resources. At the same time, 342 objects whose image characteristics are not obvious are selected from 3814 changed objects for field verification, and interpretation marks are established. Then visual inspection and inspection are carried out for each object See Table 1 for the results.
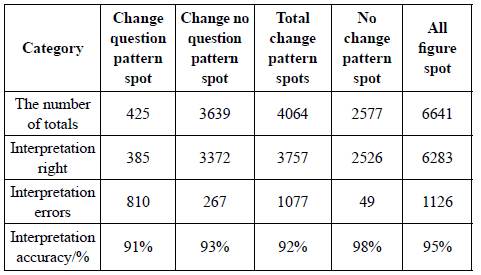
From Table 1, it can be seen that 385 out of 425 change question spots are interpreted correctly, with a correct rate of 91%; 3757 out of4064 change spots are interpreted correctly, with a correct rate of 92%; For all 6641 spots, with a correct rate of 95%. The results show that the dynamic monitoring results of forest resources in Libo scenic spots are good.
See Figure 4 and Table 2 for the dynamic changes of natural resources in Libo scenic spots in recent ten years.
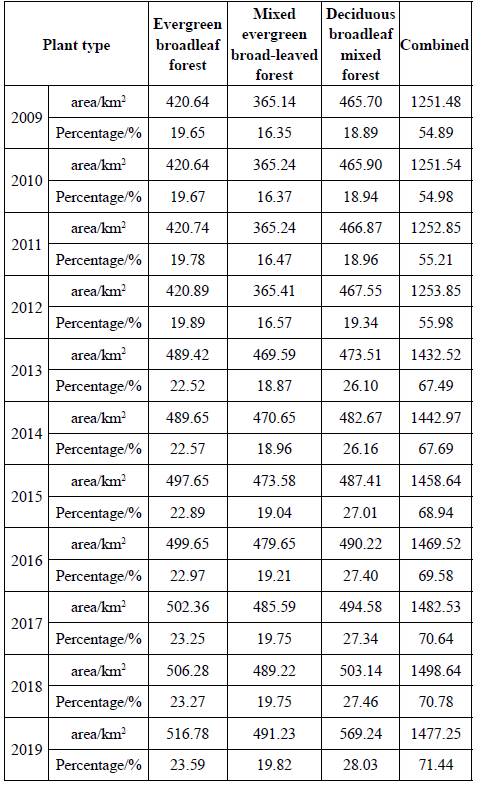
According to the observation of Figure 4 and Table 2, the change of forest resources in Libo scenic area in recent ten years is as follows: in recent ten years, the largest change of land type area of forest resources is the mixed deciduous broad-leaved forest, followed by the evergreen broad-leaved forest, and the smallest change of area volume of the mixed evergreen broad-leaved forest. From Figure 4, it can be seen that there was a significant increase in the area of three land types in 2013. Before 2013, there was almost no change in the area of the three land types. This is because the large-scale development of agriculture in the last century did not maintain the forest resources after burning mountains and logging, and let it grow naturally. Since 2013, the government has carried out the policy of returning farmland to forests and actively developed the tourism industry. Therefore, since 2013, the government has carried out the policy of returning farmland to forest, the area change of forest resources has increased year by year. The area of evergreen broad-leaved forest has increased from 420.64 km2 in 2009 to 516.78 km2 in 2019, an increase of 3.94%; The area of evergreen broad-leaved mixed forest has increased from 365.14 km2 in 2009 to 491.23 km2 in 2019, an increase of 3.47%; The area of deciduous broad-leaved mixed forest has increased from 466.70 km2 in 2009 to 569.24 km2 in 2019, an increase of 9.14%.
Dynamic monitoring results of water resources
Libo scenic area is rich in water resources, and its famous water features include Yuanyang Lake, Qinglongtan, Dongshan Shuibi, Zhangjiang scenery belt, among others. The experiment uses this method to monitor the dynamic changes of the above waters.
Taking Yuanyang Lake as an example, the change of water level at different times is shown in Figure 5.
It can be seen from Figure 5 that the annual water level of Yuanyang Lake in Libo scenic spot monitored by this method has less precipitation in winter and spring, and it is in the dry period. The water level of Yuanyang Lake is low and the water resources are not rich. In summer and autumn, the precipitation increases and the water level rises. Especially from June, the precipitation suddenly increases and the water level rapidly increases, until August, when the water in Libo scenic spot reaches its peak abundant in natural resources and beautiful scenery.
See Table 3 for the growth of water resource areas in the Libo scenic area at different times.
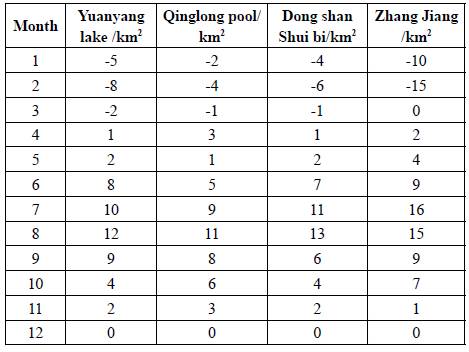
It can be seen from Table 3 that the change of water resource area is monitored by the method in this paper. Due to the drought in winter and spring, the area of water resources has negative growth, and the area of water area is decreasing. After entering the rainy season, the area of water area has an upward trend and abundant water resources. It shows that this method can effectively monitor the dynamic changes of natural resources in the Libo scenic spot.
Discussions
The dynamic monitoring of natural resources based on remote sensing technology has the characteristics of real-time, long-term, comprehensive, and periodic. The survey results must have high accuracy and accuracy. It is feasible to use remote sensing images to monitor the change of natural resources. The remote sensing information has great potential in the monitoring of the change of natural resources. It has great potential in the practical application of production above the county-level Broad prospects (Low et al., 2016). The remote sensing image is the ideal data for the spectral remote sensing monitoring of natural resources change. Its spatial resolution can basically meet the requirements; The spectrum information is very rich, including visible light, near-infrared light, and medium infrared light; The economic cost is low, and part of the data can be downloaded free of charge on the Internet. In the quantitative monitoring of multi-scene or multi-time image remote sensing image of natural resource change, image segmentation is necessary to establish a unified monitoring model of the gray value of different scene or time phase image and natural resource change, improve the stability of the model, and then improve the monitoring accuracy (Benacchio et al., 2016). The correlation between land type and monitoring image is very high, which is an indispensable factor for remote sensing monitoring of natural resources change, and has a significant impact on the monitoring accuracy of natural resources change. Without land type, the monitoring result of natural resource change is only a gray-scale image - the change of unit area (pixel area) (gray value), which is a semi-finished product with both natural resource change and non-daily resource change. Only through the control of land type can the final monitoring of natural resource change be completed. Moreover, land information can be extracted directly from remote sensing images. The remote sensing images used in the extraction of land information and the monitoring of change amount should be different. When extracting the land type information, the greater the difference between the natural resource information and the non-natural resource information in the remote sensing image is, the better, the middle of March or the middle of October is suitable; When monitoring the change of natural resources, the monitoring model is established with the remote sensing image band combination (equivalent to vegetation index) as the variable, and the image phase is suitable for the natural normal growing season in nature (Liu et al., 2017). The establishment of monitoring models is the key to the success or failure of natural resource change monitoring. There are nearly 20 independent variables of remote sensing factors. First, the correlation between these variables and the change of natural resources is very different, and some variables with low correlation need to be eliminated through correlation analysis; Second, there is a correlation between variables, and the correlation between variables must be eliminated through principal component analysis; Third, there are many variables involved in modeling, and the least square stepwise regression method is used, the variables are filtered one by one to determine the modeling variables. Through the above three links, the fitting and stability of the monitoring model are improved.
When the discontinuities of vegetation structure and soil moisture coexist, the model error is the largest, the sub-pixel composition proportion is closely related to the scale error, and the change of wind speed has an obvious impact on the scale error. According to the basic rule of scale expansion, the parameter scale expansion formula of the double-layer model is derived, and the zero error flux result can be obtained by using this expansion method no matter what the non-uniformity is. The method of reducing the resolution and aster images is used to test the actual flux scale error. The results show that the error is obvious at the junction of different coverage types, and the rule of this error is difficult to determine due to the discontinuity of the algorithm itself. In addition, the useless information of roads and buildings for flux calculation is one of the reasons for the large pixel scale error.
In the monitoring of forest resources and water resources, remote sensing technology overcomes the limitation of single point observation and is the best means of large-scale energy balance and water dynamic monitoring. With the gradual improvement of the quantification degree of remote sensing parameters, it is possible to accurately estimate the evaporation rate of the surface, and further realize the remote sensing quantitative measurement of regional water resources. In the selection of ground model, remote sensing can be directly used sensing data and other auxiliary data-driven models are still the first choice for water volume calculation, while the surface temperature provided by the thermal infrared band is one of the most important sources of evaporation information, and it also includes vegetation leaf index and ground relative humidity (Stepenuck & Genskow, 2017). In this paper, based on MODIS remote sensing data, the multi-scale segmentation of remote sensing images is carried out, and the stepwise regression analysis method based on the least square estimation is used to establish the model to monitor the forest resources and water resources in Libo scenic area dynamically. In the research, because the model refinement and the lack of parameter information are always a pair of irreconcilable contradictions, a large part of the energy of this paper is to try to solve this problem, and also has some progress, but under the existing research level and daily operation ability of surface parameter remote sensing, some models still have some difficulties, more simple and efficient models and more parameters. The method of data extraction is two aspects that need to be solved. Because this paper involves many fields and aspects, the research on the remote sensing quantitative measurement of the dynamic change of water resources in the basin is only preliminary, and the new and effective methods need to be further studied. In addition, combining the flux results of remote sensing calculation with the research in other fields is also a work to be strengthened in the future to serve more application needs; from the perspective of methods and models, future research needs more innovation and breakthrough in thinking, and more full use of various types of remote sensing information, while the effective verification of large-area water resources dynamic change methods and remote sensing simulation results is. In order to promote the development of new models and methods, remote sensing experiments and simulation studies should be strengthened.
Conclusions
In this paper, after the remote sensing image is preprocessed by TM image processing, atmospheric correction, correction of solar altitude angle of reflectivity, data bad value, and noise removal, a dynamic monitoring model of natural resources is established by using the stepwise regression analysis method based on the least square estimation. The dynamic changes of forest resources and water resources in the Libo area are tested. As an example, the effectiveness of this method is verified. The results show that this method can realize the dynamic monitoring of natural resources in the Libo scenic spot, and the monitoring accuracy is high, which can provide references for the application of related industries.

