


 English (pdf)
 Article in xml format
 Article references
 Send this article by e-mail
 Cited by SciELO
  Cited by Google
  Similars in
SciELO
Similars in
SciELO  Similars in Google
 Permalink
Introduction
Climate change is considered the most significant threat of the 21st century, with implications for natural, environmental, social, and economic spheres (UN Environment, 2019; Mora et al., 2018). The adverse effects of climate change and variability can affect human health, ecosystems, water availability, infrastructure, agriculture, and other socio-economic sectors (IPCC, 2018; Mora et al., 2018). Climate change represents an additional variable that, together with the growing demand for resources, changes in land use, and pollution, triggers environmental disturbances in an interconnected nature. However, Mateos et al. (2016) reported that climate change would not affect everyone in the same way since developing countries and the most vulnerable social groups will be the most affected. Similarly, Jessoe et al. (2018) indicated that the costs of climate change would be more acute in developing countries, such as Mesoamerica and the Caribbean, due to the inability for response and adaptation by governments and communities (González et al., 2017; Muñoz-Jiménez et al., 2019). Water resource management is predicted to become one of the most significant challenges of climate change worldwide (Magaña et al., 2018), and the availability of water resources is a primary social concern, particularly for underdeveloped countries that already have limited access to clean water (Martínez-Austria & Patiño-Gómez, 2012).
Water availability is variable due to precipitation, droughts, and aquifer depletion, which occur at different scales in urban and rural areas (Duran-Encalada et al., 2017). Climate change is expected to cause temperature increases and alterations in precipitation patterns, which will impact water resources (Kristvik et al., 2019) through more frequent and prolonged droughts, more severe floods, and reduced water quality (Ortiz-Partida et al., 2020). Several studies have reported the impacts of climate change on the hydrologic cycle and water resource availability, e.g., Duran-Encalada et al. (2017), Pokhrel et al. (2018), Kristvik et al. (2019), and Koutroulis et al. (2019). According to Koutroulis et al. (2019), the quantification of climate change impacts is challenging due to the complex interdependence between the associated physical and socio-economic systems. Consequently, hydrologic models and global climate models (GCM) have been developed to estimate and analyze climate change impacts on water resources. However, despite the level of detail of the GCM, it is considering that these models have limitations due to the coarse spatial and temporal resolution of the data, requiring further downscaling to be applied in local-scale studies. The Representative Concentration Pathways (RCPs) are the most modern group of currently used scenarios and include four scenarios: RCP 2.6, RCP 4.5, RCP 6.0, and RCP 8.5 (Kristvik et al., 2019).
The Intergovernmental Panel on Climate Change (IPCC) in Audefroy (2015) refers to the following changes at the regional level: "1) Warm extremes, heat waves, and heavy precipitation are likely to continue to be more frequent; 2) Tropical cyclones are likely to become more intense; there is less confidence in projections of an overall decrease in the number of tropical cyclones; and 3) Precipitation is likely to increase at high latitudes, while it is likely to decrease in most subtropical land regions, continuing the patterns observed in recent trends" (Audefroy 2015, p. 251).
In Mexico, it is expected that these changes will be manifested of the way different. In this sense, a decrease in precipitation in northern and central zones is expected, and a precipitation increase in the southeast (Audefroy, 2015). According to the Mexican National Water Commission (CONAGUA), the southeast has the most significant rainfall records, runoff, and spatiotemporal water availability, while the north-center has the largest population most economic dynamism (CONAGUA, 2018). Thus, given the IPCC's climate change projections in addition to the climatic contrast in Mexico, pressure on existing water resources is expected to become more acute.
Mexico is considered one of the countries with the highest vulnerability to the adverse effects of climate change, with 15% of the national territory, 68% of the population, and 71% of the GDP highly exposed to the risks of climate change (Molina et al., 2017). According to Ortiz-Partida et al. (2020), the decrease in water availability associated with climate change in Mexico puts the human right to water and water for industry and agriculture at risk. Climate variability in the country is related to natural events, such as floods, droughts, or tropical storms, that cause adverse effects on agriculture, hydroelectricity, water availability, and other socio-economic losses throughout the territory (Landa et al., 2008; Magaña et al., 2001).
In particular, climatic events have been reported in different southeast Mexico areas since this region has historically registered a high vulnerability to extreme hydrometeorological events. Climatic events associated with climate change and variability, such as floods, represent one of the relevant problems in southern Mexico's transboundary basins (García and Kauffer, 2011; Kauffer, 2006; Arreguín-Cortés et al., 2014). Gama et al. (2010) and Valdés-Manzanilla (2016, 2018) discuss the extent of the adverse effects of flooding events in the states of Tabasco, Chiapas, and Veracruz, while Audefroy (2015) addresses the potential effects of climate change in the states of Oaxaca, Tabasco, and Yucatan. The institutional and socio-economic response capacity to these phenomena is limited in the region (CAFS, 2018); this area's challenges are shared to a greater or lesser extent by all south-southeast Mexico states.
The South-Southeast Region (SSR), comprising the states of Campeche, Chiapas, Guerrero, Oaxaca, Puebla, Quintana Roo, Tabasco, Veracruz, and Yucatan, is characterized by abundant natural resources and marked socioeconomic contrast. Natural disasters due to regional characteristics and the effects of climate change are noteworthy (DOF, 2014). However, climate data in Mexico, particularly in tropical areas, are scarce, and their quantitative and qualitative availability has resulted in very few studies on the trends of climate change in the country (Duncan-Golicher & Morales, 2005; Montero-Martínez et al., 2018). The lack of data represents a challenge for research since rainfall is key to understanding climate.
Precipitation in the SSR during summer is influenced by tropical cyclones, eastern waves, and the Intertropical Convergence Zone, while in winter, cold fronts are the central systems that produce these precipitation events (Andrade-Velázquez, 2017). Similarly, the regional climate modulators are the El Niño-Southern Oscillation (ENSO), the Pacific Decadal Oscillation (PDO), and the Atlantic Multidecadal Oscillation (AMO) (Álvarez-Olguin & Escalante-Sandoval, 2016). Besides, these phenomena have effects on a global scale (Meng et al., 2019). Méndez-González et al. (2011) reported the influence of ENSO and AMO for Mexico, while Méndez & Magaña (2010) reported the wet-dry dipole observed in Mexico due to the combination of the AMO and PDO oscillations. Both studies showed that during the warm phase of ENSO and PDO, dry periods were observed in southeast Mexico, and wet periods occurred during the cold phase. The reverse is right in the south, so the cold phase is responsible for humidity, while the warm phase is responsible for dryness.
The Standardized Precipitation Index (SPI) can quantify wet and dry periods (Santana et al., 2017) and characterize it. The SPI was developed by McKee et al. (1993) to classify observed rainfall as a standardized output relative to a rainfall probability distribution function. It was first adopted by Guttman (1999), and since then, the SPI has been widely used due to the practicality of the method, the small amount of data it requires, and the recognition of the World Meteorological Organization (WMO) (Sisto et al., 2016). The SPI is considered an effective means for the detection of exceptionally dry or wet periods in historical precipitation data (Stagge et al., 2017), allowing for the comparison of precipitation behavior over different regions and time scales, from seasonal to annual and multiannual time frames (Esquivel-Arriaga et al., 2019). However, the SPI does not take into account precipitation intensity and its potential impacts on runoff, water flow, and availability.
Precipitation is recognized as a crucial element for water balance over space and time (Mujere & Eslamian, 2014). Therefore, the analysis and understanding of precipitation patterns at the basin level is necessary for adequate water resources management. According to Bates et al. (2008), observation records and climate projections provide clear evidence of the vulnerability of water resources and the potential impacts of climate change, which have implications for human societies and ecosystems.
Thus, the objective of this manuscript is to explore and analyze current and future precipitation patterns in the SSR of Mexico by using the SPI for three climate change scenarios, RCP 4.5, RCP 6.0, and RCP 8.5, from 1960-2016 (historical), 2015-2039 (near future), and 2075-2099 (far future). This study aims to identify the areas that are most prone to changes in current and future rainfall patterns and seeks to contribute to the improvement of water resource management plans for adaptation and mitigation of the effects of climate change on water availability.
Study area
The SSR of Mexico covers an area of 501,448.17 km2 and is made up of the states of Campeche, Chiapas, Guerrero, Oaxaca, Puebla Quintana Roo, Tabasco, Veracruz, and Yucatan (Figure 1). This region comprises 25.6% of Mexican territory and is part of the trinational border 1,149 km long with Guatemala and Belize. Administratively, the SSR has 1,372 municipalities and cities such as Cancun, Ciudad de Carmen, Merida, Puebla, Villahermosa, and Xalapa, among others (DOF, 2014).
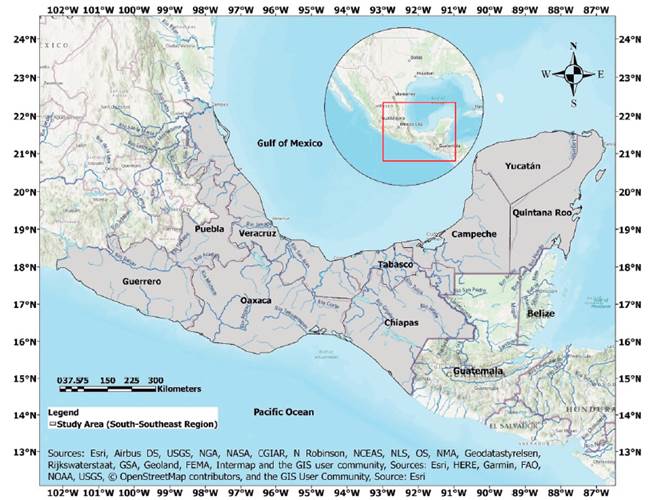
Source. Prepared in ArcGIS Pro with spatial information from the National Institute of Statistics and Geography (INEGI) and ArcGIS Pro: Map services.
Figure 1 Location of the study area and water wealth.
The region is characterized by complex physiography, a predominantly warm climate, and invaluable natural and hydric wealth. The SSR physiography includes plains such as the Yucatan Peninsula and the coastal plains of the Northern and Southern Gulf and mountainous areas formed by part of the Sierra Madre del Sur, Sierra de Chiapas, the Central American Cordillera. This region also has coastlines on the Pacific, Gulf, and Caribbean Sea that reach more than 4,217 km (DOF, 2014). The region is also part of the Mesoamerican Biological Corridor, considered one of the world's five most biodiverse regions. The SSR has a historical average rainfall of 2,4012,800 mm/year, although, in some areas, 4,000 mm/year have been recorded. Consequently, 19 of the 50 main rivers in the country coexist in this region where the most considerable runoff of 37% of the national total is recorded, with the largest being the Grijalva, Usumacinta, Papaloapan, Panuco, and Coatzacoalcos rivers (Figure 1) (DOF, 2014).
In socio-economic terms, the SSR has over 31 million inhabitants, 28% of the national total, who are mainly engaged in agriculture, livestock, and fishing, although the energy sector and tourism are also valuable assets in this region (DOF, 2014). Economic activities comprise an estimated 18% of the national GDP. Nevertheless, the region is significantly underdeveloped with high poverty rates, unlike the central-northern region.
Materials and Methods
This study's precipitation data is high-spatial-resolution data (0.5° x 0.5°) from the monthly gridded Climatic Research Unit Time Series (version 4.01). The high-resolution gridded data includes month-by-month variations in climate during the period between Jan. 1901-Dec. 2016 (University of East Anglia Climatic Research Unit et al., 2017). The advantage of the CRU data over the observation data is to provide information overall study time records with high-quality control in the regions with a lack of data. Spatial interpolation from weather station observations is used to achieve spatially complete data, with the number of nearby stations used as an indicator of data reliability (Harris et al., 2014). CRU data had been improved for climate change analyses (IPCC, 2013).
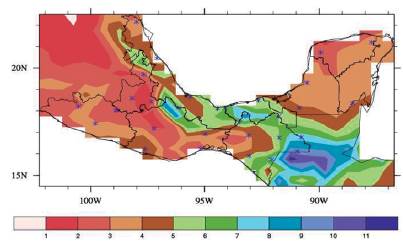
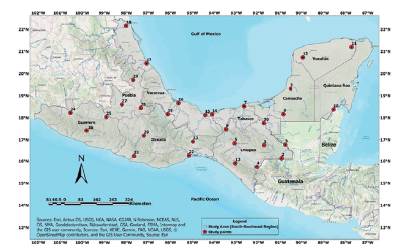
The primary study points were selected based on two criteria: a) historical precipitation patterns from 1960-2016, where the climatology of the area registered the most significant change (Figure 2), and b) the proximity to bodies ofwater, as shown in Figure 3 and Table 1, respectively. The precipitation patterns are congruent with previous studies (Alvarez-Olguin & Escalante-Sandoval, 2016) that showed higher precipitation for the southeast region than the entire southern region. Méndez-González et al. (2008) described the precipitation regimes in the study area in three regions, the Yucatan Peninsula, the South Pacific, and the Southeast - Gulf of Mexico, where annual precipitation in each region is 1,055 mm/year, 1,007 mm/year, and 1,780 mm/year, respectively. 70% of the country's precipitation is recorded from May to October and is dependent on latitude, proximity to the oceans, and ENSO phenomena. Data for the selected points were extracted with bilinear interpolation to cover the SSR's main and tributary rivers.
Note. * Key study points.
Figure 2 Precipitation climatology of the study area from 1960-2016. The units are in mm/day.
Source. Prepared in ArcGIS Pro with spatial information from the National Institute of Statistics and Geography (INEGI) and ArcGIS Pro: Map services.
Figure 3 Location of study points in the South-Southeast region of Mexico (ArcGIS Pro: Map services).
To understand the precipitation patterns in the SSR, the SPI was used with a 12-month time window from 1960-2016 to determine the behavior of wet and dry periods annually; this time-window is in agree with the main climate driver timely. The same method was also used to obtain the projected SPI for 2015-2039 and 2075-2099 under RCP 4.5, RCP 6.0, and RCP 8.5 scenarios. The Reliability Ensemble Averaging (REA) method (Giorgi & Mearns, 2002) was used for scale reduction in Mexico (Cavazos et al., 2013), apply to the models shown in Table 2. It should be noted that the first period for the projection contained runs 2015, given that 2015-2039 is also part of the near future due to the original scenarios data.
Table 2 List of the 15 models from the Coupled Model Intercomparison Project (CMIP5)
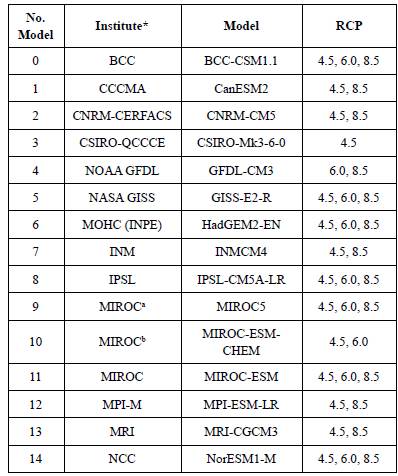
Source. Elaboration based on Cavazos et al. (2013)
Note. *BBC (Beijing Climate Center, China Meteorological Administration); CCCMA (Canadian Centre for Climate Modelling and Analysis); CNRM-CERFACS (Centre National de Recherches Meteorologiques/Centre Europeen de Recherche et Formation Avancees en Calcul Scientifique); CSIRO-QCCCE (Commonwealth Scientific and Industrial Research Organisation in collaboration with the Queensland Climate Change Centre of Excellence); NOAA GFDL (Geophysical Fluid Dynamics Laboratory); NASA GISS (NASA Goddard Institute for Space Studies); MOHC (INPE) (Met Office Hadley Centre (additional HadGEM2-ES realizations contributed by Instituto Nacional de Pesquisas Espaciais)); INM (Institute for Numerical Mathematics); IPSL (Institut Pierre-Simon Laplace); MIROCa (Atmosphere and Ocean Research Institute (The University of Tokyo), National Institute for Environmental Studies, and Japan Agency for Marine-Earth Science and Technology); MIROCb (Japan Agency for Marine-Earth Science and Technology, Atmosphere and Ocean Research Institute (The University of Tokyo), and National Institute for Environmental Studies); MPI-M (Max Planck Institute for Meteorology); MRI (Meteorological Research Institute); NCC (Norwegian Climate Centre).
To determine the precipitation patterns in the area, the SPI was used with values shown in Table 3 and their classification, according to Mckee et al. (1993) and OMM (2012). The SPI was calculated with a Pearson distribution type III (Guttman, 1999) equation, as seen in (1) for 1960-2016, 2015-2039, and 2075-2099:
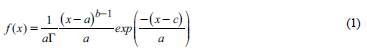
where a > 0, b > 0, corresponding to scale and shape parameters, 0 < c < x location parameter, and r is the function gamma.
Table 3 SPI values
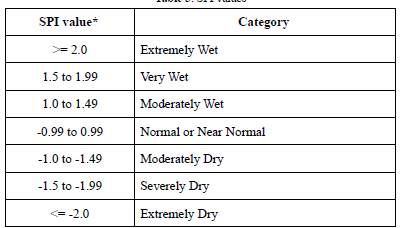
Source. OMM (2012)
Note. *SPI values < -1 indicate a condition of drought. The more negative the value is, the more severe the drought condition. SPI values > 1 indicate wetter conditions compared to climatology.
According to the National Drought Mitigation Center (University of Nebraska-Lincoln, United States), the SPI-12 reflects 12-month precipitation patterns. Longer SPIs tend toward zero unless there is a specific trend. SPIs of these time scales are probably tied to streamflow, reservoir levels, and even groundwater levels at the longer time scales (NDMC, 2020). SPI-12 values more significant than +1 and less than -1 for the three-time horizons were used for further analysis; to compare the results from SPI-12 1960-2016 with those of the SPI-12 projected by the climate change scenarios in the future periods (2015-2039 and 2075-2099). The percentage of SPI-12 values greater than +1 and less than -1 for the historical, near, and far futures were obtained over the data records, as the history as both futures. This comparison provides the amount the SPI-12 values for the dry and wet events in the data records to determine such events amount for the historical and both futures. A weighted comparison was then made according to the number of years in the future periods and the historical record. Given that there are 57 years of historical records and 25 years of projections with the RCPs for each future projection, we used a correction factor for that percentage calculated as a = 57/25 and proceeded to calculate the difference in percentages of wet and dry periods as
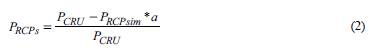
Where PCRU is the percentage derived from the CRU record, PRCPsim percentage corresponding to the RCP scenarios (RCP 4.5, RCP 6.0, and RCP 8.5), and PRCPs is the weighted percentage.
Results and discussion
SPI-12 historical results from 1960-2016
Figures 4 and 5 show the SPI-12 for the 30 study points in the SSR of Mexico. The Grijalva and Usumacinta basins comprising mainly the states of Chiapas and Tabasco, had dry events for two years: in 1965 for the Grijalva basin and 1990 Usumacinta basin. The Grijalva region is classified as warm sub-humid, while the Usumacinta region is classified as warm humid (INEGI, 2018) and is where the highest rainfall is recorded (Álvarez-Olguín & Escalante-Sandoval, 2016). In both basins, wet periods were observed after the year 2000. According to the WMO, these periods are classified as extremely dry and very wet, respectively. However, extremely wet periods were observed after the year 2010 for most of the SSR, indicating which there has been more precipitation in recent years, particularly in the Grijalva-Usumacinta basin and in the Yucatan.
Other studies in the area have reported opposite trends in rainfall events within the same state (Mendoza-Uribe & Vázquez-Zavaleta, 2017; González-Villela & Montero-Martínez, 2018; Márdero et al., 2012). In the southeast region, Montero-Martínez et al. (2018) reported that there was a positive trend in the lower part of the Usumacinta basin. Likewise, Santana et al. (2017) showed that in the same region of the Usumacinta, more wet events occurred from 1985-2008, but from 1961-1984, most of the extremely wet and dry events were found to be extremely dry. Méndez-González et al. (2008) reported that trends tended to be negative from 1920-2004 in the Gulf of Mexico and that precipitation increased in arid areas due to the influence of ENSO. Méndez & Magaña (2010) reported that the droughts registered from 1960-2000 correspond to the combination of positive phase PDO and weak signals of AMO. The records from the present study show congruence with the results of Montero-Martínez et al. (2018), where the trends in the Gulf of Mexico and Grijalva-Usumacinta region are positive after 2000. However, this is due to the adjustment of the trend after the total period of 1920-2004 in the study by Méndez-González et al. (2008). Andrade-Velázquez & Medrano-Pérez (2020) reported that there was an inverse relationship between ENSO-PDO and precipitation in southeast Mexico during 1960-2016.
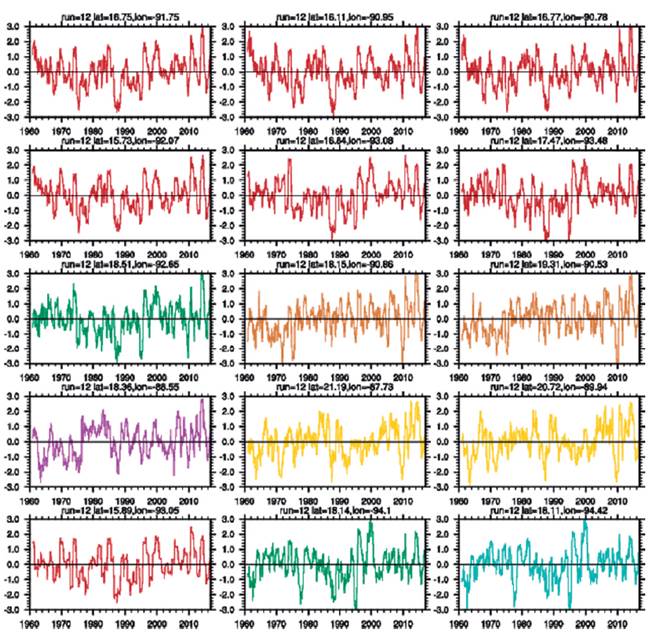
Figure 4 SPI-12 from 1960-2016 for study points 1-15 (see Figure 3) of the South-Southeast region of Mexico. Study points 1, 2, 3, 4, 5, 6 and 13 are brown; 7 and 14 are green; 8 and 9 are brown; 10 is purple; 11 and 12 are yellow, and 15 is turquoise.
In the Gulf of Mexico, particularly the sites located in Veracruz, more considerable SPI-12 variability and extremely dry periods were observed in the southern zone of the state during 1983 and 1993, while the central zone only had an extremely dry period in 1983. However, in 1970 and 1982, very wet periods were recorded in the southern zone. Meanwhile, in the central and northern zones, very wet periods were not observed until after 2010 when they also occurred in the Grijalva and Usumacinta basins. Similarly, Álvarez-Olguín & Escalante-Sandoval (2016) reported an increasing trend in northern Veracruz from 1950-2013.
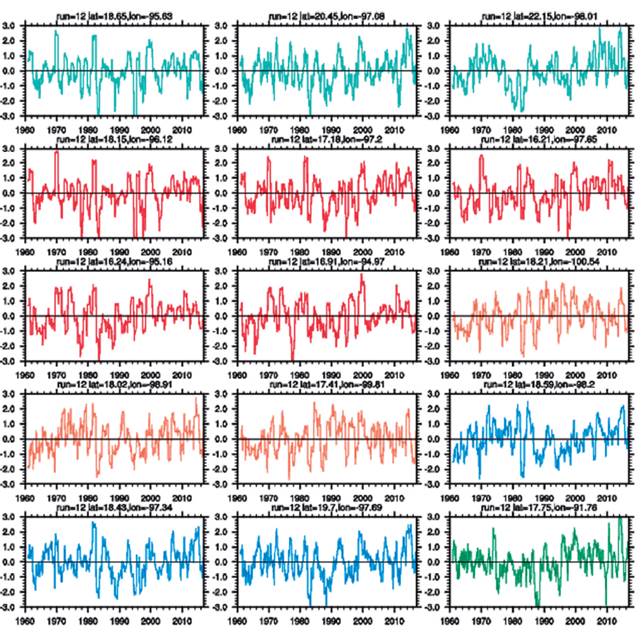
Figure 5 SPI-12 from 1960-2016 for study points 16-30 (see Figure 3) of the South-Southeast region of Mexico. Study points 16, 17, and 18 are turquoise; 19, 20, 21, 22, and 23 are red; 24, 25, and 26 are pink; 27, 28, and 29 are blue; and 30 is green.
In the South Pacific (Oaxaca and Guerrero) and the center of the country (Puebla), the SPI-12 was more variable with the years classified mainly as severely dry and wet. These periods were recorded throughout the entire study time frame (1960-2016). However, in Puebla, there were also SPI-12 values classified as extremely dry between 1980 and 1990. Historically, the South Pacific region was affected by dry periods before 2000, with dry and wet periods becoming more recurrent after that. Álvarez-Olguín & Escalante-Sandoval (2016) and Méndez-González et al. (2008) reported that in the South Pacific, there is a tendency for a decrease in precipitation in similar time record (<2013 and <2004 respectively) associated to the ENSO and PDO. In the present study, the SPI-12 data had mostly negative values indicating a precipitation deficit. This region is classified as a temperate subhumid (INEGI, 2018). Giddings et al. (2005) reported that the South Pacific zone and the Gulf of Mexico tend to have similar SPI-12 behavior, while Grijalva-Usumacinta and the Yucatan Peninsula fall into a different group based on the same SPI-12. In the present study, it was observed that the South Pacific and the Gulf of Mexico do not necessarily have similar characteristics and precipitation patterns. From 1960-2000, the South Pacific region and part of Veracruz (Gulf of Mexico) had few signs of drought in the presence of positive PDO and weak AMO. Mendoza et al. (2006) reported that droughts in this zone that occurred before the present study period had been influenced by the positive phases of ENSO and PDO, while the Yucatan Peninsula had droughts in the presence of the cold phases of AMO.
SPI-12 in RCP 4.5, RCP 6.0, and RCP 8.5 scenarios
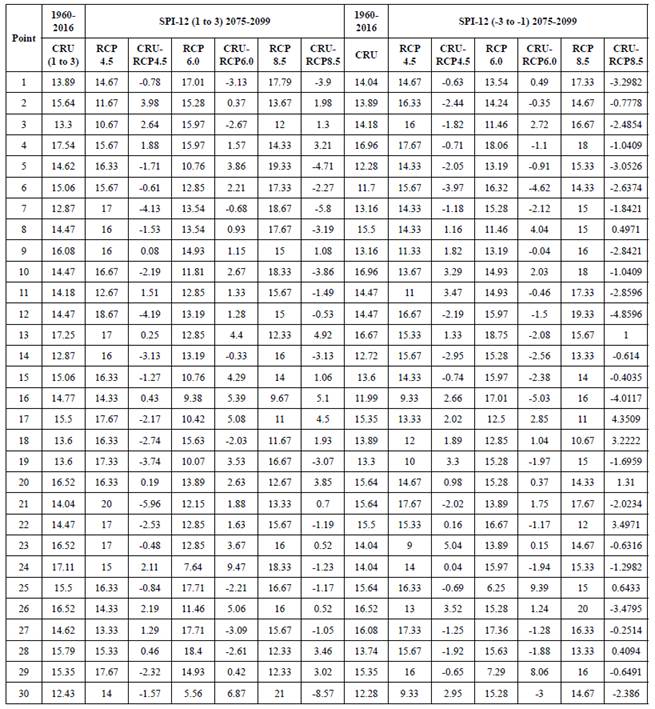
The SPI-12 precipitation results of the climate change projections described by the RCP 4.5, RCP 6.0, and RCP 8.5 scenarios for 2015-2039 were also calculated. Table 4 shows the percentage of wet and dry periods projected for that time frame. A comparison between the Climatic Research Unit (CRU) data from 1960-2016 to the projections from the three RCP scenarios was also made. No difference more significant than 10% was observed for 2015-2039, which suggests that future changes under these climate change projections would not be more significant than historical, i.e., the amount future dry and wet events could be similar to the amount of the historical events. This same exercise was carried out for 2075-2099, being found the same conditions in the differences between the CRU data and the RCPs. However, it was observed in the RCP 8.5 scenario that the highest increases in dry periods for 2075-2099 occurred in most study points, as shown in Table 5.
Table 4 Percentage of SPI-12 values indicating wet (1 to 3) and dry (-3 to -1) periods for each study point corresponding to observations from 1960-2016 and RCP scenarios from 2015-2039.
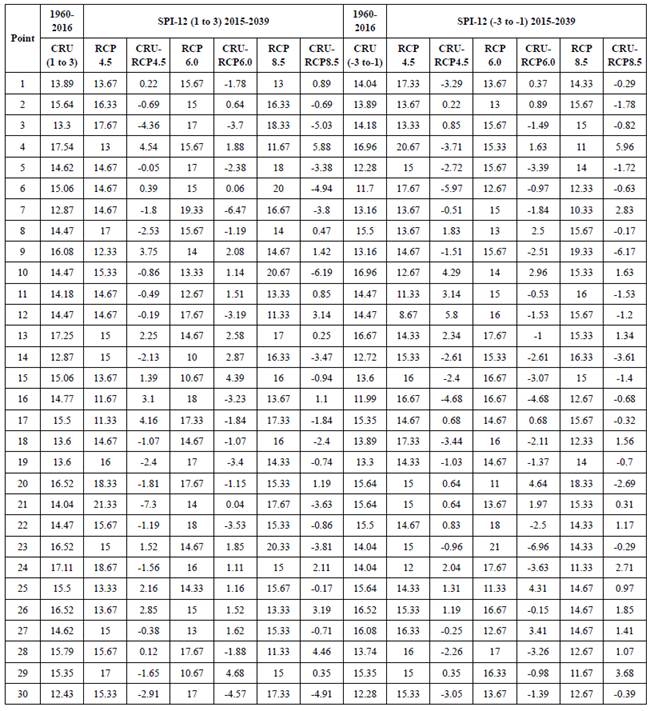
Table 5 Percentage of SPI-12 values indicating wet (1 to 3) and dry (-3 to -1) periods for each study point corresponding to observations from 1960-2016 and RCP scenarios from 2075-2099.
In order to compare 57 years of historical records with 25 years of RCP projections for each future time frame, a correction factor was used for the percentage obtained for the wet (SPI-12 values 1 to 3) and dry periods (SPI-12 values -3 to -1) during 2015-2039 and 2075-2099.
Table 6 shows the correction factor results. These results allow us to determine where there will be significant (>10%) differences at each study point for future time frames over the historical period. All three scenarios for the two future periods indicate that both wet and dry events at all study points will increase concerning the historical period.
Table 6 Percentage difference of SPI-12 values indicating wet (1 to 3) and dry periods (-3 to -1) for each study point corresponding to observations from 1960-2016 and the three RCP scenarios.
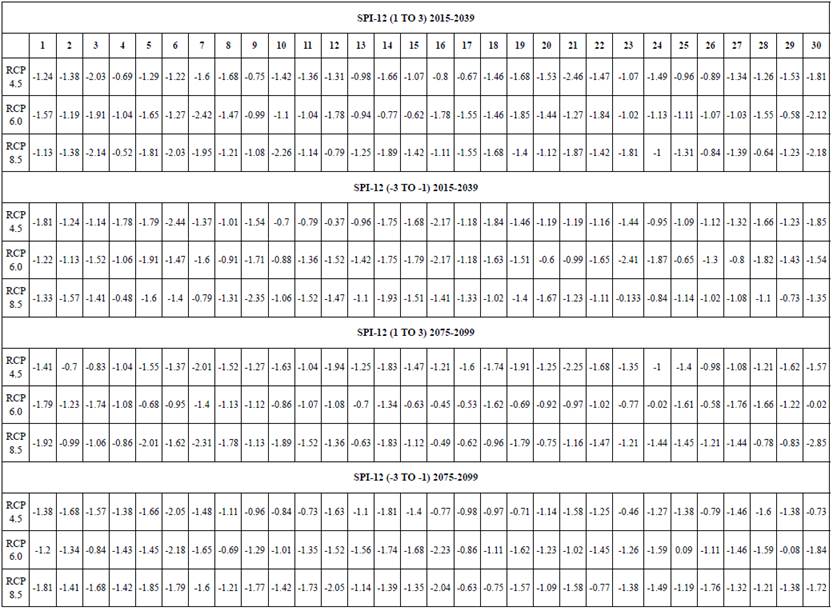
During 2015-2039, wet periods were detected more than 1.5 times in frequency for all three scenarios at study points 3, 7, and 30. However, these study points do not show the same behavior for dry events. Likewise, study points 5, 14, and 17 showed the same increase in wet events, but only for two RCP scenarios. These 6 points are in Chiapas, Tabasco, and Veracruz. Additionally, other study points with similar dry event increments in all three scenarios are 15, located in Veracruz, and 9, located in Campeche. Study points 16 (Veracruz), 18 (Veracruz), and 28 (Puebla) demonstrated an increase in dry events in two of the three scenarios. The study points that had 1.5 times more frequency in only one scenario for wet events were 6, 8, 10, 12, 16, 18, 20, 21, 22, 23, and 28, located in Chiapas, Yucatan Peninsula, Veracruz, South Pacific, and Puebla, and for dry events, the study points 1, 2, 3, 4, 6, 7, 11, 12, 19, 20, 22, 23, and 24, located in Chiapas, Yucatan Peninsula, and South Pacific. According to IPCC reports, all three scenarios demonstrating similar percentages of wet or dry events indicate the highest probability that the event will occur. For two of the three scenarios, there is a medium probability of occurrence, and if only one scenario projects this behavior, there is a low probability that the event will occur.
For 2075-2099, no single point was 1.5 times more likely to occur than the historical record in all three scenarios for wet events. In contrast, study points 6, 12, and 14, located in Chiapas, Yucatan, and Tabasco, respectively, are 1.5 times more likely to have a dry event. The study points that showed this behavior in two scenarios for wet events were 1 (Chiapas), 7 (Tabasco), 10 (Quintana Roo), 14 (Tabasco), 18 (Veracruz), 19 (Oaxaca), and 30 (Tabasco), while study points 3, 5, 7, 16, 19, 21, 28, and 30, located in Chiapas, Tabasco, Veracruz, Oaxaca, and Puebla exhibited this behavior for dry events. The study points that demonstrated this occurrence is only one scenario for wet events are 3, 5, 6, 11, 12, 17, 22, 25, 27, 28, and 29. A few ofthese points were located in Chiapas, Yucatan, Veracruz, and South Pacific, but the majority of these points were located in Puebla. The occurrence of dry events in only one scenario was seen in the study points 1, 2, 9, 11, 13, 15, 24, and 26, located in Chiapas, Campeche, Veracruz, and Guerrero.
The study points that show increases in the percentage of dry and wet events for any climate change scenario projection, with the three scenarios are those in the Grijalva and Usumacinta basins in 2015-2039. This study suggests that it is highly likely that wet (SPI-12: 1 to 3) and dry (SPI-12: -1 to -3) events will continue to occur in this region and occur to a greater extent. Likewise, the study points in the states of Veracruz and Puebla have a moderate probability of this behavior. The rest of the study area has a low probability of dry or wet events occurring at or above 1.5 times the historical rate. By 20752099, the Grijalva and Usumacinta basins, in addition to the Yucatan, have a high probability of dry events under climate change. Grijalva and Usumacinta, Veracruz, Oaxaca, Quintana Roo, and Puebla were found to have a moderate probability of increased dry and wet events. The rest of the study area had only a low probability of wet and dry events occurring 1.5 times more frequently.
Spatial distribution of SPI-12
To determine the spatial behavior of the SPI-12 during the historical period (1960-2016) and the climate change projections using scenarios RCP 4.5, RCP 6.0, and RCP 8.5 from 2015-2039 and 2075-2099 in the SSR, temporal-latitudinal and temporal-longitudinal graphs were made (Figure 6 and 7). It was observed that historically, the dry periods (SPI-12 < -1) predominate for all latitudes from 1960 to 1990, except in 1975 and 1982, where they were only predominant for medium and high latitudes of the study area. After the 1990s, the events become wet (SPI-12 > 1) at latitudes. Similar behavior was seen in longitude charts for the western region of the study area, while the eastern region had more considerable wet periods or little change, except during 1960-1975. These observations exemplify the behavior of the study zone, where the states of Veracruz, Tabasco, Chiapas, and the Yucatan Peninsula are characterized as mostly wet.
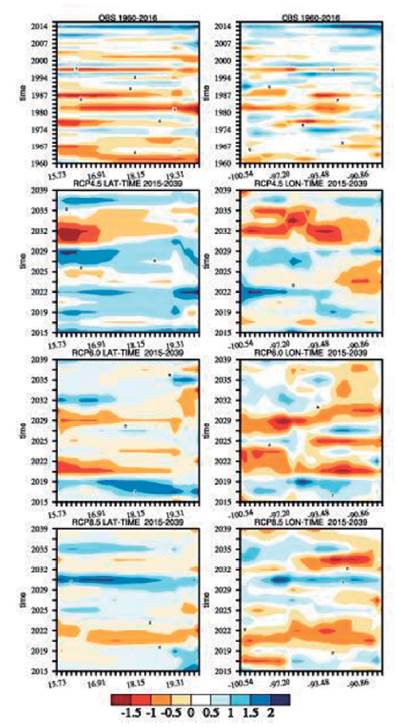
Figure 6 Spatio-temporal plots of historical records (Climatic Research Unit (CRU): 1960-2016) and projections of RCP 4.5, RCP 6.0, and RCP 8.5 scenarios for SPI-12 during the period 2015-2039. The left column represents Latitude vs. Time and the right column is Longitude vs. Time.
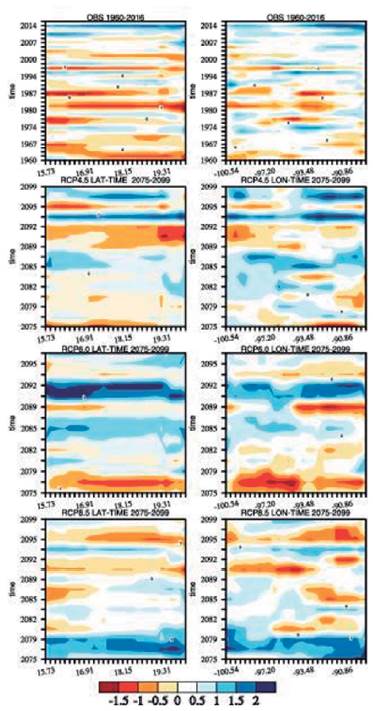
Figure 7 Spatio-temporal plots of historical records (Climatic Research Unit (CRU): 1960-2016) and projections of RCP 4.5, RCP 6.0, and RCP 8.5 scenarios for SPI-12 during the period 2075-2099. The left column represents Latitude vs. Time and the right column is Longitude vs. Time.
In general, the study area shows both latitudinal and longitudinal same precipitation patterns from the 1960s to the 1980s. According to Florescano-Mayet et al. (1980), several severe droughts were recorded in Mexico from 1930 to 1977 in the years 1935, 1957, 1960, 1962, 1969, and 1977. These results show that the risk of drought in the south-southeast zone progresses from very low to medium probability, with medium probability occurring in the western regions including Puebla, part of Veracruz, and the Yucatan Peninsula, low probabilities in Oaxaca, Chiapas, Campeche, and part of Veracruz, and very low probabilities in Tabasco and northern Chiapas.
The RCP 4.5 - RCP 6.0 projections for the 2015-2039-time frame are like 2015 and 2016, which also appear in the historical data. The RCP 8.5 projection remains unchanged over latitude; however, RCP 4.5 and RCP 8.5 show similarity with the historical period over longitude, while RCP 6.0 does not. However, this does not condition the choice of a scenario with better performance. The scenario that shows greater latitudinal and longitudinal wet periods is RCP 4.5. This scenario has the lowest CO2 concentrations of the three scenarios and will produce the least warming (IPCC, 2013). Before 2030, wet periods will occur from south to north in the study zone and west to east, except for the most eastern region from 2022-2027, where the Yucatan Peninsula is located. In contrast, dry periods are predicted in the SSR after 2030.
The drier periods, mainly in the eastern region of the study area, do not correspond to the most extreme scenario, RCP 8.5, for 2015-2039. RCP 6.0 has intermediate CO2 concentrations as a radioactive forcer (IPCC, 2013), and it follows an evolutionary behavior of these factors together to RCP 8.5 until 2020. Subsequently, RCP 6.0 scenario slows down its increase in both scenario characterization factors, curving for the period 2020-2039, and remains constant after this period. Besides, RCP 8.5 maintains its behavior without many latitudinal changes, while longitudinally, dry periods occur mainly before 2020 for the western and eastern parts of the study area (South Pacific). After 2032, the eastern part of the study area becomes dry again (Southeast Region).
Projections from 2015-2039 compared to projections from 2075-2099 show longer dry periods longitudinally, from west to east. During 2075-2099, RCP 4.5 projected wet periods until 2089, while the eastern zone was dry from 2079-2082. RCP 6.0 showed severely dry periods from west to east during 2075-2077, while RCP 8.5 was characterized by wet periods during this time frame. The results are comparable to Wehner et al. (2011), who reported a decrease in precipitation in 2070 throughout the country under scenario A1B (IPCC, 2000). This scenario has CO2eq concentrations of 720 ppm by the end of the century, comparable to RCP 6.0. For longitudes from -92° to -87°, the RCP 8.5 and RCP 6.0 scenarios demonstrated dry periods; however, they are more intense under RCP 8.5. By the end of the century, RCP 8.5 had more droughts followed by RCP 6.0 and RCP 4.5, while the latter showed the reverse behavior. Latitudinally, 2039-2075 had less intense wet periods than in 2015-2039 under the RCP 4.5 scenario. In contrast, RCP 6.0 projected more intense wet periods, mainly during 2092-2095. RCP 8.5 demonstrated increases in wet and dry periods, with wet periods occurring before 2080 and dry periods occurring from north to south in 2089 in the study area.
In summary, the projections for 2015-2039 showed dry periods occurring mostly in low- and mid-latitudes of the study area at eastern longitudes in all three scenarios. RCP 6.0 is the only scenario demonstrating these periods at western longitudes (South Pacific and Veracruz). By 2075-2099, dry periods were only projected at western longitudes by RCP 4.5. In contrast, RCP 6.0 showed dry periods at low latitudes and longitudes in the eastern study area (Yucatan Peninsula). RCP 8.5 projected dry periods in nearly the entire study area, except from 2075 to 2079, where the periods were wet. RCP 4.5 was the wettest scenario for the study area, while RCP 8.5 had more significant dry periods in both future time frames. RCP 6.0 was drier for 2015-2039 and wetter for 2075-2099. In Tables 3 and 4, we show that the percentage of dry and wet periods was obtained for the local point in future time. Maloney et al. (2014) reported decreasing precipitation in the summer season for Mexico and Central America under RCP projections. Historically, there has been a reduction in precipitation during the summer associated with the mid-summer drought (Magaña, 1999).
The results demonstrate that historically, the SSR had higher rainfall in the southeast (Grijalva-Usumacinta and Yucatan Peninsula) compared to the south (Pacific and Gulf of Mexico coasts). The SPI-12 provides information on wet and dry events in the region and information on torrential flows, reservoir levels, and groundwater levels over larger time scales. By 1980, the southern states of Puebla, Oaxaca, and Guerrero (South Pacific and Puebla) were experiencing extremely dry events. Consequently, most of the 30 study points selected in the SSR had SPI-12 values £ -2 from 1987-1988, which correspond to severe and extremely dry events. Dry events are associated with El Niño, which causes drought in the region (Méndez-González et al., 2011; Méndez-González et al., 2008). In 2009, the southeast had extremely dry events, while the southern zone had humid events. This dipole was previously reported in Méndez & Magaña (2010). The inverse effect was observed in 2010, where the presence of La Niña produced increased precipitation in the southeast.
The SPI-12 precipitation results from climate change scenarios in the SSR project; that there will be an increase in dry events. The climate change scenarios RCP 4.5, RCP 6.0, and RCP 8.5 indicate that dry events will be more frequent than wet events compared to what has historically occurred. Similar results were reported by Prieto-González et al. (2011) for the country's central zone, where the highest SPI-12 values were negative for the future.
The projection of dry and wet events in the climate change scenarios cannot entirely be attributed to ENSO since there is no consensus in the literature on future changes of ENSO and other oscillations (Yen & Kitman, 2007; Coelho & Goddard, 2009; Maloney et al., 2014; Chen et al., 2017). There is a significant increase in sea surface temperature under RCP 8.5 (Maloney et al., 2014), whose effects are expected to impact the SSR's regional climate. The RCP 6.0 scenario demonstrated similar patterns for future time frames than the historical data, while RCP 4.5 only showed it for 2075-2099. RCP 8.5 had the least similarity to historical patterns.
However, climate change is not the only environmental strain that will impact water resources in this region. Other factors, such as land cover/land-use changes, could affect the hydrologic cycle and the climate system (Oki et al., 2013). According to Peralta-Carreta et al. (2019), the loss oftree cover in tropical areas represents one of the most catastrophic events of the present, with effects on water and climate systems globally. The SSR is no exception. Historically, the Mexican southeast has had extreme environmental deterioration, including deforestation and changes in land cover and use (Tudela, 1990; 2004; Cairns et al., 2000; Romo Lopez, 2008), both at the basin and state level, due to multiple anthropic stressors (Gallardo-Cruz et al., 2019; Peralta-Carreta et al., 2019; DOF, 2014; Kolb & Galicia-Sarmiento, 2011). Consequently, the adverse effects and disturbances associated with global climate change could include potential changes to the hydrologic cycle at local, regional, and global scales.
Thus, it is crucial to study and understand climate change issues, and their possible effects on the SSR's hydro-climatological dynamics, particularly since just over a third of the country's runoff occurs in the SSR. Due to the risks of climate change for natural and human systems (Ortiz-Partida et al., 2020; UN Environment, 2019; Mora et al., 2018), it is essential to conduct research that promotes joint action among scientists, decision-makers, and social sectors to strengthen the response capacity to potentially adverse effects.
Conclusion
The SPI-12 provides information on wet and dry events that have occurred in a region. This study presented the expected changes in precipitation in the SSR of Mexico under three climate change scenarios. It was observed that shortly (2015-2039), there will be increases in the percentage of dry and wet events in all climate change scenarios in the Grijalva and Usumacinta basins (Chiapas and Tabasco). The data suggest that in this region, it is highly probable that wet (SPI-12: 1 to 3) and dry (SPI-12: -1 to -3) events will continue to occur, and that the frequency of events will increase by a factor of 1.5. Grijalva-Usumacinta, Veracruz, and Puebla have a medium probability of this occurrence. The rest of the SSR has a low probability of events occurring at or above a 1.5 more frequency. By 2075-2099, Grijalva-Usumacinta and the Yucatan have a high probability of dry events due to climate change. It is moderately likely that there will be wet and dry events in Grijalva-Usumacinta (Chiapas and Tabasco), Veracruz, Oaxaca, Quintana Roo, and Puebla. In the rest of the study area, we found a low probability of wet and dry events occurring 1.5 times more frequently.
RCP 4.5 proved to be the wettest scenario for the study area, while RCP 8.5 had the driest events during both periods (2015-2039 and 2075-2099). RCP 6.0 was drier for 2015-2039 and wetter for 2075-2099. These results correspond with the previous results obtained in Tables 3 and 4, where the percentage of dry and wet periods were gathered over time. Changes in the projections of precipitation events under climate change scenarios in the SSR for the two future periods will recur 1.5 times more frequently than historical records, whereas the RCP 6.0 scenario demonstrated similarity to historical precipitation patterns. It was also found that the precipitation patterns are marked by the regional modulators, ENSO, PDO, and AMO.
However, climate change is not the only cause of strain on water resources. Many anthropic stressors disturb natural and human systems in the study area. Therefore, it is necessary to study the full scope of these stressors and the adverse effects of climate change. Understanding the full strain on water resources is critical for decision-makers to design resilient public policies that favor strengthening adaptive capacity at all levels.

