


 English (pdf)
 Article in xml format
 Article references
 Send this article by e-mail
 Cited by SciELO
  Cited by Google
  Similars in
SciELO
Similars in
SciELO  Similars in Google
 Permalink
Introduction
Global warming has led to global and regional climate change, frequent occurrence of high temperature, drought, flood, and other disastrous weather, causing ecological and environmental deterioration, seriously affecting agricultural production, social economy, and sustainable development (Bi et al. 2018). Especially in the context of global climate change, the spatial pattern of precipitation in China is directly related to agricultural production safety. The northern part of China is located in the northernmost end of the East Asian monsoon, which belongs to the temperate continental monsoon climate (Guo et al., 2019; Huang et al., 2018). It is the transitional zone between the humid Eastern monsoon region and China's arid inland region (Colliander et al., 2017) . It is hot and rainy in summer, cold and dry in winter, and the continental climate is becoming stronger from east to west. The seasonal change of its environment is closely connected with the general circulation of East Asia (Hall et al., 2016). The climate and its evolution are pretty different (Dai et al., 2018; Ren et al., 2019; Zeng et al., 2018). It is a typical "vulnerable area" and one of the most sensitive areas affected by climate warming. It is also the largest commodity grain production area and an essential heavy industry and energy base in China (Ferrari Dos Santos et al., 2017). Therefore, it is of great significance to study the characteristics of the periodic changes of precipitation in the north of China in the past hundred years for understanding the impact of climate change on rainfall and for short-term, medium-term, and long-term precipitation prediction. In recent years, many scholars have studied these characteristics. Lan Yongchao et al. studied the impact of climate change on the water resources system in the upper reaches of the Yellow River; Xu Yueqing et al. studied the law of precipitation change in Hebei Plain based on wavelet analysis; Lin Zhenyao et al. studied the temporal and spatial characteristics of temperature and precipitation change in the Qinghai Tibet Plateau; Dai Xingang et al. studied the multi-scale characteristics of precipitation in flood season and the inter-generational decay characteristics of summer monsoon in North China Levy.
In the past 50 years, under the background of global change, the changing trend of precipitation and the difference in the rule of time scale structure in northern China have attracted much attention (Wang et al., 2018). Since Bevis and Businger put forward the basic principle and method for remote sensing of atmospheric precipitable water by GPS technology in the 1990s, many experts, scholars, and scientific research institutions in various countries have invested in this research work. The more famous experiments include GPS/STORM, WWAVE, CLAM. (Wang et al., 2017). China has also done many experiments in the research of remote sensing of atmospheric Precipitable vapor by GPS, such as GPS/STORM experiment in Shanghai, GPS rainfall observation experiment in South China, GPS/MET experiment in Beijing, and has also achieved good results. At present, the technology of GPS remote sensing of atmospheric integrated water vapor content has been mature, and the recognized accuracy is 1-2 mm (Zhao et al., 2018). At the same time, because GPS remote sensing technology has a series of advantages, such as uniform global distribution, high resolution, low cost, easy maintenance and so on, it fully shows the potential application value of GPS technology in meteorological, hydrological, atmospheric monitoring and so on (Arrizabalaga & Li, 2018; Megat & Hassan 2018) . In order to study the change law of the average precipitation series in northern China in the past 50 years under the background of global change, this paper selects the inland cities Harbin, Changchun, Shenyang and coastal city Dalian, which have some differences in response to the regional precipitation change, and analyzes the periodic change law of precipitation in the northern China through the remote sensing technology using the annual precipitation from 1955 to 2005 in four regions (Li et al., 2018).
In this paper, the annual precipitation data of the above four typical cities are obtained by GPS remote sensing technology, and the periodic change of precipitation in the four regions is analyzed by the trend analysis process and wavelet analysis process.
Material and methods
Data sources and methods
Based on the remote sensing data of precipitation time series from 1955 to 2005 in Harbin, Changchun, Shenyang, and Dalian stations, the periodic variation of precipitation in the four stations is analyzed. Harbin, Changchun, and Shenyang are located in the northeast of China, the northernmost of the East Asian monsoon, which belongs to the temperate continental monsoon climate. Dalian is a coastal city, which is affected by the continental monsoon and marine climate. Therefore, it is of great significance to analyze the 50 year precipitation law of four stations for understanding the precipitation cycle change law in the semi-arid area of northern China under the background of global change (Rauber et al., 2018).
Retrieval of atmospheric precipitable water in four stations by GPS data
As the remote sensing technology of atmospheric precipitable water by GPS technology is mature, the introduction of basic principles (Mora et al., 2017) is omitted here, and the process of remote sensing of atmospheric precipitable water by GPS technology is only illustrated in Figure 1.
According to the flow chart in Figure 1, we can use the GPS observation data and the corresponding ground meteorological parameters to obtain the final comprehensive water vapor content of Harbin and the other three stations in 1955-2005.
In the calculation process, the total tropopause delay is calculated by GAMIT software developed by the Massachusetts Institute of Technology. Saastamoinen model is used for tropopause dry delay, and its expression is as follows:
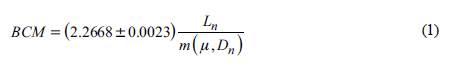
Where, m(μ,D n ) = 1-0.00255cos(2 μ)-0.00027Dn; μ isthe geographic latitude; D n is the altitude of the station (m); L n is the ground pressure (hPa); BCM is the zenith dry delay (mm).
When converting from wet delay to precipitable water content, the air's weighted average temperature E j in the conversion factor used is the Bevis model, namely:

Where E n is the station temperature (K).
Analysis of periodic change of precipitation
According to the GPS remote sensing technology of the atmospheric precipitable water in the four stations in the last section, through trend analysis and wavelet analysis process, the periodic change of precipitation in the four stations is further analyzed (Xing & Wang, 2016).
Trend analysis
The trend change is generally expressed by a linear regression equation based on precipitation and time.
Tracing method of Rare Earth Elements in surrounding rock of geological formation based on three-dimensional positioning algorithm
Where, F is the fitting value of precipitation; A is the annual change rate; A x 10 is the climate tendency rate, which means the change rate of precipitation per 10 a; i = 1, 2... n years.
Wavelet analysis
In this paper, the wavelet analysis method is based on Fourier transform, which introduces the window function to decompose the time series into the contribution of time and frequency. It is very effective for obtaining the adjustment rule of a complex time series, diagnosing the hierarchical structure of climate change, and distinguishing the evolution characteristics of time series on different scales. Through wavelet analysis, we can get the periodic structure and abnormal change rule of the studied object sequence in different time scales, which provides a scientific basis for short-term climate prediction (Rao et al., 2016). Combining with the anomaly calculation, the increase and decrease characteristics of precipitation in four stations are analyzed, and the periodic oscillation of precipitation in different time scales can be reflected by using Morlet continuous wavelet transform chart. The strength of the signal is expressed by the size of the wavelet coefficient. If the isoline is positive, it means more precipitation; If the isoline is negative, it means less precipitation; If the wavelet coefficient is zero, it means the mutation point. The wavelet variance map reflects the distribution of energy with scale year, which can determine the relative intensity of various scale disturbances in a time series. The scale at the corresponding peak is called the main time scale of the series, which is used to reflect the main period of the time series (Castro et al., 2017). Wavelet analysis takes time and frequency as independent variables, expands one-dimensional signals in time and frequency, so as to clearly understand the frequency characteristics of different time-domains of time series and the time distribution characteristics of different frequencies. Wavelet function is the key to wavelet analysis. It refers to a kind of function with oscillation and rapid attenuation to zero (Luo et al., 2017; Li et al., 2019). Wavelet function meets the following requirements:
In the formula, is the base wavelet function, which can form a group of function systems through scaling and translation on the time axis:
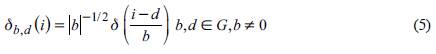
In the formula, δb and d(i) are subwavelets; b is the scale factor, reflecting the cycle length of wavelet; d is a translation factor, reflecting the translation in time.
For a given energy limited signal, its continuous wavelet transform is:
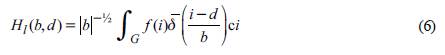
In the formula, H l ( b,d) is the wavelet transform coefficient; l(i) is a signal or square-integrable function; b is the scaling scale; d is the translation
parameter;
 is the complex conjugate function of

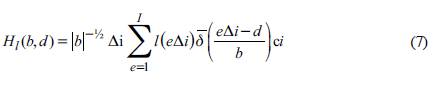
For discrete-time series data, assuming that there is a function l (eΔ i) (e = 1,2,...,I; Δi) is the sampling interval), the discrete wavelet transform form is:
Results
Periodic change of precipitation series
The wave characteristics of the real part of the wavelet transform coefficients can reflect the alternation of more and less precipitation, and the alternation of positive and negative positions can be observed. The wave changes of more and less precipitation in the calculation time domain can be observed obviously. It can be seen from Figure 2 that the precipitation structure corresponding to different time scales is different, and the number of small-scale changes shows a more complex number of structures nested on a larger scale. Based on the average situation of precipitation in Harbin, Changchun, Shenyang, and Dalian stations, the precipitation situation in the northern semi-arid area is estimated. There are five kinds of periodic changes in the average situation of precipitation in the four stations: 3-9, 9-18, 18-30, 30-41a, and 41-63a. Among them, the periodic oscillation is very significant on the scale of 41-63a, and the annual precipitation has experienced the cycle of less-more-less-more-less until the isoline of2005 is not closed, which indicates that the annual precipitation will continue to be less in the future; The 10a and 50a cycles have more obvious oscillation periods after 1955.
The modulus of Morlet wavelet coefficients reflects the distribution of energy density in the time domain corresponding to the period of change of different time scales. The larger the modulus of coefficients is, the stronger the periodicity of the corresponding period or scale is. In the annual precipitation of 4 stations, the 50a time scale model value is the largest, which indicates that the cycle change of this time scale is the most obvious. The 10a and 20a cycles are relatively large after 1955, and the cycle change is more obvious, and the cycle change of other time scales is small (Figure 3).
Relationship between precipitation anomaly and wavelet periodic frequency domain of four stations in the north of China in recent 50 years
In order to understand the variation law of precipitation in the northern semi-arid area in the past 50 years, the variation law of precipitation in Harbin, Changchun, Shenyang, and Dalian stations in the past 50 years is analyzed.
Figure 4(a) shows the precipitation distance map of Harbin in the recent 50 years. From Figure 4(a), in addition to the relationship between the annual precipitation and the 50-year average precipitation, it can be seen that the precipitation in Harbin experienced two cycles of less to more in 1955-2005, and the precipitation anomaly from 1955 to 1982 was negative, indicating that the precipitation in this period was less than that in the whole year; the precipitation anomaly from 1983 to 2005 was positive, indicating that the precipitation in this period was more than that in the whole year. The average annual precipitation of Harbin in 50 years is about 550 mm/a. By linear fitting of annual precipitation series in Harbin, it is found that the precipitation tendency rate is - 7.1 mm/10a, and the cumulative effect of such a high precipitation tendency rate is relatively large, which will lead to a gap of tens of millimeters between the current annual precipitation of Harbin and that of 50 years ago.
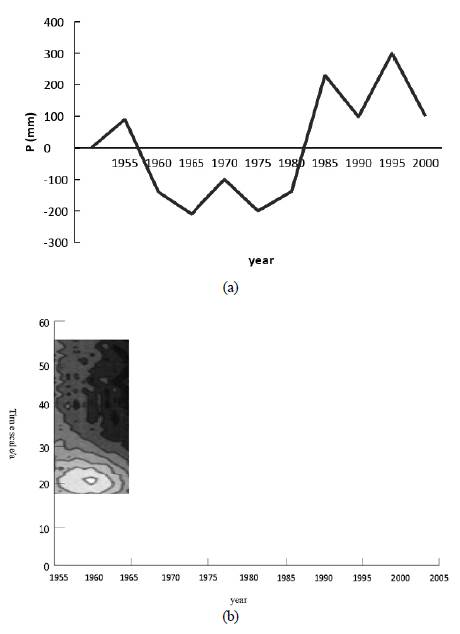
Figure 4 Annual precipitation anomaly (a) and Morlet wavelet transform (b) of Harbin from 1955 to 2005
In addition to the above analysis, it is difficult to see the change information of the shorter period from Figure 4(a). In this regard, Figure 4(b) gives the corresponding Morlet wavelet transform graph. Figure 4(b) clearly shows the periodic oscillation and abrupt point characteristics of annual precipitation in Harbin over the past 50 years on different time scales. The intensity of signal oscillation in the figure is represented by the size of the gray-scale. The larger the gray-scale is, the smaller the annual precipitation is; the smaller the gray-scale is, the larger the annual precipitation is. It can be seen from the comparison between Figure 4(b) and Figure 4(a) that more abundant information of the change period scale can be obtained from Figure 4(b). It can be seen from Figure 4(b) that there is a phenomenon of nested complex structure on the scale of multiple time periods. There are obviously short-term oscillation periods of 2-3a and 5-6a, the oscillation period of 10a, the medium-term oscillation period of 20a, and the long-term oscillation period of 50 after 1955.
From the change law in the figure, after 2005, Harbin is in the period of 2-3a, 5-6a short-term oscillation cycle with more precipitation; That in the oscillation period of 10a is less precipitation; In the medium-term oscillation period of 20a has experienced two cycles of more-less alternation, and the isoline of2005 oscillation cycle is far from closed, which shows that after 2005, the precipitation is in the period of less precipitation; And the isoline in the long-term oscillation period of 50a is still not closed, indicating that the precipitation will continue to maintain a slightly more trend in this period after 2005.
To sum up, the precipitation of Harbin in recent 50 years is controlled by multiple periodic laws, and there are obviously short-term oscillation periods of 2-3a and 5-6a, the oscillation period of 10a, the medium-term oscillation period of 20a, and the long-term oscillation period of 50a after 1950. From the point of view of the intensity of the oscillation, the medium-term change of 20a is the main control period of annual precipitation, but the short-term period of 5-6a and the long-term period change of 50a also have a great influence on the annual precipitation.
Figure 5(a) shows the precipitation distance map of Changchun in the recent 50 years. From Figure 5(a), it can be seen that the annual precipitation change law of Changchun from 1955 to 2005 is similar to that of Harbin, and it has also gone through two cycles, but the cycle law is just the opposite, that is, there are two cycles of more to less, the precipitation anomaly from 1955 to 1982 is positive, which indicates that the precipitation is more than that of the whole year in this period; The precipitation anomaly from 1983 to 2005 is negative, which indicates that the precipitation is less than that of the whole year in this period. The linear fitting of Changchun's annual precipitation series shows that the precipitation tendency rate is - 12.7 mm/10a, which is higher than that of Harbin. This shows that the annual precipitation in Changchun is decreasing, and the decreasing range is larger than that in Harbin. The accumulated precipitation in 50 years will cause the annual precipitation in Changchun to decrease by 126.8 mm more than that at the beginning of the 20th century. Considering that the annual average precipitation in Changchun is about 596 mm, this reduction is quite amazing.
In order to analyze the multi-periodicity of precipitation in Changchun in recent 50 years more clearly, the corresponding Morlet wavelet transforms chart is given in Figure 5(b), which clearly shows the periodic oscillation and mutation point characteristics of precipitation in Changchun in recent 50 years on different time scales. It can be seen from the comparison between Figure 5(b) and Figure 5(a), more abundant scale information of the change period can also be obtained from Figure 5(b). It can be seen from the comparison between Figure 4(b) and Figure 5(b) that the wavelet transform-law of annual precipitation in Changchun and Harbin is very similar. There are not only nested complex structure phenomena on multiple time period scales but also obvious short-term oscillation periods of 2-3a, 5-6a, 10-15a, 20a, and 50a after 1955. This may be the reason why the two cities are in the same climate background in Northeast China. The difference is that the long-term oscillation period of about 50 years is exactly the same as that of the less-more cycle in Harbin, that is, the more-less cycle.
According to the change law in the figure, Changchun is in the short-term oscillation periods of 2-3a and 5-6a with more precipitation after 2005; The oscillation period of 10a is the period of less precipitation; The medium-term oscillation period of 20a has experienced the cycle of more-less alternation, and the isoline of oscillation cycle in 2005 is far from closed, which shows that the precipitation is in the period of less precipitation after 2005; The isoline of the long-term oscillation period of 50a is still not closed, which indicates that the precipitation will continue to be less in this period after 2005.
In conclusion, the precipitation of Changchun in recent 50 years is controlled by multiple periodic laws, and there are obviously short-term oscillation periods of 2-3a and 10a, medium-term oscillation periods of about (b) from 1955 to 2005 20a, and long-term oscillation periods of about 50a. From the point of view of the intensity of the oscillation, the medium-term period variation of 20a is the main control period of the annual precipitation, but the short-term period of 2-3a and the long-term period variation of 50a also have a great influence on the annual precipitation.
Figure 6(a) shows the precipitation distance map of Shenyang in the recent 50 years. Compared with Harbin (Figure 4(a)) and Changchun (Figure 5(a)) in the past 50 years, it is found that the precipitation decrease trend of Shenyang in the past 50 years is not obvious, and the precipitation anomaly is close to zero. The linear fitting of the annual precipitation series in Shenyang shows that the precipitation tendency rate is 1.3 mm/10a, and the precipitation slightly increases.
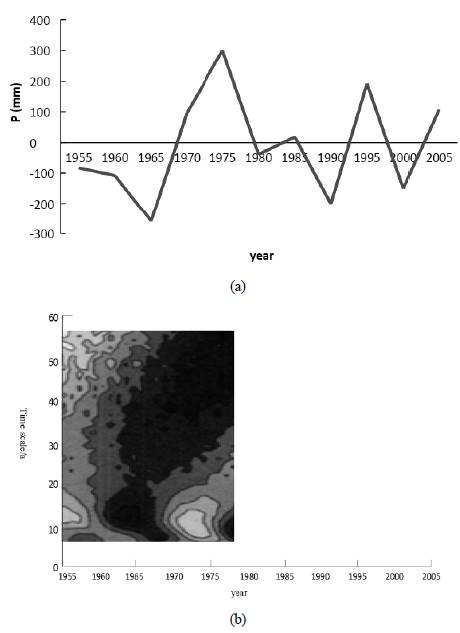
In order to analyze more clearly the multi-periodicity of precipitation variation in recent 50 years in Shenyang, the corresponding Morlet wavelet transform chart is given in Figure 3(b), which clearly shows the periodic oscillation and mutation point characteristics of precipitation in recent 50 years in Shenyang on different time scales. It can be seen from the comparison between Figure 6(b) and Figure 6(a) that more abundant information of the change cycle scale can also be obtained from Figure 6(b). Compared with the wavelet transform of Morlet in Harbin (Figure 4(b)) and Changchun (Figure 5 (b)), it can be seen that Shenyang also has an obvious short period of 2-3a and 10a and a long period of 50a, but the main control period of annual precipitation of 20a does not appear.
According to the change rule in the figure, Shenyang is in the period of 2-3a, 10a, and 50a with more precipitation after 2005.
In conclusion, the precipitation in the recent 50 years in Shenyang is controlled by multiple periodic laws, and there are obviously short-term oscillation periods of 2-3a and 10a and long-term oscillation periods of about 50a. From the point of view of the intensity of the oscillation, the medium-term period variation of about 10a is the main control period of the annual precipitation, but the short-term period of 2-3a and the long-term period variation of 50a also have a great influence on the annual precipitation.
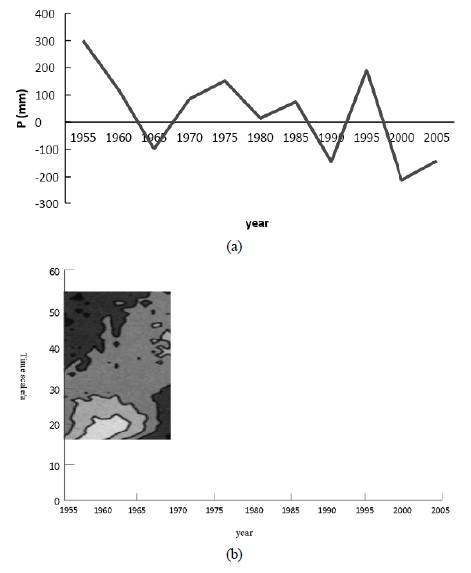
Figure 7(a) shows the precipitation anomaly of Dalian in the recent 50 years. It can be seen that the annual precipitation variation law of Dalian from 1955 to 2005 is similar to that of Changchun, and it has also gone through two-cycle periods, i.e. more-less cycle period, i.e. the precipitation anomaly from 1955 to 1980 is positive, which indicates that the precipitation in this period is more than that in the whole year; The precipitation anomaly from 1981 to 2005 is negative, which indicates that the precipitation in this period is less than that in the whole year. The precipitation tendency rate of Dalian is -2.7 mm/10a, which is smaller than that of Harbin and Changchun. This may be related to the influence of marine climate in Dalian.
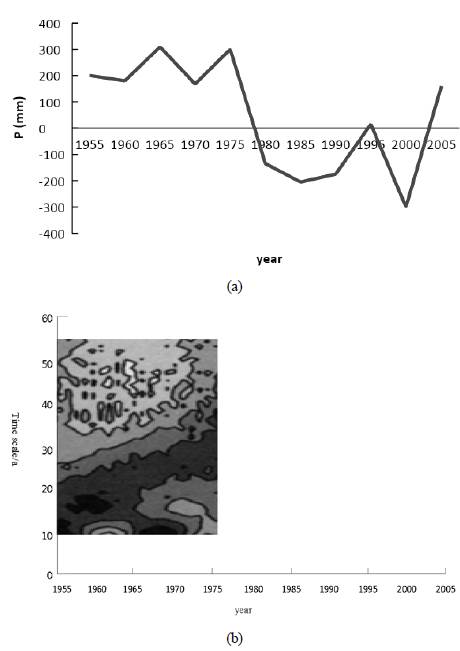
Figure 7 Annual precipitation anomaly (a) and Morlet wavelet transform (b) of Dalian from 1955 to 2005
In order to analyze the multi periodicity of precipitation variation in Dalian in recent 50 years more clearly, the corresponding Morlet wavelet transform chart is given in Figure 7(b), which clearly shows the periodic oscillation and mutation point characteristics of precipitation in Dalian in recent 50 years on different time scales. It can be seen from the comparison between Figure 7(b) and Figure 7(a) that richer scale information of the change period can also be obtained from Figure 7(b). Compared with the wavelet transform of Morlet in Harbin (Figure 4(b)), Changchun (Figure 5(b)) and Shenyang (Figure 6(b)), it can be seen that Dalian also has obvious short-term periods of 2-3a and 10a and long-term period of 50a, but the main control period of annual precipitation in 20a does not appear which is the same as that in Shenyang. It also shows that Shenyang and Dalian are close in geography and regional climate.
From the change in the figure, Dalian and Shenyang are also in the precipitation period of 2-3a, 10a, and 50a after 2005.
In conclusion, the precipitation of Dalian in recent 50 years is controlled by multiple periodic laws, and there are obviously short-term oscillation periods of 2-3a and 10a and long-term oscillation periods of 50a. From the point of view of the intensity of the oscillation, the medium-term period change of 10a is the main control period of the annual precipitation, but the short-term period of 2-3a and the long-term period change of 50a also have a great influence on the annual precipitation.
The main period of precipitation series
The wavelet variance map can reflect the distribution of the fluctuation energy of the precipitation time series with the scale and can be used to determine the main period in the annual precipitation. There are five obvious peaks in the wavelet variance map of precipitation in four stations, which correspond to the time scales of 50a, 37a, 20a, 14a, and 6a in turn. Among them, the maximum peak corresponds to the time scale of 50a, indicating that the cycle oscillation of about 50a is the strongest, which is the first main cycle of precipitation change in four areas; The 20a time scale corresponds to the second peak, which is the second main cycle of annual precipitation change; The third peak corresponds to the time scale of 14a, which is the third main cycle; The fourth peak corresponds to the time scale of 37a, which is the fourth main cycle; The fifth peak corresponds to the time scale of 6a, which is the fifth main period. The fluctuation of the above five periods controls the variation characteristics of the annual precipitation in the whole time domain of the four regions, as shown in Figure 8.
According to Figure 8, the main periods of precipitation in four stations of Harbin, Changchun, Shenyang, and Dalian are 6a, 14a, 20a, 37a, and 50a respectively, of which the peak value of 50a precipitation is the most obvious. Therefore, the periodic changes of precipitation in the four stations can be derived from the periodic changes of precipitation in the northern semi-arid areas.
Discussion
The northern part of China consists of three parts: the northwest, the north, and the northeast. The area is large and the terrain is complex, the influence system is various, and the characteristics of precipitation change in different areas are quite different. Especially in recent decades, under the background of global warming, there are signs of transition from drought to wetness in North China, but North China and the south of Northeast China are still in a continuous semi-arid period. This paper analyzes the precipitation regularity in the north-east semi-arid area by taking the 50-year periodic precipitation variation regularity of Harbin, Changchun, Shenyang, and Dalian as an example.
The research on the change rules of precipitation time series and the characteristics of multi-time scales in the semi-arid area of North China is the basis of the research on how to mine the water production potential and development degree of grain crops, which is of great theoretical significance for the rational development of grain production in the commodity grain production area of North China. Based on the analysis of the 50-year precipitation series from 1955 to 2005 in Harbin, Changchun, Shenyang, and Dalian, the multi-time scale complex structure of the annual precipitation change in the northern semi-arid area is studied. The main conclusions are as follows:
(1) There are five kinds of periodic changes of precipitation in the north of China: 3-9, 9-18, 18-30, 30-41a, and 41-63a. The period of 9-18a and 18-30a appeared more obvious after 2005 and 1955 respectively, and the period of 41-63a is more significant.
(2) In the past 50 years, the annual precipitation in the northern region has shown a decreasing trend, with a decrease of 5.2 mm/10a in the whole northeast region; 12.7 mm/10a in Changchun; 7.1 mm/10a in Harbin; 2.7 mm/10a in Dalian; And 1.3 mm/10a in Shenyang.
(3) The annual precipitation in the northern region has the periodic change characteristics under the regional multiple time scales, and the long-term oscillation periods of 2-3a, 5-6a, 10a, and 50a have the global characteristics. From the point of view of the intensity of the oscillation, the mid-period change of about 20 years is the main control period of the annual precipitation in Changchun and Harbin, but the short period of 5-6 years and the long period change of 50 years also have a great influence on the annual precipitation.
(4) From the study of the periodicity of the wavelet transform, it is found that after 2005, Harbin is in the period of 2-3a, 5-6a short-term oscillation cycle with more precipitation; the oscillation period of 10a and 20a is the period of less precipitation, and the long-term oscillation period of 50a will continue to tend to be more than one. Changchun is in the period of 2-3a, 5-6a short-term oscillation with more precipitation; the oscillation period of 10a and 20a is less precipitation, and the long-term oscillation period of about 50a will continue to be less. Shenyang is in a more precipitation period of 2-3a, 10a, and 50a. Dalian is in a more precipitation period of 2-3a, 10a, and 50a. However, the whole northern region is in the period of more precipitation in 2-3a and 10a, less precipitation in 20a, and more precipitation in 50a.
(5) There are five obvious main periods of precipitation in the four stations, which correspond to the time scales of 50a, 37a, 20a, 14a, and 6a, among which 50a is the highest peak, and the fluctuation of five periods controls the variation characteristics of annual precipitation in the whole time domain. Based on the above analysis, the periodic variation of precipitation in the northern semi-arid area can be deduced.
Under the background of global warming, the characteristics of precipitation change in different regions in the north are different, which may be caused by the influence of different circulation characteristic factors in different regions and scales. Therefore, to understand the causes of precipitation change in different regions in the north, it is necessary to further combine the factors of zonal circulation, meridional wave train, East Asian monsoon, and SST to make further research.
Conclusions
In this paper, the precipitation regularity of the four stations in Harbin, Changchun, Shenyang, and Dalian from 1955 to 2005 is analyzed. The precipitation data of the four stations in the northern semi-arid area in the past 50 years are obtained by GPS remote sensing technology. According to the precipitation data, the regression equation of trend change and the wavelet analysis method are used to describe the trend change of precipitation in four stations and the regular pattern of the periodic structure and the abnormal change of precipitation periodic series in different time scales.
Among them, in the process of wavelet analysis, the 50 year precipitation anomaly and the frequency domain relationship of wavelet period in four regions are analyzed, and the precipitation tendency rate of each region and the precipitation in the short, medium and long-term oscillation periods of wavelet are obtained. According to the precipitation time series fluctuation reflected by wavelet variance chart, the main period in the comprehensive annual precipitation of four regions is determined, and the annual precipitation in the whole time domain of four regions is studied based on the characteristics of internal variation, and the regularity of periodic variation of precipitation in the northern semi-arid area can be inferred. The results show that based on GPS remote sensing technology and wavelet analysis, the proposed method can effectively analyze the periodic change of precipitation in the northern semi-arid area.

