


 Inglés (pdf)
 Articulo en XML
 Referencias del artículo
 Enviar articulo por email
 Citado por SciELO
  Citado por Google
  Similares en
SciELO
Similares en
SciELO  Similares en Google
 Permalink
Introduction
Mining activities inevitably induce surface displacements. If they are not correctly detected and interpreted, they can overcome acceptable limits and eventually lead to failure, affecting production, safety of workers and mining equipments. In order to avoid these issues, in situ geotechnical monitoring systems are commonly employed, as optical leveling, GPS, ground-based radar interferometry and extensometer. Nevertheless, these methods are used only after the detection of geotechnical problems by field inspection, such as terrain cracks, rock/soil failures and sudden changes in the groundwater behavior. Besides, traditional geotechnical monitoring systems can provide only punctual information about the deformation state of activity.
In order to anticipate risk situations in mining activities, remote sensing techniques like the Persistent Scatterer Interferometry - PSI have increasingly been used in the last decade (Pinto et al., 2015; Hartwig, 2016; Hartwig et al., 2013; Colesanti and Wasowski, 2006). This satellite-based approach allows detecting and monitoring tiny surface displacements over large areas with millimetric to centimetric accuracy, day and night, independently of the weather conditions. The PSI method consists in combining large sets of complex synthetic aperture radar (SAR) scenes, obtained from different positions both in space and time. This approach exploits the phase differences of the signals of ground targets that exhibit high temporal phase stability, designated as persistent scatterers - PS. Since the phase of the electromagnetic wave depends on the distance between the antenna and the target, it is possible to track superficial displacements over time.
For geotechnical applications, satellite scenes with high spatial and temporal resolutions are usually required, which can only be achieved by using commercial satellite data. In 2014 and 2016 the European Space Agency -ESA launched the Sentinel-1 constellation of two satellites. The Sentinel-1 is a C-band synthetic aperture-imaging mission developed for land monitoring. The satellites acquire images globally in different modes with temporal frequency of 6 and 12 days. The interferometric wide swath mode (IW) are freely available and have 5 x 20 meters spatial resolution. These characteristics make IW Sentinel-1 data suitable for many different applications, particularly large-scale deformation phenomena (Funning and Garcia, 2019; Intrieri et al., 2018; Sowter et al., 2016; Nagler et al., 2015).
The Riacho dos Machados Gold Mine (MRDM) is located in the northeastern portion of the Minas Gerais State (Figure 1) and comprises an open pit mine with almost 100 meters of depth and surface mining area equals to 0,75 km2, mined in decomposed greenish schists oriented NNE-SSW. The mineralization is hosted in paleoproterozoic quartz-muscovite-schists, affected by ductile-brittle shear zones and hydrothermalism developed during the Brazilian Tectonic Cycle (Neoproterozoic) (Fonseca, 1993; Fonseca et al., 1997). The MRDM has mineral reserves estimated in 3 million of tons with average Au grade of 0.94 g/t. In 2016, the mine was acquired by Brio Gold Mining Company, which was purchased by the Leagold Mining Company in 2018. From May 2016 to May 2018, 102,283 oz of gold was produced in the MRDM (RPA, 2018).
In recent years, the Central and South pits of the MRDM have recorded planar failures (both global and local) in the footwall slopes (Figure 1) controlled by the metamorphic foliation planes, which eventually interrupted ore exploitation in 2015 (Peterle et al., 2019). In 2017, a new smaller rock failure occurred in the footwall slopes of the South pit (VOG, 2017). In this sense, the aim of this work is to evaluate the applicability of the freely available IW Sentinel-1 SAR scenes in order to detect and monitor surface displacements induced by mining activities. For this purpose, 39 complex radar scenes acquired in descending orbit track between January 2018 and April 2019 were interferometrically processed in the SARPROZ software.
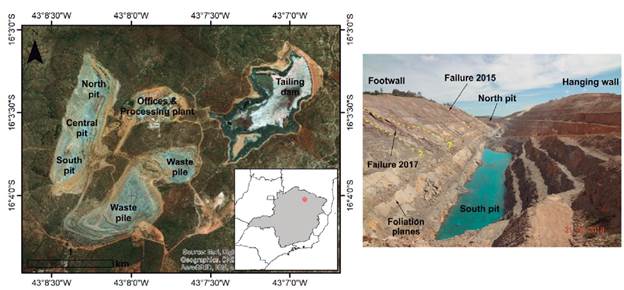
Figure 1 Location of the study area (left) and overview of the mine with indication of past failures locations (right)
The satellite Sentinel-1
The Sentinel-1 constellation of two satellites is a global radar-imaging mission developed by the European Space Agency - ESA (ESA's Sentinel Online website). The Sentinel-1A was launched in 2014 and the Sentinel-1B in 2016. The single look complex - SLC scenes are freely available at https://sentinel.esa.int/web/sentinel/sentinel-data-access. Table 1 summarizes the main features of the Sentinel-1 satellites.
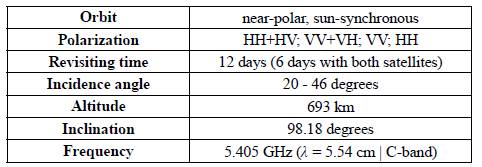
The satellites operate in four acquisition modes: Stripmap (SM), Interferometric Wide swath (IW), Extra-Wide swath (EW) and Wave (WV). The IW mode acquires data with 250 km swath at 5 x 20 meter spatial resolution. IW mode captures three sub-swaths by using the TOPSAR technique. As a result, IW SLC products contain one image per sub-swath. Each sub-swath image consists of a set of bursts, each of them are processed as a single SLC image and between sub-swaths and adjacent bursts there are black-fill demarcation stripes.
In Brazil, Sentinel-1 imagery has been acquired since 2015 and is only available in descending mode each 12 days.
Site geology and geomechanical conditions
The study area occupies part of the external zone of the Neoproterozoic Araçuaí-West Congo Orogen in Brazil (Alkmin et al., 2006; Pedrosa-Soares and Wiedmann-Leonardos, 2000). The MRDM is included in a granitic-gneissic and migmatitic Archean basement window, termed as Itacambira-Monte Azul block, partly reworked during the Neoproterozoic orogeny (Guimarães et al., 1993). This tectonic block is surrounded by the metasedimentary rocks of the Espinhaço Supergroup (Mesoproterozoic) to the south and east and by the Macaúbas and Bambuí groups (Neoproterozoic) to the east and west, respectively (Crocco et al., 2006). It includes the Córrego dos Cedros/ Porteirinha Complex, several igneous plutons and the Riacho dos Machados Group (GRM) (Guimarães et al., 1997).
The GRM comprises a sequence of Paleoproterozoic/Archean metavolcanic-sedimentary rocks (Fonseca et al., 1997; Guimarães et al., 1997). The metamorphism of the GRM reached upper greenschist facies (kyanite-staurolite zone). According to Crocco-Rodrigues et al. (1993) rocks of the GRM show a complex structural pattern due to the presence of tight folds and faults. The gold mineralization in the GRM is related to hydrothermal alteration and fluid flow in shear zones (Fonseca et al., 1997).
In the mine area, the GRM corresponds to a sequence of sheared and hydrotermalized quartz-muscovite schist, quartz-feldspar schist and pelitic schist. Gold mineralization is mainly hosted in the quartz-muscovite schists (QMX) and is related with the content of sulfides (arsenopyrite) (Fonseca, 1993). The most penetrative geological structure observed in the mine area is an undulating schistosity oriented NNE and dipping to southeast with moderate dip angles. Brittle geological structures such as joints show a significant range of orientations (Geoestável, 2015). According to Geoestável (2015) four classes of rock mass quality (Bieniawski, 1989) are distributed horizontally throughout the mine area. According to this report, rock mass quality tends to increase with depth, ranging from very poor rock near the surface to good rock near the pit.
SAR, DInSAR and PSI overview
Radar remote sensing comprises active systems that present lateral viewing geometry, which may lead to image distortions (e.g., layover, foreshortening and shadow), particularly if it is acquired over rugged terrains. Synthetic Aperture Radar - SAR transmits polarized electromagnetic waves within microwave frequencies (electromagnetic wavelength, λ = 1-100 cm) and record as a complex number, the amplitude and phase signal backscattered from ground targets for each resolution cell of an illuminated scene. The amplitude of the backscattered signal represents the reflectivity of the targets and depends on target and system parameters (e.g., dielectric constant, roughness, etc.). The phase of the signal indicates the cycle stage in which the wave is at a given moment. This angular quantity varies from 0 to 2p radians (Madsen and Zebker, 1998).
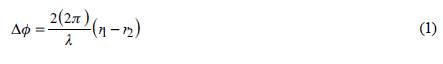
SAR interferometry (or simply InSAR) consists of combining two co-registered complex scenes, acquired from slightly different positions in space and time, along or across orbit track, to form an interferometric pair (Rosen et al., 2000; Bamler and Hartl, 1998) (Figure 2). The spatial and temporal separation of the acquisitions are called normal and temporal baselines, respectively. The interferometric phase difference (ΔФ) can be derived by multiplying a master scene (Ф 1) by the complex conjugated of a slave scene (Ф 2). This quantity will depend on the sensor-target distance (Δr) as follows:
Source: authors.
Figure 2 InSAR geometry. S1 and S2 correspond to the positions of the antennas in different acquisition times. B is the spatial separation of the antennas, 9 is the view angle of the sensor, H is the height of the satellite, r corresponds to the slant range distance and h is the terrain height in the point P with respect to a reference surface (horizontal line).
The value 2 in the equation above refers to the round-trip of the radar signal, λ is the radar wavelength, r and r 2 are the slant range distances in different time acquisitions and 2ϖ stands for wrapped interferometric phase.
Since the SAR scenes are usually acquired in different spatial and temporal positions, the interferometric phase difference (ΔФ) will contain contributions from different sources:

The first, second, third, fourth and the fifth terms of Eq. 2 stands for phase contributions due to deformation between acquisitions, surface topography, atmospheric artifacts, noise and orbit errors, respectively. The so-called Differential Synthetic Aperture Radar Interferometry - DInSAR technique consists of isolating the deformation component of the phase from the others (Amelung et al., 1999; Massonnet and Feigl, 1998; Carnec et al., 1996). However, in spite of its centimetric accuracy (Strozzi et al., 2001), the DInSAR technique can be severely affected by atmospheric delay (Zebker et al., 1997). In order to tackle with this issue, Ferretti et al. (2001) and Ferretti et al. (2000) originally patented the Persistent Scatterer Interferometry - PSI. The PSI consists of a multi-temporal analysis of the phase stability of stable scatterers across large stacks of SAR scenes. It was recognized that rock outcrops and man-made structures show a stable behavior over long periods of time and thus exhibit high temporal coherence. Because of the reflection dominance and consistency of these point-like scatterers within the resolution cell over time, the uncorrelated atmospheric phase component can be estimated and removed from each interferogram. In the PSI approach all SAR scenes are processed at full spatial resolution scale and connected to a unique master scene. The selection of the master scene is based on the spatial and temporal baselines of the dataset (the best combination of scenes that results in the highest temporal coherence). Due to phase ambiguities, that is, sudden phase changes either in space or in time, a linear model is assumed in order to derive deformation rates. Deformation rates are then computed with respect to a stable reference point selected within the imaged scene, since phase differences are relative both in space and time.
Currently, there is a large number of PSI methods, also called Advanced DInSAR (A-DInSAR). These methods can be distinguished based on the baseline configuration, image resolution, ambiguity resolution method, a-priori pixel selection, a-posteriori pixel selection and atmospheric signal estimation (Perissin and Wang, 2012; Ferretti et al. 2011; Hooper et al. 2004; Werner et al. 2003; Berardino et al. 2002). A review about the PSI methods and principles can be found in Pepe and Calo (2017) and Crosetto et al. (2016).
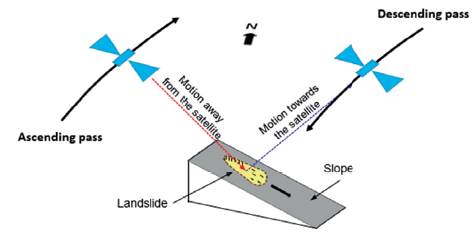
The PSI methods can be subjected to decorrelation effects due to physical and geometrical changes of the surface, such as moisture, erosion, volcanic episodes, rain, etc. These can lead to phase degradation, which limits the applicability of the method. In order to achieve deformation measurements within millimetric accuracy, at least 25-30 SAR scenes are usually interferometrically processed (Colesanti et al., 2003). The maximum detectable surface displacements will depend on the radar wavelength, the temporal and spatial resolutions, rate and type of deformation (e.g., smooth versus abrupt surface motions) and the scale of the deformation phenomena. According to Crossetto et al. (2016), Wasowski and Bovenga (2014) and Sabater et al. (2011) the theoretical maximum detectable displacement between acquisitions and between adjacent pixels is 1/4, where lambda is the radar wavelength. Another aspect involved with this technique is that it can only measure a one-dimensional motion along the line-of-sight (LOS) of the sensor (Figure 3). In order to retrieve vertical and horizontal displacements (in the E-W direction), data acquired in both ascending and descending passes must be geometrically combined (Fuhrmann and Garthwaite, 2019).
Dataset and methods
In this study, we used 39 Single Look Complex - SLC descending scenes from the Sentinel-1B satellite, in VV polarization, acquired in the Interferometric Wide swath mode - IW (sub-swath 3) from 2018/01/10 to 2019/04/11 (16 months), with incidence angle ranging from 41 to 53 degrees (45 degrees in the study area). These images were processed in the latest version of SARPROZ software (https://www.sarproz.com/). The Persistent Scatterer Interferometry -PSI method was applied. In order to minimize temporal baseline and maximize temporal coherence, the scene acquired at 2018/09/19 was chosen as the master scene for the generation of the interferograms. Perpendicular baselines are below to ±104 meters. For the compensation of the topographic effects, the SRTM Global 1 arc second (30m) digital elevation model was used. A stable reference point with high temporal coherence (a civil infrastructure target) outside the mining area was selected for the estimation of the displacements. The processing chain is summarized in Figure 4.
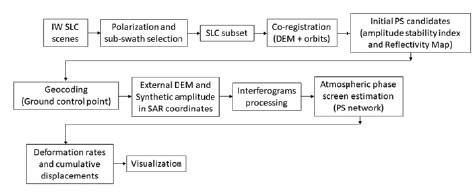
Figure 4 SARPROZ workflow for multi-temporal InSAR. Acronyms: IW -Interferometric Wide swath mode, SLC - Single Look Complex radar images, DEM - Digital Elevation Model, PS - Persistent Scatterer, SAR - Synthetic Aperture Radar.
Validation with in-situ measurements is not trivial due to non-identical measurements locations in both space and time and non-identical reference points. Nevertheless, in order to validate the deformation time series measured from space, we tentatively compared it with vertical displacements measured through Total Station Leveling (Colesanti et al., 2001). This method can determine the full 3D displacement vector. For this study, only one benchmark prism was available (Figure 5) and displacements were recorded from 2018/01/03 to 2018/04/27. Prism accuracy is about two millimeter. Sentinel-1 SAR scenes were acquired approximately at 05h19a.m each 12 days. Therefore, we compare the closest data in both space and time. The spatial distance between the PS and the benchmark is 25 m. Since InSAR can provide only the component of the deformation along the line of sight, in order to keep results comparable, we multiplied the benchmark measurements by the cosine of the local incidence angle (Pinto et al. 2015).
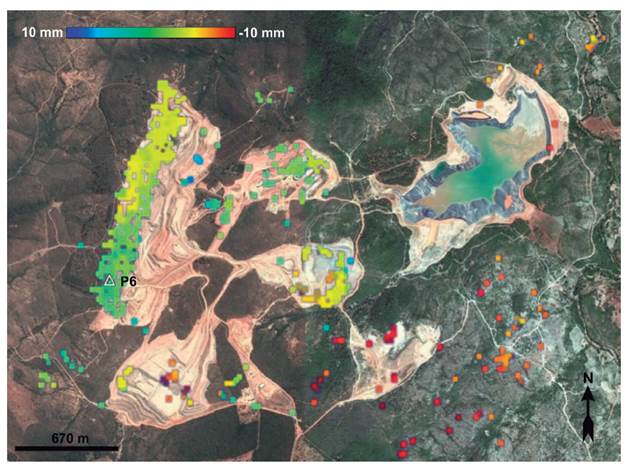
Figure 5 LOS deformation map for the entire MRDM overlaid on GoogleEarth optical imagery for the period from January 2018 to April 2019. Open triangle represents the benchmark prism P6 used for validation purposes. LOS deformation scale bar ranges from -10 to 10 mm.
As pointed out before, radar scenes may be subjected to geometric distortions due to slope orientation (aspect) and slope inclination with respect to the radar incidence angle of illumination. These effects when present make phase information useless. Sentinel-1 exhibits very low sensitivity for motion detection for slopes with displacement vectors parallel to its orbit track. In the study area, this corresponds to NNE and SSW-facing slopes. Issues as described above can be minimized by using radar scenes with different incidence angles or by combining radar scenes acquired in both ascending and descending orbit tracks (Fuhrmann and Garthwaite, 2019).
Results and discussions
In mining activities, surface displacements may be induced in three main different ways: 1) due to underground and slope excavations; 2) due to mining waste disposal in waste piles; and 3) due to discarding of mining byproducts after ore concentration in tailings dams. Read and Stacey (2009) and Sjõberg (1996) pointed out many reasons for mine slope motions, such as poor rock mass quality, induced vibrations, poor rock blasting, inadequate slope geometry (both height and slope angle), slope erosion, lithologies with reduced strength, high rock stress, unfavorable geological structures (both orientation and strength properties), high underground water pressures, etc.
The acceptable amount of displacements depends overall on the strength and deformability properties of rock masses and earth-like materials (Zavodni, 2000). Displacement warning levels are defined then usually as low, moderate and high and their limits are updated as new data is compiled during mine life span. When a warning level is reached, a set of procedures is immediately implemented in order to keep geotechnical risks acceptable and keep mining operations.
Figure 5 depicts LOS deformation map for the entire MRDM for the period between January 2018 to April 2019. A total of 630 PS was detected over the processed area, which corresponds approximately to 45 PS/km2. PS are distributed heterogeneously over the area. For the tailing dam very few points (PS) were mapped and in situ geotechnical monitoring data are unavailable. Cumulative displacements range from -16.9 to +7.7 mm. Displacement accuracy varied between 1.4 to 7.9 mm. The deformation state for the entire footwall slopes does not show critical behavior, considering the deformation magnitudes observed in the period and the warning levels adopted for mining operation. In fact, slope displacements below 50 mm is considered normal for open pit mining operation in the MRDM. In addition, no anomalous behavior has been reported elsewhere in the mine area during the image acquisition interval. Data shows a gentle subsidence pattern over waste piles. Hartwig (2016) and Paradella et al. (2015) have described displacements well above these values for the waste piles of the N4 iron mines, Carajás, state of Pará (> -20 cm/year). Pinto et al. (2015) detected deformation rates over waste piles in the Azul Mn Mine equal to -17 cm/year.
Figure 5 also shows many PS in the southeast region outside the mine site. This area comprises bare soil, shrubs, small trees and sparse grassland. These points shows a consistent subsidence pattern and record the largest negative deformation values for the entire area. The MRDM is located in a stable Archean basement window (Guimarães, 1993). According to RPA (2018) the MRDM is located in a arid region with annual precipitation ranging from approximately 300 mm to 1,500 mm (with an average of 700 mm over the last years) and pan evaporation of 1,398 mm/year. In 2015 and in the following years mine operations were affected due to a severe drought. MRDM operated ten groundwater wells between 2011 and 2019. Although groundwater wells data are not available (e.g. well locations, water flow rate and water level measurements), a possible explanation for the subsidence pattern observed in Figure 5 could be regarded to groundwater pumping for water supply in mining operations.
The site geology is essentially made of Precambrian schists. Mine geology has revealed the presence of both ductile and brittle structures. Groundwater is stored in geological structures (fractured aquifer). When groundwater is pumped, the effective stress increase and the rock mass deforms vertically (Galloway and Hoffmann, 2007). The amount of deformation depends on the virgin state of stress, discontinuity stiffness and orientation and on the amount of groundwater pumped (i.e. fluid pressure decrease). Although the process is more effective in porous aquifers, it has already been verified in fractured aquifers as well (Schuite et al., 2015).
The IW Sentinel 1 imagery presents great advantages over traditional geotechnical monitoring systems, since it is able to cover large areas without the need of field surveys, which poses potential risks for technical personal. However, small areas subjected to high deformation rates as well as vegetated areas (Figure 5) cannot be "seen" with IW Sentinel 1 scenes. Moreover, deformation maps based on IW Sentinel-1 SAR scenes as presented in this study may show a highly heterogeneous PS distribution in space. For instance, the hanging wall slopes are poorly covered by PS data. Therefore, in open pit mines, does not exist a unique method capable of tackling with all its complexity. For this reason, multiple source datasets should be fully integrated (Vaziri et al., 2010).
PSI Validation
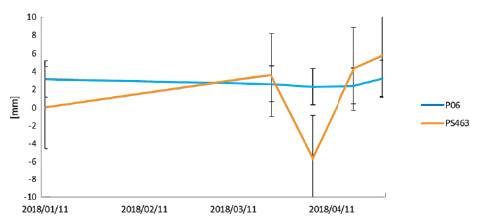
For the period of this study, only benchmark prism P6 was available. Figure 6 compares displacements obtained by benchmark prism P6 and PS463. Benchmark prism P6 is located in the slope bench and PS463 is located in the slope face. Both are located close to failure 2017 indicated in Figure 1, where outcrop rock masses with fair quality (RMR III). P06 and PS463 show minimum, maximum and medium displacement values equals to 2.32, 3.22 and 2.75 and 0, 5.67 and 1.62, respectively. Figure 6 shows that measurements acquired from both instruments are quite similar in magnitude. Measurements in April 11, 2018 show a maximum difference of nearly 7 mm. Its significance is not clear, but may be due to measurement locations in space and time, which are not exactly the same. Anyhow, displacements do not show any clear tendency and their magnitudes are small, indicating that the slopes can be considered stable for this period.
Final remarks and outlook
This work aimed to evaluate the applicability of the freely available Sentinel-1 SAR scenes for detecting and monitoring mine-induced displacements based on the PSI technique for the MRDM. The following can be stated:
1) Small values of deformation (< |16.9| mm) have been remotely detected for the MRDM. That indicates a stable geotechnical behavior considering the expected deformation levels for mining operation;
3) Deformation maps based on IW Sentinel-1 SAR scenes should be combined with data derived from other monitoring methods since PS coverage is heterogeneous;
4) Deformation maps with millimeter accuracy based only on descending Sentinel-1 SAR scenes can be produced at least each 12 days since the processed data set is large enough (> 40 scenes).

