


 English (pdf)
 Article in xml format
 Article references
 Send this article by e-mail
 Cited by SciELO
  Cited by Google
  Similars in
SciELO
Similars in
SciELO  Similars in Google
 Permalink
Introduction
With the rapid progress of science and technology and the continuous improvement of modernization, coal mining equipment is increasingly developing towards the direction of large-scale, integrated, high-speed, precise and intelligent. With the development trend of mechanical equipment, it is the complexity of equipment. The relationship between different equipment and different parts of the same equipment is more complex, forming a unified whole. When any one of the components fails, not only the operation of the equipment itself, but also the operation of other equipment associated with the equipment will be affected, which will cause a series of chain reactions, resulting in the interruption of the operation of the whole equipment, affecting normal production and product quality. On the other hand, affected by the geological conditions and hydrological environment of coal mining, under the complex natural environment, the mining difficulty of coal mining equipment is greatly increased. Excessive operation makes the gears and bearings in the equipment prone to failure. Therefore, through real-time monitoring of the working conditions of gears and bearings, the traditional research methods, obtain the operation parameters of parts, and statistics the fault location through the difference method, to find the nodes prone to failure and the time of failure. It is found that the signal of the fault location is unstable due to the poor ability to analyze the fault characteristics, which makes the accuracy of the fault mechanism decline. Therefore, a new fault diagnosis mechanism research method is proposed. According to the relationship between gears and bearings, the method resets more stable fault feature extraction and location according to the acquisition method of cyclostationary signal and projection decomposition operation method to ensure the reliability of fault diagnosis mechanism (Morris et al., 2018). This method not only solves the existing problems of the traditional methods, but also provides scientific and technical solutions for the fault diagnosis mechanism research of gears and bearings in other fields, and provides reasonable research methods for the development of national equipment and technological innovation.
Research method of fault diagnosis mechanism of gears and bearings for coal mining equipment in complex geological environment
Calculation of yield strength of gears and bearings in complex geological environment
On the basis of defining the basic parameters of a complex geological environment, the yield strength of gears and bearings is calculated. As all gears and bearings will not be perfect, under the influence of a complex mining geological environment, the top of gears may buckle within a reasonable range due to the influence of bearing force during operation (Balestro et al., 2018). Therefore, to determine the directional elasticity of the stability of gears and bearings, the method of angular displacement can be used for directional analysis. Under the complicated geological conditions, the equation of angular displacement of gears after bearing the axial force is as follows:
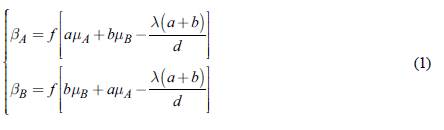
In the formula, f represents the linear stiffness of the bearing, f = EI / d , d represents the size of the gear, A and B represent the left and right ends of the gear respectively, β A and β B represent the angular displacement of the two ends of the gear, μ A and μ B represent the deformation angle of the two ends of the gear respectively, λ represents the lateral displacement value of the bearing, a and b represent the stability function and the bending stiffness coefficient. Figure 1 is a schematic diagram of the gear tooth deformation curve under the axial force.
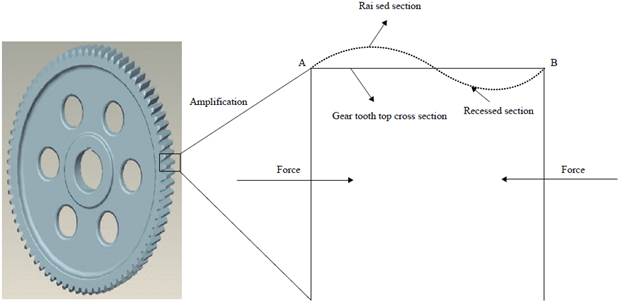
In the figure above, it is the displacement of a single gear tooth after deformation, and the critical load can be calculated only according to the balance equation. However, the fault situation shown in the figure is relatively simple. Under the condition of bearing and gear tooth deformation, the tooth slot will also be deformed. Therefore, the shear balance equation should be established to solve the elastic buckling load. Figure 3 is the structural diagram of the gear after the deformation of the teeth and grooves. Assuming that there is vertical load on the axis at the upper and lower ends of the structure, it is represented by p 1 and p 2 (Wang et al., 2018).
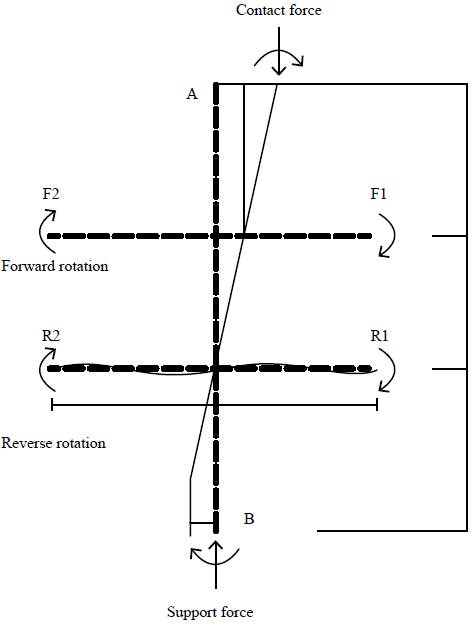
According to the above figure, in order to facilitate the analysis of the load elasticity of the gear, it is assumed that the A and B ends of gear M. buckle at the same time with the other gear M in contact with each other, and that AA' and BB' are the contact ends. At this time, the end angles of the cross section in the same layer of gear are the same size and opposite direction, that is, α A =- α A α B =- α B . It is known that the k value between the gears is the same, and the bending stiffness coefficients are both α and b. By default, the gear in the same layer buckle at the same time when losing stability. Then, according to Formula 1 and the balance condition p 1 =- λp 2 , the elastic value of the bearing capacity of the gear slot under the tooth deformation is calculated by using the angle displacement method.
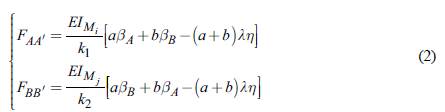
In the above formula, k represents the elastic value of bearing capacity of contact point AA', k2 represents the elastic value of bearing capacity of contact point BE', EI mi . represents the transfer force of target gear M i ,
EI mj . represents the bearing force of gear M adjacent to M i , η represents the force balance coefficient, and A represents the force control coefficient. It is known that the sum of equilibrium conditions of node A and node B is 0, and there is F AA : = -F BB :+ ΔF, that is, F AA ’ + (-Fbb') + ΔF = 0 , where ΔF is the force of other values. According to the equilibrium condition, let K = (k 1 + k 2), thus, the instability condition of gear under high strength operation is as follows:
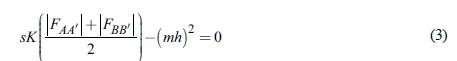
In the formula, s represents the linear stiffness of the gear under the action of external force, m represents a non-zero natural number, and h represents the constraint condition. The trigonometric function is substituted to the above formula, and
 is made to obtain the buckling equation of gear teeth and bearings:
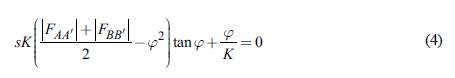
Where φ is the buckling evaluation parameter. The above equation is the elastic analysis equation of bearing capacity of gear and bearing. It should be noted that the bearing will also be affected by the horizontal load force, so under the condition of meeting the above formula, the elastic calculation expression of gear shear balance is:
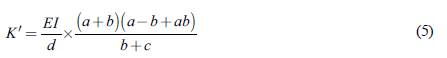
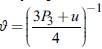
In the formula, c represents the constant of change under the influence of bending stiffness coefficient a and b, and EI force modulus. When K is greater than the specified elastic value, it means that the gear is distorted under the influence of load. Under the influence of Formula 5, the plastic value of the bearing capacity of the false gear is set as f, and when the value of f exceeds the maximum limit of the gear, the yield strength of the gear is calculated. According to the yield strength value, the critical value of functional failure of gear bearing capacity is confirmed. The basic material composition of the gear is known, and the amplification coefficient of the compressive strength of the material is calculated. The formula is:
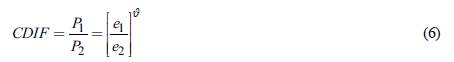
In the formula, e1 represents the strain rate and e1 ≥ 30s-1, e2 also represents the strain rate and e2= 30 X 10-6s-1; P
1
represents the dynamic compressive strength of the material under e1, P2 represents the static compressive strength of the material under e 2;
 represents the force angle under impact, wherein P
3
represents the compressive strength under the total volume of the material (Jeong et al., 2018). The increase coefficient of tensile strength is:
represents the force angle under impact, wherein P
3
represents the compressive strength under the total volume of the material (Jeong et al., 2018). The increase coefficient of tensile strength is:
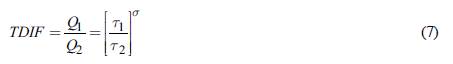
In the formula, r1 represents the strain rate under the influence of the force, τ1 ≤1s-1, τ
2
represents the strain rate under the influence of the force, and τ 2= 10-6s-1; Q
1 represents the dynamic tensile strength of the material composed of gears under τ1, Q2 represents the static tensile strength of the material under τ2; σ = 10-6n-2 represents the force angle, where
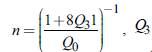 represents the standard static tensile strength that the material can bear, Q
0 Represents the static tensile strength of a variable material. By combining the Formulas 6 and 7, the yield strength calculation formula is obtained
represents the standard static tensile strength that the material can bear, Q
0 Represents the static tensile strength of a variable material. By combining the Formulas 6 and 7, the yield strength calculation formula is obtained
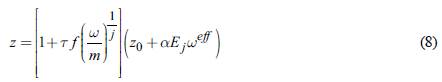
In the formula, z0 represents the initial yield stress, t represents the strain rate, ω ef represents the equivalent plastic strain, E. represents the plastic hardening modulus, α represents the hardening parameter, when α = 0 represents the follow-up strengthening, m and j represent the constants respectively. When z <0.7, it means that the frame gear can bear the current working strength, the gear is in good condition, and the bearing capacity function has not been lost; when 0.7 ≤ z ≤0.8, it means that the gear can bear the current working strength, but affected by the geological conditions, at this time, the gear has the situation of tooth section depression or external convex, and part of the bearing capacity function; when e > 0.8, it means that the gear is seriously deformed or the gear teeth are directly broken, unable to withstand the current operation, and the bearing capacity function of the gear is completely lost (Walker et al., 2018).
Extraction of gear and bearing fault features
The real-time running state of the bearing is obtained by using the monitoring system. It is known that the monitoring data will be distorted due to salt and pepper noise, Gaussian noise and reflected half point noise in the process of recording and transmission. Therefore, the bearing monitoring data is estimated by using the geometric shape analysis method and digital analysis method of mathematical concept. Through the analysis of the relationship between the elements, the bearing monitoring data is estimated, and the linear least square method is used to measure the impact of noise on the data, that is, according to the calculated minimum average variance, the monitoring background that can be fitted is determined. Therefore, the calculation formula of the fitting degree is:
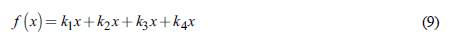
In the formula, k 1 , k2, k3 and k4 are respectively represented as the influence of background information on noise in each direction, and x is the mutation value of noise (Spartalis et al., 2018). The average variance is calculated according to the Formula 9:
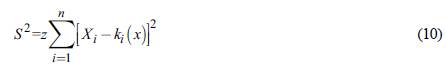
In the formula, X represents the gray value of the i-th column of the monitored data. At this time, the calculation result is the noise factor of background information in four positive directions. Due to the inaccurate fault location and calculation deviation, the information interference in other directions is corrected by information extraction, and the median filter is weighted and added. At this time, the corrected background noise estimate is:

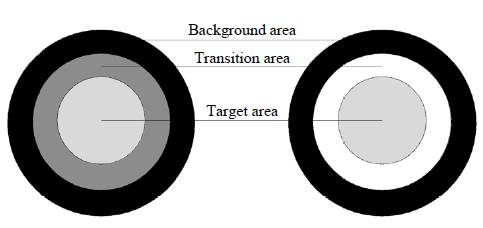
In the formula, according to the y2 value obtained by the above fitting, w represents the median filter, μ 1 and μ2 represent the weighting coefficient, and μ 1 + μ 2= 1, so as to obtain a more accurate noise background. According to this value, the interference noise is proposed, and the complete bearing monitoring data is obtained. In order to detect the defects of the pre-processing monitoring data, it is necessary to determine the fault area and segment it. According to the monitoring data, ROI is the region of interest. The bearing in this region is judged and segmented according to the result. According to the imaging principle, known bearings can be divided into three areas: the upper background area, the middle imaging area and the lower turntable area (Ganson, 2018). According to the principle of uniform direction and gray projection algorithm, the distribution rule of bearing projection is analyzed to determine the scope of fault analysis. According to the above calculation results, the gray projection on the calculation axis is:
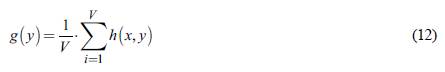
In the formula, V is the background value calculated by Formula 11, h(x, y) is the projection normal distribution function. According to the calculation results, the curve characteristics are analyzed, to determine the bearing monitoring data on the y-axis of the imaging boundary. Figure 3 is the sample space schematic diagram of the projection curve.
The two curves in the image are the constraint conditions for generating projection curves for non damaged samples, scraped samples, bumped samples and over sharpened samples. It is known that no matter what type and specification of the bearing for coal mining equipment, its projection shape is similar, the upper background area has no detection objects, and there is no effective monitoring data; the bottom area has a certain degree of fluctuation because of the problem of reflection; the middle position is the main data monitoring area of the bearing, because the bearing itself is smooth, there will be reflection phenomenon, thus, the curve of this projection will fluctuate violently. According to the above analysis results, the region ROI calculation algorithm is set up: the gray projection curve is filtered by means of mean value, and the curve is derived by smooth value, so that it passes through the zero point, and then the maximum value point and secondary value point of the curve are found out from the zero point, the abscissa is set as x 1 and x2, and (0,c1) and (0,c2) are taken as control points to establish a rectangular region, which is ROI (Liu & Zhu, 2018).
Because the image boundary of the bearing in the ROI area at this time is relatively fuzzy, which will affect the classification of defect categories, the wave value transformation segmentation algorithm is adopted to accurately segment the image area of the bearing, as shown in Figure 4.
It can be seen from the figure that there may be errors in the boundary of the segmented region. One is to divide the background into the target region, and the other is to divide the target pixels into the background region. In order to avoid such a situation, morphological processing is carried out. Morphological treatment is to expand and corrode. Expansion is to merge all the contact points of the object's contact background into the object, so that the boundary expands outwards, while corrosion is to eliminate the fictitious contact points, so that the boundary contracts inwards. The calculation process is as follows:
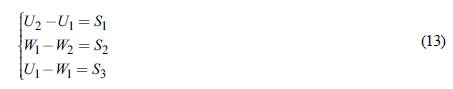
In the formula, U 1 and U2 represent the area obtained by two expansions, W and W 2 represent the area obtained by two corrosions, S 1 represents the part around the boundary that does not belong to the target range, S2 represents the area around the boundary that belongs to the target range, S3 represents the area that cannot be determined, so the area is divided into bundles. On the basis of region segmentation, the feature statistics and extraction of these data are carried out, and the rule subsets are established according to these features, so as to reduce the deposition data and improve the accuracy of fault diagnosis. The shape feature of gears and bearings in coal mining equipment is one of the important features of fault identification, so the common fault shape feature shown in Table 1 below is listed (Ali et al., 2018).
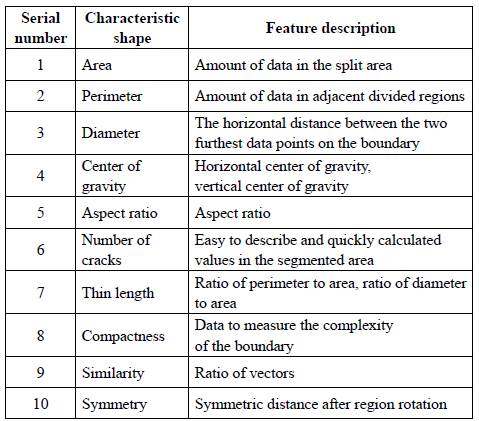
According to the data in Table 1, the bearing deformation features are extracted. It is known that the color distribution of bearings and gears is divergent under the condition of light source, light and object reflection in machine vision. Assuming that the hue is M, the saturation is D, and the brightness is R, the color distribution is calculated:
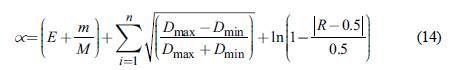
In the formula, E represents the parameters of the segmented area, and m represents the hue resolution. Through the color resolution model, the color features of gear and bearing images are obtained, and then the texture features are counted. Because the change of texture image has certain regularity, which is embodied in the attributes of density, thickness, uniformity, regularity, linearity, frequency, etc., according to these attributes, the image area is set as W(x,y), the size is i xj, and the calculation formula is as follows:
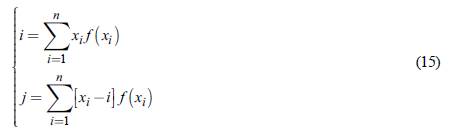
In the formula, x 1 represents the gray level series, f (xj) represents the probability function of gray level series, which is the statistical result of texture features. In the process of feature extraction, it is necessary to make the selected features meet the separability constraints, which is to be representative, so that they can not only reflect the characteristics of all aspects, but also reflect the personality of the object; secondly, the graphic features should have very strong anti-interference, so as to ensure that the influence of different lighting, light source, shape and other factors is small and stable, the feature values of image content in the segmentation region are similar, and the selected features are independent of each other. In this paper, the scale feature extraction method is used to extract data based on the statistical results of features. The image is transformed to another space by function or matrix. The transformation methods include frequency domain transformation and geometric projection transformation. The data with different functional features in feature grouping are extracted and a new feature set is established. According to this feature, the calculation results are as follows:
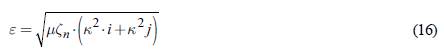
In the formula, ζn represents n shape values, k, i and j are the result statistics values of formula (2-7), so as to realize the extraction of gear and bearing fault feature data in coal mining equipment in a complex geological environment (Sayers et al., 2019).
Fault location parameters setting of the location algorithm
On the basis of defining the fault characteristics of gears and bearings, the fault location algorithm is developed according to the basic operation mode of coal mining equipment. Generally speaking, the first step is to determine the fault range of gears and bearings. Using CS technology to set up a search program, the target range of fault location is defined. The step factor is calculated, which is the key parameter to control the breadth of the search area. When the step factor is too large, the search program is controlled to start a full regional search; when the step factor is too small, the parameter can control the search program to start a local search in a local area. In order to control the search balance of the search program in the whole region and the local region, a balance adaptive adjustment parameter is added to make the search program distributed and synchronous search. The calculation formula of the step factor is:
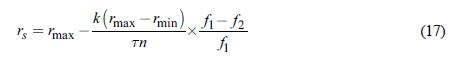
In the formula, r s represents the search step of the s-th time, where s represents the current number of times; k represents the control parameter; r max represents the maximum upper limit of step factor; r min represents the minimum lower limit of step factor; t represents the adjustment parameter introduced; n represents the maximum number of iterations; f represents the optimal function under the initial fitness; f represents the optimal function suitable for this iteration. At the same time, under the search control of this parameter, the discovery probability of the approximate location of the equipment fault is calculated. In CS technology, the discovery probability is generally between 0.2-0.3, and the probability under this parameter is set to p. When the probability is always in a large value, the convergence speed of the fault search can be accelerated; when the value of the discovery probability p is small, the convergence rate is reduced. Therefore, the optimal fitness is set by the ratio of the optimal fitness and the previous generation solution.
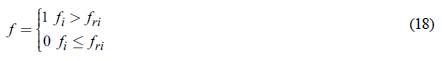
In the above formula: f i represents the optimal fitness of the previous generafion; f ri represents the fitness of the i -th solution under the action of r. According to the above calculation formula, the detection probability calculation results obtained by adjusting the adaptability of the detection probability are as follows:
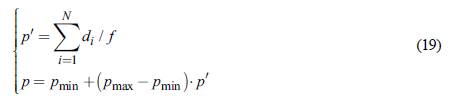
In the formula, p' represents the high-quality probability of the solution after iteration; d represents the optimal fitness for the i -th solution; N represents the total number of solutions; p min . and p max represent the upper and lower limits of the discovery probability respectively. Combining the above two sets of formulas, the search parameters are obtained, and the capture function is set by the parameters to extract the fault nodes of gears and bearings within the range of the target. According to the carrier frequency of the data, the capture function can get the code phase of the defect data and realize the acquisition of data nodes in any area. The capture times of the capture function are calculated as follows:
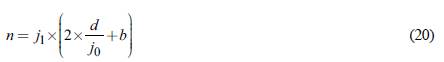
In the formula, n represents the number of acquisition times, j i represents the number of times of code phase, j0 represents the total step of wave frequency, d represents the step of wave frequency of defect data, and b represents a fixed constant, usually 1. The capture function is set according to the capture times, and the capture parameter f (x) is introduced, as follows:
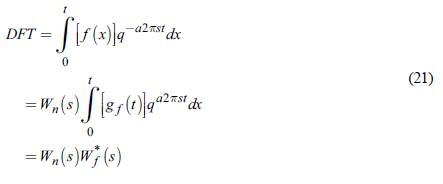
In the above calculation expressions, DFT represents the Fourier calculation result of the acquisition function under the condition of discrete transformation; q represents the degree of acquisition; x represents the independent variable of the acquisition function; q represents the exponential function; a represents the frequency of acquisition; s represents the conjugate value; t represents the target range space; g f (t) represents the real-time fault signal; W n (s) represents the fixed value*of the acquisition strength of the fault signal under n times of acquisition; W f (s) indicates the actual acquisition strength of fault data when the acquisition strength is f, * indicates the transformation flag. In the obtained defect nodes, two adjacent defect nodes are randomly selected as samples, to calculate the defect center point by distance scaling method, and the fault sample curve is selected, as shown in Figure 5 (Heffner et al., 2018).
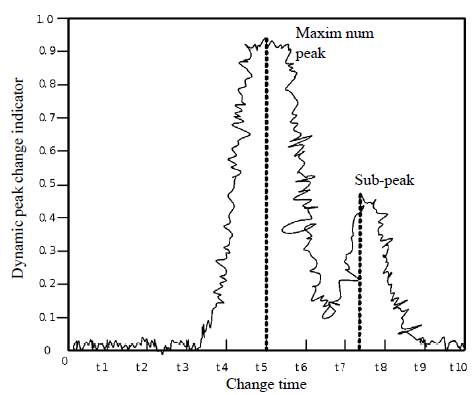
The selected fault samples need to meet the basic requirements of two peaks. The fault data of gears and bearings are "flat". Assuming that the abscissa of high peak value and sub peak value in "flat area" is x and x 2 , the center position c0 and peak width L of the area are calculated. The calculation results are shown in the following formula:
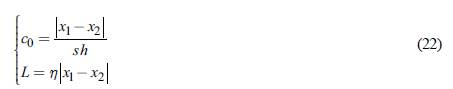
In the formula, s is the number of peaks, and s ≥ 2; h is the error correction coefficient; η is the width measurement parameter. According to the above calculation results, the distance between the fault node and the fault center position is determined. According to the real-time changing fault intensity indicator, combining Formulas 21 and 22, the random dynamic change parameter y is calculated. The formula is:
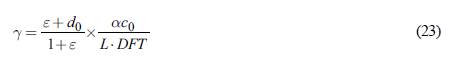
In the above formula, s is the adjustment control factor of defect peak; d0 is the adjustment factor of dynamic parameter; a is the peak active direction of the fault with different intensity; DFT is the discrete transformation parameter. The linear regression model with activation function is as follows:
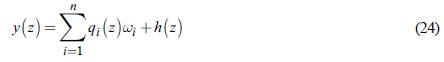
In the formula ,n is the number of multi-peak defect nodes between gear and bearing; y(z) is the expected output value; q i (z) is the calculation regression factor in the i -th fault section of gear or bearing; ωi is the connection weight between fault nodes; h(z) is the calculation residual. According to the model and the variation parameter y, the defect center is obtained
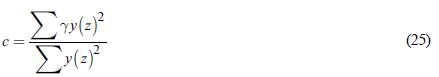
According to the obtained central coordinate position, the hardware fault edge is determined, and the specific range of fault position is obtained (Barrero et al., 2019). The boundary coordinates of the fault location are obtained by the least square method. According to the above calculation, the defect center c is obtained. Supposing there are n anchor nodes from the center. Within the determined fault target range, each coordinate can be represented by a 1 , a 2 ,...,a n . Then, for each anchor node, there is a== {(x,y) | (x1,y1),(x2,y2),...,(xn,yn)}, an unknown node is set as a j , the node coordinate is (x., y), and the node is assumed to be the true coordinate of the fault. The relationship between the unknown node and the anchor node is:
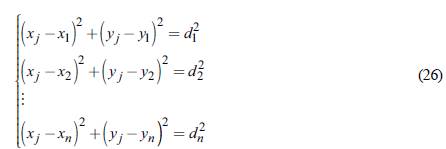
d 1 , d2,..., d n in the above formula represents the estimated distance between the unknown node and the anchor node. The coordinate boundary obtained by the formula is shown in Figure 6.
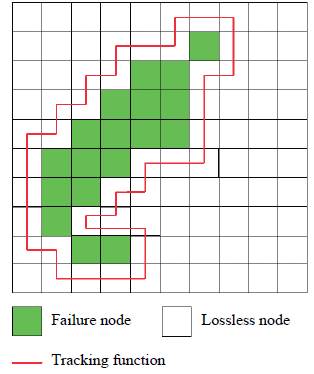
It can be seen from the above figure that the gray area in the figure represents the true range of the fault, and the white area is the location of other nodes of the equipment affected by the fault. The boundary coordinates are obtained by the least square method. The formula (3-10) is rewritten into the form of Ax = b, and the objective function Min||Ax = b||2 is obtained by using the least square method
In the formula, x 0 and y 0 represent the abscissa and ordinate of the fault boundary respectively. Through the calculation process, the specific boundary coordinates of the fault in Figure 6 above are obtained, the influence scope of the fault in the mining equipment is determined, and the diagnosis mechanism of gear and bearing fault for mining equipment is studied under complex geological conditions (Vaziri et al., 2018).
Experimental study
In this paper, a comparative simulation experiment is proposed to simulate the complex geological environment in the process of coal mining (Yang et al., 2020). Opening the simulation test software, the bearing fault effect in the coal mining equipment is simulated. Table 2 below is the fault value to be simulated and the fault frequency parameters to be input (Wu et al., 2020).
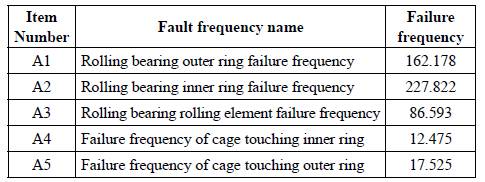
Different bearing speeds are set. When the bearing speed is too high, the gear working frequency will be too high. At this time, the bearing signal indicators that cause bearing failure and gear failure are shown in Table 3 below.
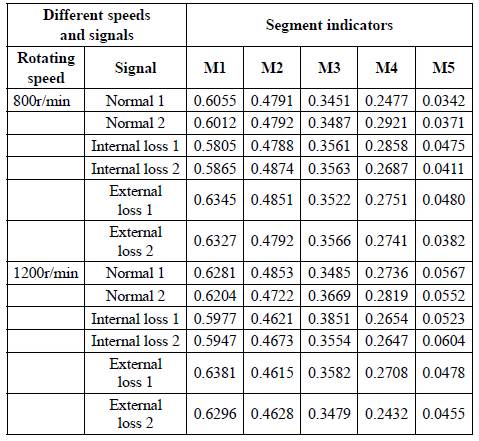
According to the data in the table above, the fault parameters of gears and bearings for coal mining equipment is simulated in a complex geological environment under high-intensity work. Two methods are used to analyze the fault diagnosis mechanism. The proposed research method is used as the experimental group, and the traditional research method is used as the control group. The test results are shown in Figure 7 (Cheng et al., 2020).
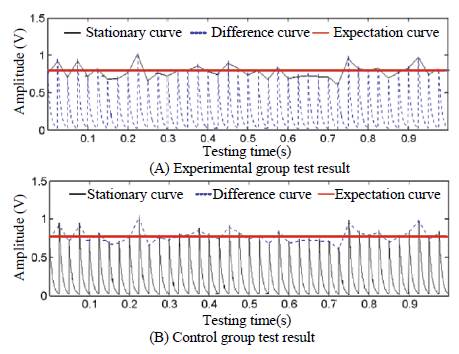
According to the curve trend in the figure above, it can be seen that the stability curve of the proposed research method is similar to the expected curve, while the stability curve of the traditional research method fluctuates violently, which is quite different from the expected curve. It can be seen that the stability difference value of the proposed research method is far lower than the stability difference value between the traditional research method and the expected curve (Gao et al., 2018).
Conclusions
In the complex geological environment, the proposed research method of fault diagnosis mechanism is more stable, which improves the reliability of diagnosis results and provides more perfect technical means for the development of national mining technology (Gao et al, 2019).

