


 English (pdf)
 Article in xml format
 Article references
 Send this article by e-mail
 Cited by SciELO
  Cited by Google
  Similars in
SciELO
Similars in
SciELO  Similars in Google
 Permalink
Introduction
Small and medium-sized landslides often occur in rock and soil slopes, most of which occur in a short time after heavy rain (Canli et al., 2018). Landslides undoubtedly pose a huge hidden danger to traffic safety. Due to the lack of understanding of the characteristics of the special regional soil and the rock soil slope composed of it, the design and construction personnel are often unable to reasonably evaluate the stability of the rock soil slope and take reasonable protection and reinforcement measures (Norouzi et al., 2019). Therefore, it is necessary to systematically study the deformation mechanism and law, stability evaluation method, protection and reinforcement of rock and soil slope.
Because the parameters used in geotechnical analysis have a certain type of fuzzy uncertainty, the uncertainty or quantity is scattered. This is due to many reasons, such as test methods, etc., people can not accurately obtain the calculation mechanical parameters needed for calculation and analysis, and the value of mechanical parameters at a certain point in the calculation model can only be given a general range, for example, the measured value of friction angle or cohesive force in the rock and soil slope can never be a fixed value (Tamate & Hori, 2018). Each experiment will lead to some data that is different from the previous values, thus showing a certain distribution in a certain range. In the past, the uncertainty (fuzziness or randomness) of each calculation parameter is eliminated according to the statistical analysis method before calculation, and a certain value is selected to evaluate the stability of rock and soil slope.
The rigid body limit equilibrium method is widely used in the stability analysis of rock and soil slope. However, due to the limitations of the method itself and the uncertainty of many factors affecting the stability of the rock slope, the results of the solution are difficult to be directly used by the engineers, and its accuracy often depends on the experience of the users (Karray et al., 2018). This results in a lot of phenomena that are judged to be stable in the calculation conditions, but in the actual situation, instability and failure occur. In view of this kind of problems, this paper studies the finite element analysis method of rock and soil slope stability. With the wide application of the finite element technology in the engineering field, the research on the application of the finite element method to evaluate the stability of the rock and soil slope has gradually increased. In these studies, all kinds of parameters are analyzed after being treated as deterministic parameters. The influence of the fuzzy uncertainty of the calculation mechanical parameters on the stress and displacement is also very significant, and the impact on the project cannot be ignored (Naderi-Boldaji et al., 2018; Xiao et al., 2018).
Due to the strong water permeability, wide particle size distribution and large pores of the accumulated gravelly soil, it is very easy to lose stability and induce landslide disaster under the action of rainfall or earthquake (Chinkulkijniwat et al., 2019; Provost et al., 2018). Therefore, it is very important to deepen the understanding of the failure mode of the rock and soil slope and analyze the stability of the rock and soil slope for the prevention and control of the rock and soil slope disaster, which has certain research value and engineering practical significance (Cao & Wen, 2019). In this paper, the fuzzy finite element method is used to study the stability of rock slope.
Design of the Finite Element Analysis Method for the Stability of Rock and Soil Slope based on Fuzzy Statistics
Establishment of numerical model of rock and soil slope
The finite element model is established based on the geotechnical slope data. The specific geometric dimensions of the geotechnical slope model are shown in Figure 1. In the simulation, it is covered with gravelly soil and phyllite. Model parameters: the slope height is 56m, the slope is about 19 °, the calculation area is 130m long, and the total height of the model is 75m.
The model boundary is a fixed constraint, i.e. the displacement in X and Y directions on the bottom boundary is 0; the left and right boundaries are roller supports, i.e. the displacement in the direction perpendicular to the boundary (normal) is zero, but the boundary can move freely in the tangent direction; the slope surface is a free boundary, and the specific boundary conditions are shown in Figure 2.
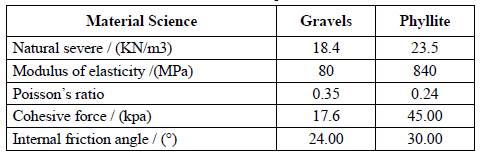
The parameters of rock and soil used for the stability calculation of rock and soil slope are determined according to the physical and mechanical test values provided in the rock and soil test report, as shown in Table 1.
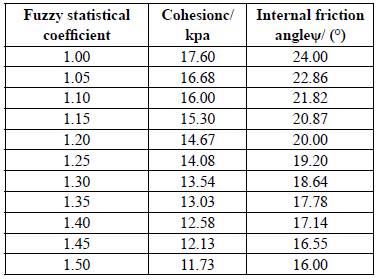
According to the statistics, the strength parameters c and φ of gravelly soil on the slope, and the change interval of fuzzy statistical coefficient is 0.05, and the statistical results are shown in Table 2.
In the finite element method, mesh generation has a great influence on convergence and solution speed. The free triangulation grid provided by COMSOL multiphysics software (Kwan et al., 2019; Bouida et al., 2018) is adopted for the geotechnical slope. The whole grid consists of 11086 triangle cells, 431 edge cells, 41 top cells, 0.5314 minimum cell mass, 0.9844 average cell mass, 0.05057 cell area ratio, 6703m2 grid area, 2.247 maximum growth rate and 1.095 average growth rate.
Calculation of the load on the slope
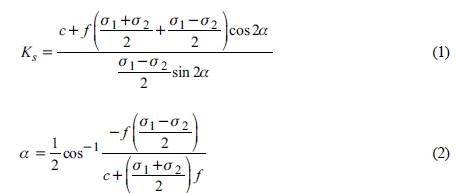
It is necessary to calculate the safety degree of the fuzzy point before calculating the load on the slope. The fuzzy point safety factor K is an index used to evaluate the safety degree of each point in the slope land. To some extent, it can reflect the local stability of the slope. The fuzzy limit equilibrium method can be used to study the fuzzy evaluation of the overall stability of geotechnical slope (Sajjad et al., 2018). The safety factor K of fuzzy point is a ratio of fuzzy stress and shear strength of rock and soil. According to the Mohr Coulomb criterion, the calculation formula of point safety factor is:
In the calculation of anti slope stability, because the structure of rock and soil slope has no bottom, the soil in the slope cannot participate in the anti slope work. According to the research results on the structure of rock and soil slope, 70% of the weight of soil in the slope can be taken as the effective weight of anti slope stability, then the expression of gravity G is:
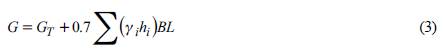
Where: G T is the weight of the slope, y i and h i are the weight and depth of the i layer soil in the slope, B is the width of the simplified structure, and L is the distance between the centerline of the rock soil slope structure and the centerline of the subgrid bin.
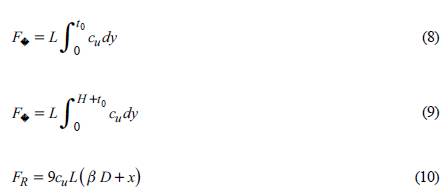
It is assumed that the earth pressure on both sides of the slope will reach the limit value when the immersed rock soil slope structure reaches the ultimate failure state. According to the analysis in 1.1, the active earth pressure on the landside of the slope is multiplied by the Rankine active earth pressure resultant force on the imaginary vertical plane by the fuzzy statistical coefficient of 0.75, and the passive earth pressure on the sea side of the slope is multiplied by the Rankine passive earth pressure resultant force on the imaginary vertical plane by the coefficient of 1.2. The specific expression is:
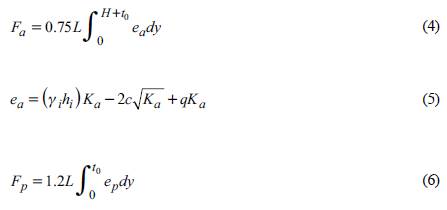
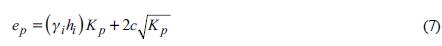
In the formula, H is the height of the non embedded part of the slope, /0 is the depth of the slope, e a and e p are the active earth pressure and passive earth pressure values at a certain depth, F a and F p are the active and passive earth pressure resultant values of the wall, y i and h i are the weight and depth of the soil in the i layer, L is the distance between the centerline of the geotechnical slope ground structure and the centerline of the sub compartment.
According to the American api code, the friction force f of soft clay to the unit area of rock soil slope is not greater than the undrained shear strength c u of soft clay; the maximum end resistance stress (soil reaction at the bottom of slope) is 9cu.
Assuming that when the rock soil slope structure reaches the ultimate failure state, the side friction and bottom reaction of the slope body reach the limit value, then:
Among them, the value of c u is derived from the shear strength formula and c and φ. At a point where the depth from the ground is y, the undrained shear strength of soft clay is:
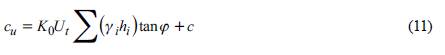
Where: Σ(yi h i ) is the weight of all soil layers from above y to the ground, and the meaning of other symbols is the same as before.
At the depth of slope bottom, the undrained shear strength of soft clay is:
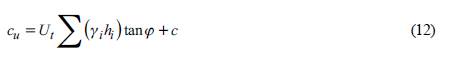
Where: Σ(yi h i ) is the weight of all soil layers above the slope bottom, and other symbols have the same meaning.
In the formula, c is the cohesion of rock mass; f is the friction coefficient σ 1 of rock; σ 2 is a positive value at compressive stress.
Finite element analysis of the stability of rock soil slope
The key factor to determine the stability of rock soil slope is the embedment of foundation soil. In the limit state, it is considered that the actual shear stress produced by the external load of rock soil slope is equal to the minimum shear strength that the soil can play to resist the external load, that is, when the actual strength index of soil is reduced continuously until reaching the ultimate failure state, the shear strength of soil is equal to the external load The strength of shear stress produced by loading is equal. The ultimate failure state of rock soil slope can be simulated by weakening the strength of soil. Especially for the geotechnical slope structure, the external load it bears is complex, including the wave force, the earth pressure generated by the filler behind the wall, the earth pressure generated by the variable load on the wharf surface, the residual water pressure caused by the water level difference, the stacking load, the flow mechanical load and other ground service loads (Saneie et al., 2018). At the same time, in the stability analysis of geotechnical slope structure, the load combination under various adverse conditions must be considered. Therefore, by using the fuzzy statistical method, the stability and safety factor of the structure can be obtained simply by weakening the strength parameters of the soil and simulating the instability and failure of the rock soil slope structure.
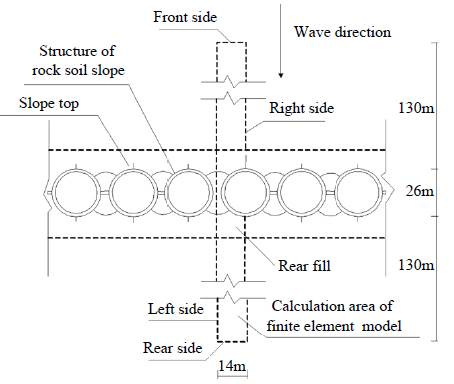
In this paper, the fuzzy statistical method is used, and the large-scale finite element analysis software is used ABAQUS, a three-dimensional elastic-plastic overall analysis model of interaction between rock soil slope structure and soil mass is established. The basic contents include: selection of model calculation domain, model boundary conditions, selection of model calculation unit, constitutive model of structure and soil mass, model of contact surface between soil mass and structure, simulation of initial stress field of foundation, etc. (Kundu et al., 2018). Taking the structure of rock and soil slope as an example, the typical plan and section of the structure are shown in Figure 3 and Figure 4 respectively.
The structure of rock and soil slope is formed by a series of continuous arrangement of slopes, with arcade walls and obvious spatial bearing characteristics. When the action direction of wave load is perpendicular to the wall axis of the structure, the structure is symmetrical about the plane parallel to the action direction of wave force. Therefore, for the convenience of analysis, it is assumed that the action direction of wave load is perpendicular to the wall axis of rock soil slope structure. Using the spatial symmetry of load and structure, half of a slope and a certain range of soil before and after the wall axis are taken as the area to establish the finite element model, and symmetrical boundary conditions are set on the symmetrical boundary. Among them, the calculation domain of soil mass is: in the direction perpendicular to the wall axis, take the area within 5 times of the diameter of the geotechnical slope on both sides; in the direction of the structural depth of the geotechnical slope, take the area within 3 times of the depth of the slope below the slope (Chiorescu et al., 2019). The calculation domain plan of the overall model is shown in Figure 5.
In the setting of boundary conditions in the finite element calculation domain, the influence of boundary conditions on the finite element analysis domain should be reduced as much as possible. Therefore, in the finite element analysis model of geotechnical slope structure, the basement surface is fixed boundary, the surface is free boundary, the left and right sides are symmetrical boundary, the front and rear sides are side boundary (Cifuentes et al., 2019).
Generally, the structure of rock soil slope is made of steel. The strength and rigidity of the structure are far greater than that of the soil. The displacement and instability of the whole model system mainly depend on the deformation and bearing capacity of the foundation soil. Therefore, in the overall analysis model, the slope structure is simulated by elastic model, while the constitutive model of the soil is simulated by ABAQUS Mohr Coulomb model in finite element analysis software is used for simulation (Kalateh, 2019).
For the three-dimensional elastic-plastic finite element model, due to the existence of soil with incompressible plastic deformation, which to some extent limits the choice of model element type. In order to avoid over constraint and reduce calculation cost as much as possible, eight node three-dimensional reduced integral solid element is used for soil and rock slope structure elements in this paper.
In order to simulate the phenomenon of adhesion, slippage and separation between soil and rock slope structure under the action of wave force, residual water pressure, stacking load and other external loads, a master-slave contact surface is set up in the area where the structure contacts the soil. Considering that the elastic modulus of the structure is far greater than the elastic modulus of the soil, the contact surface on the structure is designated as the main contact surface, and the contact surface on the soil is from the contact surface. The normal direction of the contact constitutive model is hard contact, and the tangential direction is Coulomb friction constitutive model. According to the American api code, it is set that the friction between cohesive soil and slope wall per unit area f is not greater than the undrained shear strength c of clay (Talesnick, 2013).
According to the principle of fuzzy statistics, the stability analysis steps of rock soil slope structure under various external load combinations are as follows:
Step 1: Establish an elastoplastic three-dimensional finite element analysis model of interaction between rock soil slope structure and soil mass;
Step 2: According to the actual situation of the project, calculate the external load of the geotechnical slope structure, and according to its load distribution form, set the corresponding load distribution in the finite element analysis model to solve the stress and displacement of the soil and structure system under the design load;
Step 3: The strength parameters (including cohesion φ and tangent value tan p of internal friction angle) of all soils in the overall finite element analysis model are calculated step by step to solve the stress and displacement of soil and structure system under the corresponding soil strength until the finite element calculation does not converge;
Step 4: Draw the relationship curve between the fuzzy statistical coefficient of soil strength parameters and the structural displacement;
Step 5: Determine the criteria of structural instability;
Step 6: according to the criteria of structural instability, the strength reduction coefficient corresponding to structural instability is determined, which is defined as the safety coefficient of structural stability of geotechnical slope (Chen et al., 2019; Feng et al., 2019).
Comparative Analysis of Experiments
Construction of experimental model
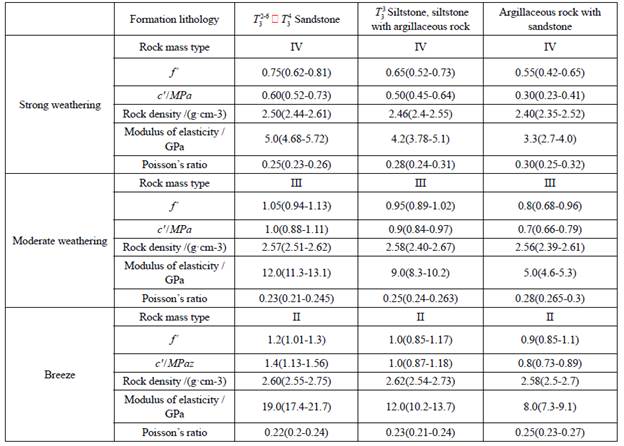
The stratum of the slope is from Triassic to Jurassic, in which Triassic is a set of thick to very thick sandstone, mainly siltstone and fine sandstone, with weak argillaceous rock and soft hard inter bedded rock group of coal line; Jurassic is a set of soft rock with hard rock group of siltstone and mudstone as main inter bedded sandstone. The artificial high rock and soil slope is 1300.0m long, with the maximum excavation elevation of 425.00m and the maximum slope height of 150.0m. In order to study the artificial high rock slope of the ship lift section on the left bank of Xiangjiaba, the uncertainty analysis of plane stress and plane deformation of typical section 4 (maximum section height) is carried out by using the fuzzy finite element theory. The finite element mesh of rock slope is shown in Figure 6.
The physical and mechanical parameters of rock mass are shown in Table 3. The values outside the brackets in the table are calculated parameter values based on the statistical mean, while the values inside the brackets are the range values of each physical quantity.
Boundary conditions: the left and right boundaries of the experimental model are respectively constrained by the horizontal X-direction hinge displacement, and the lower boundary of the model is constrained by the vertical Y-direction hinge displacement, forming the displacement boundary conditions. Quadrilateral 4-node element is used for calculation.
Load condition: self weight, excavation unloading.
In order to simulate the excavation and unloading of rock and soil slope, loading is carried out in two steps. Firstly, the natural rock and soil slope before excavation is discretized, and the whole model is discretized into 1372 nodes and 1294 units. After the calculation, the node forces on the excavation boundary are reversely applied on the corresponding nodes of the calculation grid after excavation to simulate the unloading process in the excavation area of rock and soil slope. After excavation, there are 1255 nodes and 1178 elements in the finite element model. During the experiment, it is considered that the displacement under the action of self weight has been completed, so the displacement caused by excavation is only the displacement caused by unloading of the slope, that is to say, when calculating the deformation caused by excavation of the slope, the displacement under the condition of self weight is deducted, and the stress state caused by self weight is retained.
Test steps
The following simplified calculation method is established for the structure of rock and soil slope, and the solution process is realized by FORTRAN programming language:
Step 1: Set the stability safety factor value K required by the geotechnical slope structure;
Step 2: according to the basic principle of the finite element strength reduction method, the strength parameters c and φ of all soils are reduced to the soil parameters c' and φ' under the condition of the stability safety factor, and are substituted into the load calculation formula;
Step 3: combine the equation and the calculation formula of reaction F R at the bottom of slope to find the depth of rock and soil slope that meets the set safety factor:
A. Let x 0 = 0, solve the equation, and get the initial value /0 of the depth of the slope.
B. From (1) the t0 value is used to solve all the load values, and the equation is used to get the reaction value of rock soil slope;
C. The F R value obtained from (2) is used to calculate the distance x between the turning point and the centerline by the following formula:

D. According to the relationship between x and x 0 , the x 0 value under the condition of meeting x obtained in (3) is obtained, which is:
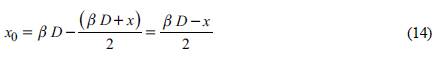
If |x' 0 -x 0| < ε and ε are given accuracy requirements, calculation will be stopped; otherwise, continue to the next step.
E. Let
 , solve the equation, and obtain the value t
0
of the depth of the slope under this condition. Continue (2) and the following steps until the end of the calculation.
, solve the equation, and obtain the value t
0
of the depth of the slope under this condition. Continue (2) and the following steps until the end of the calculation.
At this time, the calculated t 0 is the depth of the rock slope to meet the set stability safety factor value, and x is the distance between the turning point of the rock slope and the central axis.
Analysis of experimental results
A. Analysis of the characteristic values of fuzzy stress and fuzzy displacement at the measuring points of geotechnical slope
Figure 7 is a schematic diagram of the location of geotechnical survey points. See Table 4 for the characteristic value of stress and displacement at the geotechnical survey point.
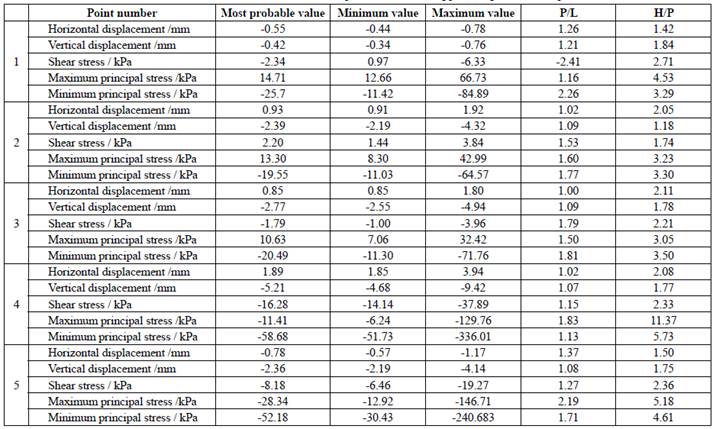
It can be seen from Table 2 that due to the complexity of the geometric boundary of the experimental section and the fuzziness of the material, the distribution state of the earth stress and displacement of the rock slope may change greatly. When the fuzziness of materials is small, that is, the value of mechanical parameters of materials is close to the most possible value (mean value), and the deviation of calculation results is small. When the fuzziness of materials is large, that is, the value of mechanical parameters of materials is far from the most possible value (mean value), and the deviation of calculation results is large. The ratio of possible value to minimum value (P / L) and the ratio of maximum value to possible value (H / P) in Table 2 show this one o'clock. Table 2 shows that the deviation of the maximum principal stress can reach 11.37 times. The calculation also shows that the change of the position shift of the rock slope caused by the fuzziness of the rock slope material is smaller than the change of the earth stress of the rock slope. The ratio of the maximum to the possible value (H / P) is less than 2.0, and the ratio of the maximum to the possible value (H / P) is more than 2.0. It can be seen that the fuzziness of rock and soil slope material has a great influence on the stress estimation of rock and soil slope.
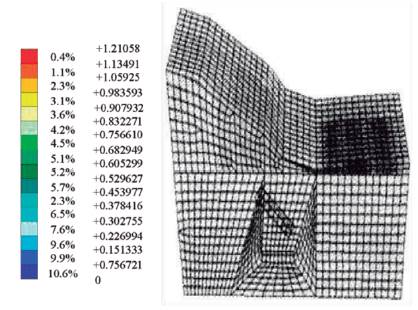
B. Fuzzy displacement analysis of excavated slope
Figure 8-11 shows the contour map for calculating the displacement of rock slope.
Due to the high level of membership (0.8, 0.9, 1.0), it can be found that the distribution of horizontal displacement and vertical displacement are basically the same under the condition of excavation and unloading. The horizontal displacement of the slope shows an inward movement above 320m and an outward movement below 320m. The displacement model of rock slope is suitable for the material composition of rock mass and the geometric properties of material interface. Due to the formation of the free surface at the foot of the slope, the downward vertical displacement occurs after unloading. The displacement of rock and soil slope caused by excavation and unloading is small, and its magnitude is millimeter. The maximum value of vertical displacement under different membership levels appears at the top of the slope, and the value of vertical displacement gradually decreases from top to bottom. The maximum value of horizontal displacement under different levels of subordination degree generally appears on the rock slope excavated at the elevation of 450 M.
Conclusions
In this paper, based on fuzzy statistics, the finite element analysis method of rock and soil slope stability is proposed. The two-dimensional finite element analysis method of rock slope stability is established by introducing the fuzzy statistical method. Based on the principle of quasi-static method and with the help of the finite element software COMSOL multiphysics, the stability of rock and soil slope of gravel soil accumulation under different seismic acceleration is studied. By analyzing the displacement, plastic zone and safety factor of the rock soil slope, the stability of the rock soil slope is analyzed. The research results show that the fuzziness of mechanical parameters of rock and soil slope will lead to the fuzziness of position displacement and stress analysis results of rock and soil slope, and the analysis of rock and soil slope with the method of fuzzy finite element analysis can increase the comprehensive understanding of position displacement, stress and safety of rock and soil slope by engineers and technicians, and reduce the stability evaluation of rock and soil slope caused by the fuzziness of calculation parameters price risk.

