


 English (pdf)
 Article in xml format
 Article references
 Send this article by e-mail
 Cited by SciELO
  Cited by Google
  Similars in
SciELO
Similars in
SciELO  Similars in Google
 Permalink
Introduction
Water resources are an important material basis to support the development of human society. It is the most widely impact factor in nature. At the same time, it is irreplaceable and limited (Li et al., 2018). With the geometric expansion of the world population, the demand for water resources in people's daily life and industrial and agricultural production has changed greatly in quality and quantity. The shortage of water resources, water pollution and low utilization rate of water resources have been paid more and more attention. People realize that the problem of water resources not only restricts the sustainable development of social economy, but also threatens the survival of human beings (Menhas et al., 2019). Therefore, the theory of water resources carrying capacity based on the principle of sustainable development should come into being. The research on water resources carrying capacity can be used as a tool to judge whether the regional water resources supply and social development are in a coordinated state, and also can provide certain reference for scientific management of water resources (Chenini et al., 2019).
Zhu et al. (2019) proposed to increase the water storage capacity of the reservoir as a separate index, used a cloud model to calculate the water resources carrying capacity of Hubei Province, and used the Dematel method to determine the importance of reservoir water storage. Finally, the degree of obstacles was considered to explore the main factors affecting the water resources carrying capacity of Hubei Province. In Liu et al. (2019) Yichang city was taken as an example, and based on the comprehensive evaluation of the carrying capacity of the "Water resources- Social economy- Ecological environment" composite system in Yichang city from 2005 to 2015, the GM (1,1) grey prediction model was used to predict the water resources carrying capacity in 2020, 2025 and 2030. Based on the analysis of the uncertainty of the forecast results in the future level year, the sustainability of the socioeconomic development model of Yichang City under four scenarios was discussed, combining with the strictest water resources management system and river length system. Jia and Long (2018) used conventional trend method to evaluate water resources carrying capacity of Zhongshan City, constructed SD system model of water resources carrying capacity, and compared and analyzed water resources carrying capacity under conventional development mode and different policy development scenarios. Guo (2020) aimed at the problems of long time-consuming and low accuracy of prediction results of traditional prediction systems for regional water resources sustainable carrying capacity, a new prediction system of regional water resources sustainable carrying capacity was designed based on big data technology. The system hardware was composed of four parts: general control layer, subsystem function layer, subsystem function layer and system support function layer. At the same time, real-time monitoring module, information management module, decision support module and remote control module were introduced. The software display field was designed by using the display button and exit button. Through system initialization, sample data reading, sample internal zero matrix definition, the proportion of each index was calculated, and the software process was composed of the output of sustainable water resources carrying capacity.
The artificial neural network method has a wide range of adaptability, learning ability and mapping ability. It can approach any nonlinear function in theory, and can usually obtain satisfactory results in the modeling and prediction of multivariable nonlinear systems. Because the above methods in references only consider some useful information, lack of overall understanding, and the conditions of prediction methods have certain limitations, in order to further accurately predict water resources carrying capacity, this paper proposes a new prediction method of regional water resources carrying capacity based on an artificial neural network. The main work of this paper is described as follows:
(1) Zhaozhou County is selected as the research area of water resources carrying capacity prediction;
(2) Through water resources system evaluation index, social system evaluation index, economic system evaluation index and ecological environment system evaluation index, the evaluation index system of water resources carrying capacity is constructed, which truly reflects the relationship between supply and demand of water resources, social and economic development level and regional ecological environment, and then makes a reasonable judgment on the strength of regional water resources carrying capacity;
(3) Through the analysis of the definition and calculation formula of each index, the classification accuracy of evaluation index grading standard is improved;
(4) According to the evaluation grade standard of water resources carrying capacity, the BP neural network model is more applicable;
(5) The neural network model is used to predict the water consumption. The results show that the prediction accuracy of this method is high, and has good effectiveness and practicality.
Overview of the study area
Zhaozhou County is located in the southwest of Heilongjiang Province, the center of Songnen Plain, the North Bank of Songhua River, close to Daqing Oilfield. The geographical coordinates of Zhaozhou County are 124 ° 48 ' 12 " - 125 ° 48 ' 03 " E and 45 ° 35 ' 02 " - 46 ° 16 ' 08 " N. The county covers an area of 2445 km2, with a cultivated land area of about 2.22 million mu and a vast grassland area of 850000 mu. Zhaozhou County now governs 6 towns (Zhaozhou Town, Erjing Town, Fengle Town, Yongle Town, Chaoyanggou Town, Xingcheng Town), 6 townships (Yushu Township, Chaoyang Township, Xinfu Township, Shuangfa Township, Tuogu Township, Yongsheng Township), 2 pastures (Star pasture and Paradise pasture), 104 administrative villages and 732 natural villages.
Topography
Zhaozhou County is located in the hinterland of Songnen Plain. There are no rivers passing through the county. There are a small number of wetlands and small marshes in some low-lying areas. The surface water resources are small, and there is no railway for the time being. However, the highway traffic is relatively developed. The higher terrain area of Zhaozhou County is Changwu highland in the northeast. The terrain gradually decreases from the south and west of Changwu highland. The altitude of the territory is about 118-232m, the average altitude of the agricultural production area is about 167m, the elevation of the southern and western border area is about 130m, and the ground slope is generally between 1-10 degrees.
The county covers an area of 2445 km2, with 2.22 million mu of cultivated land, accounting for 60% of the total area. The grassland area is 850000 mu, accounting for about 23% of the total area. The length of the north-south direction is about 77km, and the width of the east-west direction is about 72km. The terrain is flat. There has never been a flood disaster in history.
Climatic characteristics
Zhaozhou County is located in a high latitude area, belonging to the mid temperate continental monsoon climate, with short spring and less rainfall, high temperature in summer but abundant rainfall, cool and moderate temperature in autumn as well as cold and dry climate in winter.
Zhaozhou County belongs to the first accumulated temperate zone of Heilongjiang Province, with an annual sunshine duration of 2900 hours and abundant light and heat resources. The annual average active accumulated temperature is about 2800 °C and the frost free period is about 143 days. In Zhaozhou County, the temperature changes greatly in spring, summer, autumn and winter. The extreme high temperature in summer reaches 38.1 °C, the extreme low temperature in winter reaches - 35.3 °C, and the annual average temperature is 4.2 °C.
Socio-economic profile
The total population of Zhaozhou County is 431387, including 82970 urban population, 348417 agricultural population and 158173 households. According to the registered residence population, the urbanization rate is 19.23%.
The main food crops in Zhaozhou County include rice, corn, soybean, etc. The economic crops include sugar beet, garlic, oil, sunflower, melon and vegetable, hemp and flue-cured tobacco. The total sown area of crops is 150100 hm2, the effective irrigation area is 66900 hm2, and the construction of ecological high standard farmland is 10000 mu.
Surface water resources
Surface water quantity Underground water quantity
There is no natural river passing through Zhaozhou County, and most of the surface water resources are supplied by rainfall. The surface runoff only occurs in the rainy season of a wet year with large rainfall, and limited by many conditions, the surface water resources that can be developed and utilized are less.
According to the evaluation report of surface water resources in Heilongjiang Province, Zhaozhou County is located in the low runoff value area of Heilongjiang Province. The annual average annual runoff depth is 25.53mm, the average annual surface water resources is 60 million m3, and the available runoff is 40 million m3. The average annual rainfall is 456.15mm. The minimum precipitation was 236.4mm in 2001 and 696.4mm in 1981, with a frequency of 1.3% and a corresponding runoff depth of 95mm. About 82% of the annual precipitation in Zhaozhou County is mainly concentrated in June, July, August and September, and the precipitation in other months is less. The total annual inflow of the North main drainage channel is 43.13 million m3, including 16.15 million m3 in Zhaodong city and 22 million m3 in the West main drainage channel.
Groundwater resources
The aquifers in Zhaozhou County are mainly composed of Quaternary Harbin formation, Lindian formation confined aquifer, Qiqihar formation phreatic aquifer, tertiary Daan formation and Cretaceous Mingshui formation confined aquifer.
The characteristics of different aquifers also have certain differences. The lithology of aquifers mainly includes sand gravel and Quaternary pore phreatic aquifer. Due to the characteristics of thin sand layers, uneven distribution, weak water yield and great difficulty in mining, centralized mining can not be carried out. However, the tertiary and quaternary confined aquifers in the lower part of the aquifer are characterized by large sand thickness and wide distribution. It can be used as the main mining layer for people's daily life, agricultural irrigation and industrial production water. According to the equilibrium method and pumping test method, the exploitable amount of confined water and phreatic water in Zhaozhou County is 63 million m3 / year and 30.6 million m3 / year respectively.
Total water resources
The total amount of water resources is equal to the sum of surface water resources and groundwater resources. However, under the action of natural water cycle, there is a mutual recharge relationship between surface water and groundwater, and there is a part of repeated calculation between them. Therefore, the repeated calculation amount of surface water and groundwater should be subtracted when calculating the total amount of water resources. The calculation formula is as follows:

Where: W total is the total amount of water resources; WSurface water quantity is the amount of surface water resources; WUnderground water quantity is the amount of groundwater resources; WRepetition quaritity represents the amount of repeated calculation between surface water and groundwater.
According to Daqing statistical yearbook, the statistics of water resources in Zhaozhou County over the years are shown in Table 1. It can be seen from Table 1 that the total amount of water resources in Zhaozhou County will change greatly from 134 million m3 in 2010 to 294 million m3 in 2019. Among them, the surface water resources have been relatively stable, maintaining below 100 million m3, reaching the highest value of 209 million m3 between 2010 and 2019 in 2013, indicating that the surface water resources in Zhaozhou County are quite scarce.
Table 1 Statistics of water resources in Zhaozhou County over the years
| Particular year | Total water resources | Surface water resources | Ground water resources | Repeated calculation of surface water and groundwater | Annual precipitation (mm) | Water production coefficient | Calculation unit area (km2) | Water production scale (10000 m2 / km2) |
|---|---|---|---|---|---|---|---|---|
| 2010 | 1.34 | 0.4 | 0.94 | 0 | 283.2 | 0.19 | 2445 | 5.5 |
| 2011 | 1.24 | 0.3 | 0.94 | 0 | 328.1 | 0.19 | 2445 | 5.07 |
| 2012 | 2.01 | 0.59 | 1.4 | 0 | 408.1 | 0.2 | 2445 | 8.21 |
| 2013 | 2.09 | 0.61 | 1.48 | 0 | 431 | 0.2 | 2445 | 8.53 |
| 2014 | 2.07 | 0.61 | 1.46 | 0 | 427.1 | 0.2 | 2445 | 8.48 |
| 2015 | 1.37 | 0.43 | 0.94 | 0.15 | 468.8 | 0.12 | 2445 | 5.6 |
| 2016 | 2.66 | 0.68 | 2.05 | 0 | 465.6 | 0.24 | 2445 | 11.18 |
| 2017 | 3.32 | 0.73 | 2.59 | 0 | 587.7 | 0.23 | 2445 | 13.38 |
| 2018 | 2.67 | 0.68 | 1.99 | 0.68 | 452.2 | 0.24 | 2445 | 10.94 |
| 2019 | 2.94 | 0.71 | 2.23 | 0 | 507 | 0.24 | 2445 | 12.03 |
Construction of evaluation index system of water resources carrying capacity in Zhaozhou County
At present, the research on water resources carrying capacity has been continuing, and various theories, concepts and research methods have also been emerging, but a complete theoretical system has not yet been formed.
Evaluation index of water resources carrying capacity
There are many factors that affect the carrying capacity of regional water resources. The importance and influence of indexes, regional development trends and data acquisition should be considered in the selection of specific indexes of each system. According to the establishment principle of the above index system and combined with the specific situation of Zhaozhou County, the evaluation indexes are selected as follows: the available amount of water resources per unit area (10000 m3 / km2); the available amount of water resources per capita (m3); the development and utilization degree of groundwater resources (%); and the population density (person / km2); urbanization rate (%); natural growth rate (%); rural per capita water consumption (L / (day • person)); urban per capita water consumption (L / (day • person)); per capita grain occupation (kg / person); per capita GDP (10000 yuan / person); cultivated land irrigation rate (%); water consumption of 10000 yuan GDP (m3 / 10000 yuan); the proportion of added value of primary industry in GDP (%); the proportion of the added value of three industries in GDP (%); GDP growth rate (%); ecological environment water consumption rate (%); forest coverage rate (%). These indexes can reflect the relationship between supply and demand of water resources, socio-economic development level and regional ecological environment in Zhaozhou County, and then make a reasonable judgment on the strength of regional water resources carrying capacity.
Definition and calculation formula of each index
Based on the comprehensive analysis of the relationship among different factors affecting water resources carrying capacity in Zhaozhou County, referring to the evaluation results of water resources carrying capacity in other similar areas, according to the selection principle of evaluation index system, 17 single indexes are selected. The connotation and calculation method of each single index are described as follows.
Evaluation index of water resources system
(1) Water resources per unit area (Cheng et al., 2018) (10000 m3 / km2): water resources per unit area refers to the ratio of the total water resources in the current year to the total land area of the region. The index reflects the abundance of natural water resources in this area. The larger the index value is, the richer the water resources in the region are. It has a certain reference value for measuring the water shortage in this area.

(2) Per capita water resources occupation (Hu et al., 2019) (m3): per capita water resources occupation refers to the ratio of the total regional water resources to the total regional population. To a certain extent, the index can truly reflect the relative abundance of water resources in the region, and is an evaluation of the actual utilization effect of regional water resources.

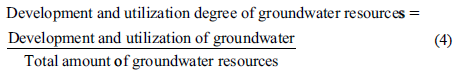
(3) Development and utilization degree of groundwater resources (%): the development and utilization degree of groundwater resources refers to the percentage of groundwater resources development in the total amount of groundwater resources in the region. The index is a reverse index. The more the index value is, the greater the potential of groundwater development and utilization is.
Evaluation index of social system
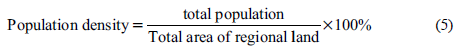
(1) Population density (person / km2): population density refers to the number of people per unit land area. This index can measure the population distribution of a region and reflect the population pressure of unit land area truthfully.
(2) Urbanization rate (Xu et al., 2020) (%): urbanization rate refers to the proportion of urban population in the total population in the region. This index can reflect the level of social and economic development, the living standard of residents and the quality of population.

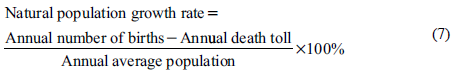
(3) Natural growth rate (%o): the natural growth rate is generally the ratio of the number of births minus the number of deaths in the current year and the average total population in the same period, expressed in thousands. The natural growth rate of population is an index reflecting the natural growth of population. The change between birth rate and mortality rate directly affects the increase or decrease of natural growth rate of the population.
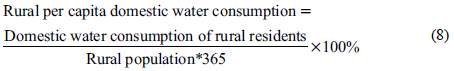
(4) Rural per capita domestic water consumption (L / (day • person)): the rural per capita domestic water consumption refers to the ratio between the total domestic water consumption of rural residents and the total rural population. This index can reflect the living water level of rural people in the whole region.
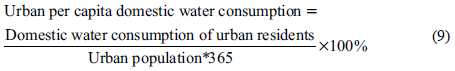
(5) Urban per capita domestic water consumption (L / (day • person)): urban per capita domestic water consumption refers to the ratio of the total domestic water consumption of regional urban residents to the total urban population. This index can reflect the living water level of urban people in the whole region.
(6) Per capita grain occupation (kg / person): the per capita grain occupancy refers to the ratio of the total grain production and the total population in the region in the current year. This index can reflect the level of people's life in the region as a whole.

Evaluation index of economic system
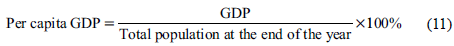
(1) Per capita GDP (10000 yuan / person): per capita GDP refers to the ratio of the GDP of the region to the total population at the end of the year. This index can measure regional economic development.
(2) Farmland irrigation rate (%): farmland irrigation rate refers to the ratio of irrigation area to total cultivated land area, which can reflect the actual situation of regional agricultural development.

(3) Water consumption per 10000 yuan GDP (m3 / 10000 yuan): the water consumption per 10000 yuan GDP is the ratio of the total annual GDP to the total water consumption in 10000 yuan. The index can reflect the regional industrial structure, economic development level and water-saving measures to a certain extent. At the same time, it can also reflect the coordination of regional economic development and water resources.

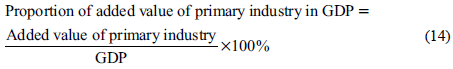
(4) The proportion of the added value of the primary industry in GDP (%): the proportion of the added value of the primary industry in GDP is the ratio of the added value of the primary industry to the annual GDP in this year. The primary industry is the core and foundation of national economic development. This index is the foundation of the whole social economy, and it is related to the healthy operation of economic development.
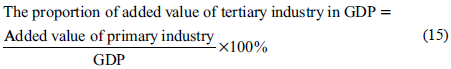
(5) The proportion of the added value of the tertiary industry in GDP (%): the proportion of the added value of the tertiary industry in GDP is the ratio of the added value of the tertiary industry to the GDP of the current year. The index can reflect the level and stage of regional economic development.
(6) GDP growth rate (%): GDP growth is the ratio of GDP added value of this year to GDP of last year.

Evaluation index of ecological environment system
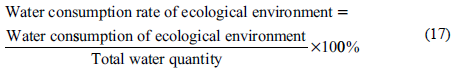
(1) Ecological environment water consumption rate (%): ecological environment water consumption refers to the minimum water consumption required to ensure the benign cycle of the ecosystem. Ecological environmental water use rate refers to the ratio of water consumption allocated to the ecological environment to total water consumption.
(2) Forest coverage (%): forest coverage refers to the ratio of forest area to regional land area. The index reflects the regional forest vegetation coverage and is an important index to reflect the operation of the ecosystem as a whole.

Determination of privacy classification criteria
In order to reflect the state of regional water resources carrying capacity scientifically, reasonably, accurately and objectively, the pressure degree of water resources carrying capacity is divided into five grades according to the importance and correlation degree of the above evaluation indexes to the evaluation of regional water resources carrying capacity, and referring to the grading standards of water resources carrying capacity designed by other similar areas, the pressure degree of water resources carrying capacity is divided into five grades, respectively, V1, V2, V3, V4 and V5. From V 1 to V5 means that the carrying capacity of water resources is gradually becoming fragile.
Where: V 1 means that the regional water resources carrying capacity is strong, the regional water resources are relatively rich and the degree of development and utilization is low, which can meet the demand of regional social and economic development for water resources, and the water resources supply situation is good.
V2 indicates that the carrying capacity of regional water resources is strong. The regional water resources supply and development have reached a certain degree, but there is still a large space for development and utilization.
V3 indicates that the carrying capacity of water resources is medium, and the carrying capacity of water resources is in a medium level, and the water resources and social economy are in a state of coordinated development.
V4 indicates that the carrying capacity of water resources in the region is light and weak, which is close to the critical value, and the potential for development and utilization is small. In the long run, problems such as water shortage and water pollution will occur.
V5 indicates that the carrying capacity of water resources in the region is weak, indicating that the carrying capacity of water resources has reached the limit or is overloaded, and the development potential is extremely low. Therefore, water resources will restrict the development of the social economy, and corresponding countermeasures should be taken.
The classification criteria of each index are shown in Table 2.
Table 2 Classification standard of evaluation index
| Evaluating index | V2 | V3 | V4 | V5 | |
|---|---|---|---|---|---|
| Water resources per unit area (10000 m2 / km2) | >60 | 30-60 | 20-30 | 10-20 | <10 |
| Available amount of water resources per capita (m2) | >3000 | 1700-3000 | 1000-1700 | 500-1000 | <500 |
| Development and utilization degree of water resources | <10 | 10-20 | 20-40 | 40-60 | >60 |
| Population density (person / km2) | <40 | 40-80 | 80-140 | 140-300 | >300 |
| Urbanization rate (%) | <25 | 25-40 | 40-60 | 60-70 | >70 |
| Natural growth rate (%o) | <2 | 2-10 | 10-15 | 15-20 | >20 |
| Rural domestic water consumption per capita (L / (day • person)) | <50 | 50-80 | 80-100 | 100-120 | >120 |
| Urban domestic water consumption per capita (L / (day • person)) | <150 | 150-210 | 210-300 | 300-400 | >400 |
| Grain per capita (kg / person) | >2000 | 1000-2000 | 500-1000 | 300-500 | <300 |
| Per capita GDP (10000 yuan / person) | <0.4 | 0.4-0.6 | 0.6-2.5 | 2.5-8 | >8 |
| Lower irrigation rate (%) | <10 | 10-20 | 20-50 | 50-60 | >60 |
| Water consumption per 10000 yuan GDP (m3 / 10000 yuan) | <30 | 30-60 | 60-100 | 100-300 | >300 |
| Proportion of positive value of primary industry in GDP | <5 | 5-12 | 12-15 | 15-30 | >30 |
| Proportion of positive value of tertiary industry in GDP | >65 | 50-65 | 40-50 | 30-40 | <30 |
| GDP growth rate | <5 | 5-10 | 10-15 | 15-20 | >20 |
| Water consumption rate of ecological environment | >5 | 3-5 | 2-3 | 1-2 | <1 |
| Forest coverage rate (%) | >50 | 40-50 | 20-40 | 10-20 | <10 |
Analysis and calculation process of neural network model
The theory of neural network systems is a frontier research field of artificial intelligence in recent years. It is based on the connection mechanism of large-scale parallel processing and distributed information storage. Depending on the connection of a large number of neurons and the different excited states of neurons caused by this connection and the overall behavior of the system, it is closer to the processing mode of the human brain (Pelusi et al., 2018). By using the nonlinear mapping relationship of neural networks, the complex coupling system of water resources carrying capacity is abandoned to find out the inevitable relationship between them, which can avoid the difficulties encountered in finding the relationship between them by other quantitative methods. Therefore, neural network theory provides an opportunity for further development of water resources carrying capacity research. The introduction of neural network theory into the field of water resources carrying capacity will promote the development of water resources carrying capacity research.
Artificial neurons
Neuron is the basic processing unit of an artificial neural network and a mathematical model of biological neurons in function and structure. It was first proposed by McCulloch-Pitts in 1943, so it is also called MP model (Todo et al., 2019). The MP model is a multi-input single output nonlinear element, as shown in Figure 1.
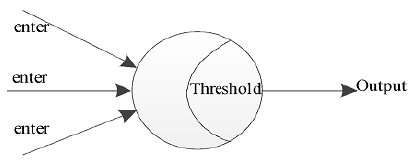
Suppose that x¡, x2, ... xn is the n inputs of neuron i, Wj¡ is the binding strength between the neuron and the j-th neuron from other layers, which is called the weight (Par & Kar, 2019); u¡ is the sum of inputs of neurons, θ i is the threshold of neurons, y¡ is the output of neurons, that is, the output equation of neurons is:
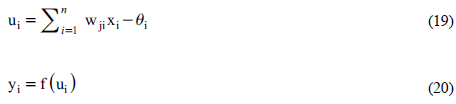
Where: f (u¡ ) is a nonlinear function between input and output, which is called excitation function (Wang et al., 2019).
The commonly used excitation functions can be classified into three types: threshold type, S-type and linear type. The mathematical expressions are as follows:
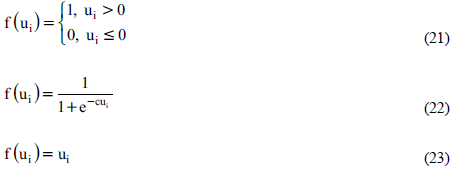
BP network model is the most widely used and successful artificial neural network. In 1989, Robert Hecht Nielson proved that under certain conditions, for any given e < 0, there exists a three-layer neural network, which can approach any nonlinear function with the precision of e-mean square error. Therefore, the mapping from arbitrary n-dimensional feature space to m-dimensional feature space can be completed by using a three-layer BP network.
BP neural network is a multi-layer forward network with unidirectional propagation, composed of input layer (X 1 ,...,X n ), output layer (Y 1 ,...,Y m ) and one or more hidden layers (H 1 ,..., H t ) (Figure 2). The input layer consists of n neurons, X¡ (i = 1,2,..., n) is the input; hidden layer consists of t neurons; the output layer consists of m neurons, Yg (g = 1,2,..., m) is its output. There is no coupling between neurons in the same layer, and the neurons between layers are connected by connection weight W and threshold b (Wang et al., 2018; Kamimura, 2018).wip, bp (i=1,2,…,n; p= 1,2,…,t) denotes the connection weight and threshold between the input layer and the hidden layer respectively, and wpg, bg(p = 1,2,...,t; g = 1,2,...,m) denotes the connection weight and threshold between the hidden layer and the output layer, respectively.
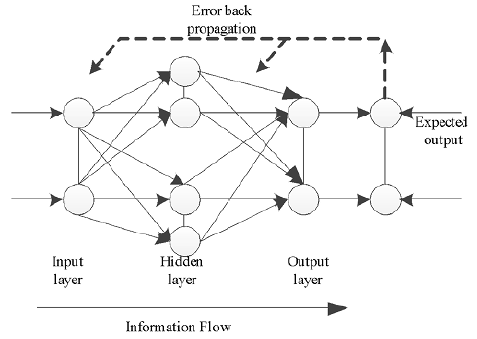
In general, there is no threshold and activation function in the input layer of the BP network, that is, the output of neurons in the input layer is equal to the input of input neurons, while the output of neurons in the hidden layer and output layer must be processed by weight and threshold. The calculation model is as follows:
The output of the hidden layer is as follows:
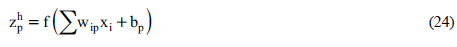
Where i= 1,2,...,n; p=1,2,…,t t x¡ is the input value of neurons in the input layer; zh p is the output value of neurons in the hidden layer; wh ip and bp is the weight and threshold between the input layer and the hidden layer. The output of the output layer is as follows:
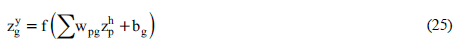
Where, p=1,2,…t; g=1,2…m; wpg h and bg is the weight and threshold between the hidden layer and the output layer.
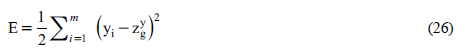
If there is an error between the output layer actually outputs zy g and expected output y¡, and the error E is greater than the specified error E0, the error signal is returned along the original path and propagates to the input layer successively by modifying the connection weights between neurons in each layer, and then goes through the forward propagation process. These two processes are repeated until E ≤ E0. At this time, the network learning process will automatically end, and the corresponding network structure and parameter setting will constitute the BP model of the problem.
The commonly used error control criterion is the least square error, that is, the energy function is (Li & Wang, 2018):
Network learning is based on gradient descent, by adjusting the weight Wip and Wpg, the formula of weight adjustment is as follows
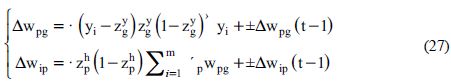
Where, wip and wpg is the weight between the input layer and the hidden layer, and the weight between the hidden layer and the output layer. η and α are called learning rate and inertia factor, respectively (Wen et al., 2019; Jiang & Li, 2018). When η is large, the convergence is fast but unstable; when η is small, the convergence is slow; α is just opposite to η .
Model form and step establishment
The evaluation index sequence of regional water resources carrying capacity is xij, the evaluation grade sequence is z¡, i = 1,2,...,N; j = 1,2,...,m. N and m represent the capacity of index sequence and the number of evaluation indexes respectively. There are:

The above formula shows that the input layer of ANN model has m units (x ij ; j = 1,2..., m), and the input layer has a unit (z ¡ ).
(1) According to the evaluation grade standard of water resources carrying capacity, a sufficient number of evaluation index sequences are generated by using Visual Basic programming technology, and the modeling sequence is composed of these index generating sequences and their evaluation grade values. The upper and lower limits of the evaluation index value in the p-th evaluation grade are respectively aP j and bP j, then the random simulation formula of evaluation index value is as follows:
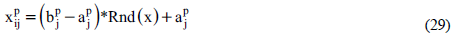
(2) Standardization of evaluation index
In order to eliminate the influence of different dimensions on the evaluation results, the evaluation index sequence is normalized and the following formula is used for data processing:
Cost indexes:
(3) The number of hidden layers and units of each hidden layer is selected, and the error limit value E0 between the output and the actual output is given. According to the sequence x¡j and z¡, the neural network is trained. When E ≤ E0, the training is over. The structure parameters, weight and threshold value of the corresponding neural network constitute the artificial neural network model for the evaluation of water resources carrying capacity.
Prediction of water resources carrying capacity in Zhaozhou County based on neural network model
The purpose of water resources carrying capacity analysis is to provide guidance and countermeasures for regional development, and the prediction of water resources demand is of great significance for the prediction of regional water resources carrying capacity. In this paper, the neural network model is used to predict the water consumption of the planning year 2025 with 2019 as the base year.
Selection of prediction indexes
As the utilization rate of water resources, water supply modulus, per capita daily domestic water consumption, cultivated land irrigation rate, forest coverage rate, water consumption of 10000 yuan industrial output value and water consumption of10000 yuan agricultural output value are the main impact factors affecting the carrying capacity of water resources in this area. Therefore, it is used to predict the carrying capacity of water resources in the study area in this section.
Preparation of e-learning samples and prediction data
According to the statistical yearbook of Zhaozhou County and the water resources bulletin of Zhaozhou County, the original data needed to calculate the above seven impact factors are calculated, as shown in Table 3.
Table 3 Original data of impact factors of water resources carrying capacity in Zhaozhou County (2013-2019).
| Particular year | 2019 | 2018 | 2017 | 2016 | 2015 | 2014 | 2013 |
|---|---|---|---|---|---|---|---|
| Annual total water consumption (100 million m3) | 97.22 | 94.3182 | 93.6993 | 89.9 | 87.164 | 84.17 | 87.67 |
| Annual water resources (100 million m3) | 834.63 | 990.999 | 916.074 | 1117.5 | 972.5 | 1217.46 | 1206.2 |
| Water supply (100 million m3) | 97.22 | 94.3182 | 93.6993 | 89.9 | 87.164 | 87.17 | 87.67 |
| Area (km2) | 176167 | 176167 | 176167 | 176167 | 176167 | 176167 | 176167 |
| Domestic water consumption (100 million m3) | 12.82 | 10.5603 | 10.4997 | 15.35 | 15.043 | 15.11 | 15.28 |
| Population (10000) | 3931.12 | 3878.47 | 3869.66 | 3837.27 | 3798.51 | 3755.72 | 3605.81 |
| Effective irrigation area (10000 mu) | / | 1040.2864 | 1021.065 | 1007.295 | 989.72 | 980.06 | 965.81 |
| Common cultivated land area (10000 mu) | / | 2723.0128 | 2625.81 | 2654.11 | 2748.42 | 2756.22 | 2772.46 |
| Forest coverage rate (%) | 35.9 | 34.9 | 34.9 | 30.83 | 30.83 | 30.83 | 30.83 |
| Industrial water consumption (100 million m3) | 28.14 | 26.9346 | 26.3888 | 23.22 | 20.14 | 18.88 | 24.05 |
| Industrial output value (100 million yuan) | 849.4621 | 731.7347 | 600.817 | 474.68 | 387.85 | 348.59 | 326.03 |
| Agricultural water consumption (100 million m3) | 54.51 | 55.87 | 55.8676 | 51.34 | 51.976 | 50.18 | 48.34 |
| Agricultural output value (100 million yuan) | 363.149866 | 329.170207 | 298.37 | 280.83 | 274.17 | 270.99 | 267.57 |
Through calculation, the data of seven impact factors of water resources carrying capacity in Zhaozhou County are obtained, as shown in Table 4.
Table 4 Data of seven impact factors of water resources carrying capacity in Zhaozhou County (2013-2019)
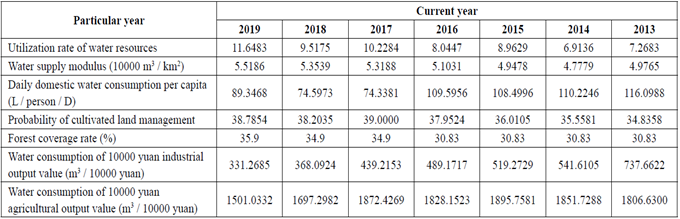
Where, the utilization rate of water resources = total annual water consumption / annual water resources, water supply modulus = 104 x water supply / area, per capita daily domestic water consumption = 107 x domestic water consumption / (population x 365), and water consumption of 10000 yuan industrial (agricultural) output value = 104 x industrial (agricultural) water consumption / industrial (agricultural) output value.
Combined with Zhaozhou County planning outline and social development science and technology planning, based on some data in Zhaozhou County statistical yearbook, and selecting 2019 as the base year, the data of seven impact factors of water resources carrying capacity in Zhaozhou County in the planning level year 2025 can be obtained, as shown in Table 5.
Table 5 Data of seven impact factors of water resources carrying capacity in Zhaozhou County in 2025
| Impact factors | Base year (2019) | Planning year (2025) |
|---|---|---|
| Utilization rate of water resources | 11.6483 | 18.35 |
| Water supply modulus (10000 m3 / km2) | 5.5186 | 60.269 |
| Daily domestic water consumption per capita (L / person / D) | 89.3468 | 200.0000 |
| Probability of cultivated land management | 38.7854 | 55.49 |
| Forest coverage rate (%) | 35.9 | 40.0000 |
| Water consumption of 10000 yuan industrial output value (m3 / 10000 yuan) | 331.2685 | 173.3227 |
| Water consumption of 10000 yuan agricultural output value (m3 / 10000 yuan) | 1501.0332 | 1298.0196 |
Where, the utilization rate of water resources, water supply modulus, water consumption of ten thousand yuan industrial output value and ten thousand yuan agricultural output value are predicted and calculated by natural growth rate method; r1, r2, r6 and r7 represents the average annual growth rate of water resources utilization rate, annual average growth rate of water supply modulus, annual average growth rate of water consumption per 10000 yuan of industrial output value and annual growth rate of water consumption of 10000 yuan of output value, respectively; r 1 = 9.5217%, r2=1.7778%, r6= -12.151%, r7=-2.864% ; r4 is the average annual growth rate of cultivated land from 2013 to 2019, the value is - 0.147%, and the irrigation area in 2025 is predicted to be 15 million mu.
Network training process and result test
In this paper, seven indexes of water resources utilization rate, water supply modulus, per capita daily domestic water consumption, cultivated land irrigation rate, forest coverage rate, water consumption of ten thousand yuan industrial output value and ten thousand yuan agricultural output value are selected as the input layer of the neural network prediction model of water resources carrying capacity in Zhaozhou County, and the water demand is taken as the network output; the hidden layer neuron is 7; therefore, the network topology structure is: 7 → 7 → 1 .
The seven impact factor values from 2013 to 2018 in Table 4 and the water consumption in corresponding years in Table 3 are normalized and used as network training samples to train the network. When learning rate η = 0.1, inertia factor α = 0.2, error tolerance E ≤ 0.1, that is, the accuracy is 90% (Dos Santos et al., 2019); when the number of iterations is 34735, the network reaches the required accuracy, E = 0.0999924 , that is, E ≤ E0 .
The seven impact factor values in 2018 and 2019 in Table 4 and the water consumption in corresponding years in Table 4 constitute test samples to test the trained network. The test results are shown in Table 6.
Table 6 Prediction test and prediction results of water resources carrying capacity neural network model in Zhaozhou County
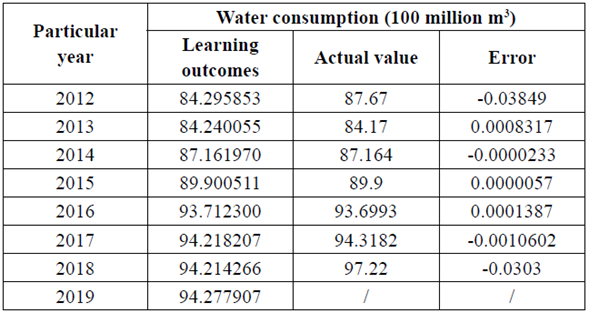
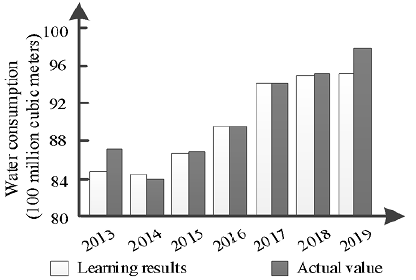
The actual value of annual water consumption in 2019 is 9.722 billion m3, and the prediction value of neural network model is 942742.66 billion m3, with the accuracy of 96.97%; then, the data of the planning level year 2025 is input into the network for prediction, and the prediction result is that the water demand in 2025 will be 94277907 million m3. The change trend chart of predicted and actual water consumption in 2013-2019 is shown in Figure 3.
Conclusions
As an important natural resource, water resource is the key factor to maintain the integrity and virtuous cycle of ecosystem function, and is also the basic resource and strategic economic resource to maintain human survival and social and economic development. In recent years, with the increase of population and the rapid development of social economy, the water problem has become increasingly prominent. As an important part of sustainable development and water resources security strategy research, water resources carrying capacity plays an important role in realizing the harmonious development of economic, social and environmental system, and is also the focus and hot issue in the field of water resources science research. In this paper, the artificial neural network is used to predict the regional water resources carrying capacity
(1) Based on the analysis of the general information of the study area, the water resources of the region are determined;
(2) An evaluation index system of water resources carrying capacity suitable for the study area is constructed to give full play to the role of evaluation indexes;
(3) The experimental results show that: this method can effectively predict the carrying capacity of water resources, and the prediction results fit well with the actual data, which has important practical value.
To sum up, the prediction method has certain feasibility conditions. Using artificial neural network model to predict water resources carrying capacity can obtain more accurate prediction results and lay a data foundation for the follow-up measures.

