


 English (pdf)
 Article in xml format
 Article references
 Send this article by e-mail
 Cited by SciELO
  Cited by Google
  Similars in
SciELO
Similars in
SciELO  Similars in Google
 Permalink
Introduction
Sedimentation, that is the deposition or accumulation of sediment that is suspended throughout a body of water, is one of the main issues affecting reservoirs, regardless of their characteristics or purpose. Sediment deposition is a natural process largely caused by erosion as a consequence of rainwater transporting suspended sediments to the streams (Vanmaercke et al., 2011). Sediment deposition causes significant environmental damages and economic impacts to reservoirs, including loss of storage capacity, turbine damage, and loss of energy production (ICOLD, 2009). These sediments are retained at the entrance of the reservoir and in its tributaries, forming a pluvial delta. One of the causes of sedimentation is the removal of vegetation from the soil through inadequate use (Cabral, 2005).
The construction planning and maintenance of a reservoir demand analysis of the sedimentation process in the area can be estimated through bathymetric surveys (Valent et al., 2019), which is completed by performing measurements of depth in relation to a position on the surface (IHO, 2005; Ferreira et al., 2015). The monitoring of sedimentation in reservoirs is crucial for the understanding of their operational life, especially if they are intended to generate electricity or supply water to the population (Yutsis et al., 2014).
The SAAE (Serviço Autônomo de Água e Esgoto), a water utility company, is in charge of the supplying water to the municipality of Viçosa, Minas Gerais, Brazil. Both SAAE and UFV (Federal University of Viçosa) collect water from the small artificial reservoir that is the focus of this study. In recent years, Viçosa has been facing a concerning water supply crisis, mainly due to population growth, expansion of the university campus, and more severe drought periods. In addition, the reservoir has lost a significant amount of storage capacity since construction in the 1960s (information on the construction decade was provided by UFV administration).
Moreover, Viçosa has an uneven rainfall distribution over the year, with a high volume of rain during the rainy season and a low volume during the dry season, a condition that has recently become worse as an impact of climate change (INMET, 2016). Therefore, Viçosa's water resource demands appear to be insufficiently met and the sedimentation process of the studied reservoir accentuates this worrying scenario the city is experiencing. Consequently, the loss of useful storage capacity in the reservoir, caused by sedimentation, becomes more serious and demands proper management in order to abate this process and to promote a better use of land in the upstream parts of the watershed, improving infiltration and reducing runoffs.
Furthermore, the process of erosion and sediment carriage in regions of tropical climate, such as Viçosa, is much more intense than in regions of temperate climate, where similar studies are more widespread. Another significant aspect is that the reservoir is located in a watershed that is typical of the Southeast region of Brazil in terms of climate, topography, geology, and land use. This ensures the relevance of this paper, since, in the literature, there are few available studies carried out under these conditions. As such, a thorough study in the area provides relevant information to minimize the current problems in Viçosa.
This study determined the sedimentation rate of the reservoir by analyzing bathymetric data collected in 2010, 2012, and 2016. Moreover, we detailed important information about how the sedimentation process occurs in the studied reservoir, which can be used for planning intervening actions, allowing a proper management of its storage capacity (Kondolf et al., 2014).
Materials and Methods
Study Area
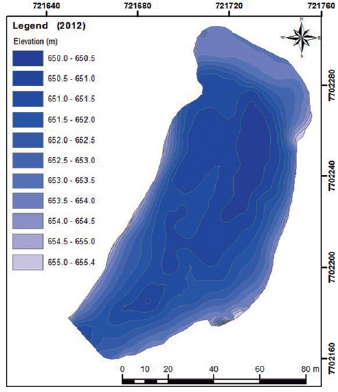
The studied area is located on UFV's campus, in Viçosa, Minas Gerais, Brazil, between the geographic coordinates 20°46'01.58"S, 42°52'15.27"W and 20°45'57.37"S, 42°52'11.38"W (Fig. 1).
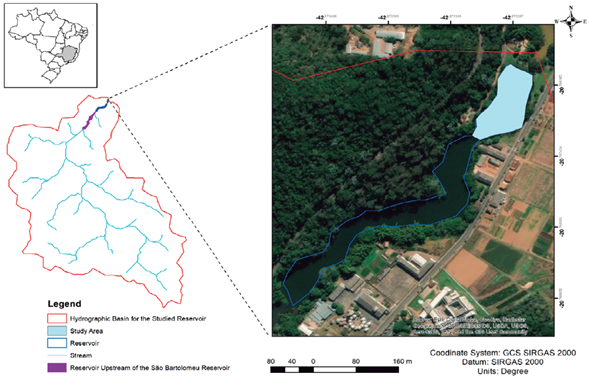
Viçosa is located at the Southeast region of Minas Gerais state. The region has a predominantly rugged relief with altitudes varying from 397 m to 1,005 m. The average altitude is approximately 650 m. The region's climate is tropical with hot, rainy summers and cold, dry winters. It is classified as Cwa on Kôppen's system, with an average annual temperature of 19 °C, with an average of the maximum equal to 26.1 °C and the minimum of 19 °C; and the average annual rainfall is equal to 1,314.2 mm (CASTRO et al., 1983). The reservoir, which was built in the 1960s, belongs to the Ribeirão São Bartolomeu watershed and flows into the Turvo Sujo River. This last one flows into the Piranga River. All of them are affluent of the Rio Doce River and belong to its watershed. The Ribeirão São Bartolomeu is one of the main sources of the water supply of Viçosa.
The area was selected to comprise the furthest downstream fraction of the second reservoir in a small stream named São Bartolomeu (Fig. 1). This reservoir is approximately 667 m long, with a maximum width of 66 m.
Methods
2010 and 2012 Bathymetric Surveys
The data from the 2010 survey was collected and processed by Ferreira (2011) in December of that same year, for his final MSc project in Surveying and Cartographic Engineering carried out in the UFV. The reservoir's contour limit and other details of the studied area were surveyed through a total station, that is a device for topographic measurements which measures vertical and horizontal angles as well as linear distances. Three benchmarks were materialized in the vicinity of the studied area using GPS positioning to support the topographic survey. We also performed a leveling was also to obtain orthometric heights using the RN3307F benchmark as a reference.
In the bathymetric survey, a single-beam echo sounder and a pair of GTR -G2 RTK GNSS receivers were used to collect depths and position data, respectively. A 4.5 m interval was employed in the survey lines, while the 10.0 m interval was applied to the check lines.
The data from the 2012 survey is part of the mapping project of the lakes located on UFV's campus, which was carried out in June of that same year. The information about the survey was taken from a technical report entitled "Mapeamento dos relevos submersos das lagoas da UFV" (Mapping of the submerged topography of the UFV Lakes) (In Portuguese). The contour limit of the reservoir was taken from an orthorectified Ikonos II image with a 1 m spatial resolution. The elevations were obtained from the RN3307F benchmark by using a total station and applying a leveling method known as Leap Frog. The bathymetric survey followed the same methodology used in 2010.
Both 2010 and 2012 data used in this work were taken from an Excel spreadsheet containing the planimetric coordinates (SIRGAS 2000 reference system) and the orthometric height (data materialized by the station in the port of Imbituba, Brazil) of each point, which were collected by the single-beam echo sounder after eliminating spikes, positioning errors, and estimating the survey's accuracy. The data processing followed the same methodology adopted for the information obtained in 2016.
Auxiliary Procedures of the 2016 Bathymetric Survey
Before performing the bathymetric survey, we needed to set a reference point to measure the water level. To that end, we chose a nearby benchmark named M0 as a reference point. A GPS survey was carried out to determine its coordinates.
We performed a leveling survey to obtain the orthometric height of the reservoir's water line using the method known as Fly Leveling. The elevations references were determined according to the average sea level surface, based on tide gauge measurements of the station located in the port of Imbituba, Santa Catarina, Brazil (IBGE, 2008). The survey was referenced to a benchmark nearby that belongs to the Altimetric Network of the Brazilian Geodetic System. We determined the elevation of the M0 Reference Point and then obtained the elevation of the reservoir's water line.
2016 Bathymetric Survey
Ferreira (2011) provided the DWG file of the contour line of the reservoir. According to ABNT (1994), the smallest size identified on a map is 0.2 mm, due to the human visual acuity. Then, targeting a maximum error of 10 cm for the final result, we selected a scale of 1:500. Survey lines depend on the resolution and the scale of the final result, and ANEEL et al. (2000) claimed that they must be 1 cm apart from the final result, which corresponds with a 5 m interval when considering the scale used in this study. To avoid areas between survey lines that did not provide any data, we adopted a 4.5 m interval between these lines, as well as a 10 m interval for the check lines. All of this information was input in the Hypack software.
In the field, we had to verify the reservoir's water level in order to identify variations that might directly affect the volume calculation, which is a task that needs to be performed immediately before and after the bathymetric survey. In this procedure, a graduated cylinder was placed on a suitable and stable location on the bank of the reservoir, so that we could verify the water level and then obtain the height difference between M0 and the water line using a level.
Subsequently, we connected all of the equipment to the Hypack software and measured the draft, the distance between the water line and the bottom of the transducer that is underwater. The observed depths are then corrected by the addition of the draft value. In addition, the average speed of the underwater sound was estimated using the bar check method, detailed in IHO (2005) and Ferreira et al. (2015). Next, we collected the bathymetric data using the single-beam echo sounder for sounding data, and obtained the position data (SIRGAS 2000 reference system) using the JAVAD (Real Time Kinematic - RTK, with corrections received through the Networked Transport of RTCM via Internet Protocol - NTRIP). A great amount of aquatic plants, mainly during the drier period of the year severely hindered the project's progress.
The first step of the bathymetric data processing included the use of the Hypack software for manually deleting spikes - noises from the surveyed lines in the raw data - to ensure better quality in the final product. Despite being sometimes a subjective and a time-consuming process, eliminating spikes manually is a common procedure used to remove those random points that clearly do not represent the bottom surface of a study area (Calder and Smith, 2003). This process was very cumbersome due to the great number of aquatic plants in the studied area. The point cloud does not represent the submerged topography in a spatially continuous manner, therefore requiring an interpolation method. We applied kriging interpolation in accordance to the descriptions presented by Ferreira et al. (2013) and Ferreira et al. (2015). According to these authors, a supervised kriging interpolation allows significant gains in the results, which may contain considerable errors when a previous rigorous geostatistical analysis is not considered.
Kriging provides a solution to this problem based on a continuous model of stochastic spatial variation. This variation considers how a given property varies in space through the semivariogram function, and it involves a few distinct types of kriging that are divided into linear and nonlinear models. In linear kriging, which was used in this research, the estimates are weighted linear combinations of the data. The weights are distributed to the data samples based on the nearby points. The total number of weights can be also set by the user in a way that generates estimates with minimal kriging variation. Moreover, the estimates are unbiased. (Webster and Oliver, 2007).
According to Camargo (1998), the steps involving a geostatistical analysis consist of exploratory data analysis, semivariogram generation and modeling, model validation and interpolation, and prediction of uncertainty. Ferreira et al. (2013) listed and described these steps, which were used as reference for the data interpolation of the three surveys in this study.
The use of kriging interpolation provided several statistical indicators, such as Root Mean Square (RMS), coefficient of determination (R2), Root Mean Square Standardized Error (RMSS), and coefficients of the simple linear regression (both dependent and independent variables), considering the observed and predicted depth values calculated through the interpolation.
Subsequently, a DEM for each survey was generated from the spatial representation model of the interpolation created at the end of the kriging process. A 0.5 m interval was used for the contour lines, and the ArcGIS was employed to obtain the volumes for different water line levels by generating a Triangular Irregular Network (TIN). For this step, we considered a plane with constant elevation that passes through the TIN. Afterwards, the software algorithm calculated the cumulative volume between the horizontal plane and the TIN, providing the values of volume and surface area. In this study, we considered different planes at different elevation values, from the surface of the reservoir down to a level close to the bottom, considering an interval of 0.5 m.
As such, values of volume and surface area (in m3 and rtf, respectively) were obtained for each elevation (in this study, elevation equals orthometric height).
Furthermore, considering that the elevation of the water line is different for each bathymetric survey, the lowest value was used as a reference level. This important procedure is required to ensure that there are values of volume and surface area for each elevation considered (those elevations at the interval of 0.5 m previously mentioned) in each survey; otherwise, a comparison would be impossible. If any other elevation value of the water line is considered, there would be at least one survey with lack of data above the water line elevation of that survey.
Surveys Uncertainty Analysis
Bathymetric surveys should meet standards established by the Brazilian Navy's Board of Hydrography and Navigation (DHN), which follow the standards defined by the International Hydrographic Organization (IHO). For depth accuracy, considering a 95% confidence level, the error limits can be calculated using the following expression (IHO, 2005):
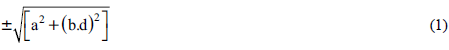
Where
a is a sum of all constant errors;
b is a factor of depth dependent error; and
d is the average depth.
Table 1 shows the constants a and b that are given according to the hydrographic surveys classification.
Table 1 Constants to calculate errors limits for depth accuracy on bathymetric surveys.
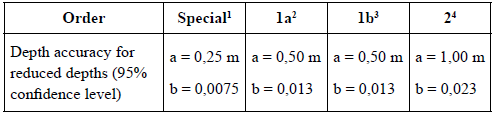
1 It is the most rigorous of the orders and its use is intended only for areas where under-keel clearance is critical.
2 For areas where the sea is sufficiently shallow to allow natural or man-made features on the seabed to be a concern to the type of surface shipping expected to transit the area but where the under-keel clearance is less critical than for Special Order.
3 For areas shallower than 100 meters where a general depiction of the seabed is considered adequate for the type of surface shipping expected to transit the area.
4 It is the least stringent order and is intended for areas where the depth of water is such that a general depiction of the seabed is considered adequate.
Fonte: IHO, 2005.
A bathymetric survey meets the quality standards when the Total Propagated Uncertainty (TPU), suggested by Ramos (2007) and presented below, is less than the error limits calculated using the expression 1.

σ2 erro and σ2 média are the standard deviation and the standard error of the mean respectively. In order to estimate them, check lines are performed orthogonally to the main lines when surveying. At the intersection points between the main lines and the check lines, the differences of the reduced depths values are computed. The standard deviation and the standard error of the mean are estimated from the set of the not null values obtained (RAMOS, 2007).
Sedimentation Estimation
The sedimentation estimation was based on the analysis of the volume data calculated by the ArcGIS software. We obtained values of water volume through elevation data from three years. By taking an elevation value and analyzing the water volume variations among the surveys, we estimated the accumulated volume of sediments for that value of elevation. In other words, if the variation (previous value minus current value) was positive, it meant that there was a "loss" of useful volume in the reservoir for that elevation value, which characterizes a sedimentation process. Conversely, if the variation was negative, there was a "gain" of useful volume in the reservoir for that elevation value, that is, a sediment loss (desilting). This analysis was possible due to the fact that we only considered the top layer of fluid mud.
Finally, we computed charts to obtain useful information, such as an estimate of the value of total sediment accumulated between the performance of each survey and an estimate of the annual sedimentation rate.
Results
From 2010 survey, the TPU obtained was 0,185 m. Special Order classification in that case set a depth accuracy for reduced depths of 0,252 m, at 95% confidence level. From 2012 survey, the TPU obtained was 0,317 m. 1a Order classification in that case set a depth accuracy for reduced depths of 0,502 m, at 95% confidence level. That means 2010 and 2012 surveys meet the quality standards established by the DHN, along with IHO's. It is important to highlight though that Special and 1a Orders require full search of the bottom, which is possible only when using multibeam echosounders (IHO, 2005).
From the auxiliary procedures performed for the 2016 bathymetric survey, the latitude and longitude of M0 were equal to 20° 45' 57.6" S and 42° 52' 11.6" W, respectively. Regarding the fly leveling from M0 to the benchmark located in the Laboratory of Surveying and Cartographic Engineering of UFV, the error between leveling and check leveling was equivalent to 3 mm. According to ABNT (1994), the closing tolerance for leveling for the employed methodology can be divided into four classes: IN, IIN, IIIN, and IVN (the IN class requires the highest accuracy, and the IVN class requires the lowest). The leveling performed by us was classified as IN. Moreover, the orthometric height of the water line for the 2016 survey was equal to 654.2 m.
Technical problems prevented check lines from being probed during the 2016 survey, which made it impossible to estimate vertical uncertainty as done for 2010 and 2012 surveys. However, as cited by Ferreira et al. (2016), the sounding system used in the surveys meets the requirements of the Brazilian Navy Standards for Execution of Hydrographic Surveys (NORMAM-25), being able to perform surveys of Special Order, considering the average depth of the surveyed area. Furthermore, considering the recommendations of the National Water Agency (ANA, 2013), the system used also meets the minimum requirements for the 2016 bathymetric survey main purpose, that is, for estimating the sedimentation at the study site.
These results show that the data acquired in all surveys meet the current requirements established by the Brazilian Standards and can be used to estimate the sedimentation as well as the capacity of reservoirs. Since the variable used to classify the data is directly proportional to the uncertainties associated with the data, 2010 survey proved to be more reliable, despite the others surveys also proved to be reliable enough to be considered to this study's purpose.
Kriging
The results generated by the exploratory analysis of the data for all the surveys followed the supervised kriging interpolation procedure described by Ferreira et al. (2013) (Table 2).
Table 2 Statistical parameters of the data collected in bathymetric surveys
| Year | 2010 | 2012 | 2016 |
|---|---|---|---|
| Mean (m) | 651.3 | 652.9 | 651.6 |
| Median (m) | 651.0 | 652.5 | 651.5 |
| Standard Deviation (m) | 1.0 | 1.9 | 1.3 |
| Variance (rtf) | 1.11 | 3.55 | 1.78 |
| Maximum (m) | 655.4 | 655.4 | 654.2 |
| Minimum (m) | 651.3 | 650.0 | 649.2 |
| Asymmetry | 2.09 | 0.24 | -0.02 |
| Kurtosis | 8.60 | 1.50 | 1.68 |
Regarding symmetry, the data from 2010 and 2012 were asymmetrical to the right due to the substantial positive asymmetry to the right in 2010, while minor positive asymmetry to the right in 2012, and a very slight negative asymmetry to the left in 2016. As for the kurtosis, which measures the proximity degree of the distribution values around the center, only the 2010 survey presented a noticeably high value. This indicates that the 2010 data is closer to a regular distribution curve when compared to the other years. Another remarkable aspect is how the minimum value of altitude decreased over the years.
The data set also showed the presence of second-order trends for all surveys. This is an important information, for the presence of a trend in the data could affect the identification and interpretation of spatial dependence in the semivariogram (Ferreira et al., 2013). To perform supervised kriging with the presented parameters, we used Universal Kriging to remove the second-order trend terms in all surveys. To that end, a low-degree polynomial adjustment was used in the surveys performed in 2010 and 2012, while the Gaussian model was employed in the 2016 survey due to its suitability.
When modeling the semivariograms, we observed an absence of anisotropy (isotropic characteristics), which means that the variability or spatial distribution of the observations depends only on the Euclidean distance, and rarely occurs in a single direction. Therefore, a single semivariogram representing all directions, known as omnidirectional, was used for each survey. The theoretical model that best fit the experimental model for the semivariogram modeling was stable in all of the surveyed years.
After the interpolation, we calculated, for each surveyed year, a simple linear regression between the data we obtained and the data estimated through the interpolation. The cross-validation results described the accuracy of the interpolation using Supervised Universal Kriging (Table 3). The variables α and B are the dependent and independent variables, respectively. The closer α is to 1 and B is to 0, the better is the kriging prediction performance. It is also possible to observe Mean Error, RMS, and RMSS values that provide further information about the quality of the interpolation.
Table 3 Cross-validation results of the surveys
| 2010 | 2012 | 2016 | |
|---|---|---|---|
| a | 0.99 | 0.98 | 1.00 |
| B (m) | 2.7 | 12.8 | 0.1 |
| Mean Error (m) | 7.4x10⁻³ | -1.4x10⁻³ | -0.5x10⁻⁴ |
| RMS (m) | 0.3 | 0.2 | 0.1 |
| RMSS (m) | 1.0 | 0.9 | 0.8 |
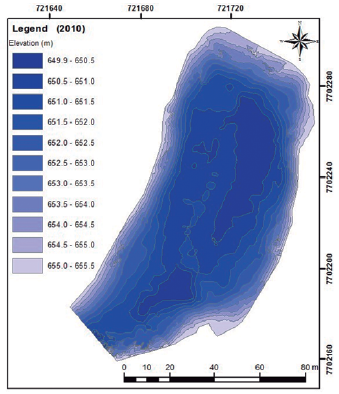
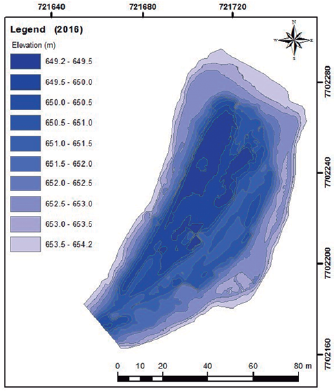
From the previous table, we conclude that the kriging prediction performance was better for 2010 and 2016 surveys. That means the model chosen for them fits better the respective data than the model chosen for the 2012 survey. After assessing the consistency of the prediction results, the kriging model generated DEMs for each year (Fig. 2, Fig. 3, and Fig. 4).
Quantification of Sedimentation
Following the calculation of accumulated volumes in relation to the elevation, as described in the methodology section, we generated Elevation x Surface Area and Elevation x Accumulated Volume diagrams with their respective trend lines (Fig. 5).
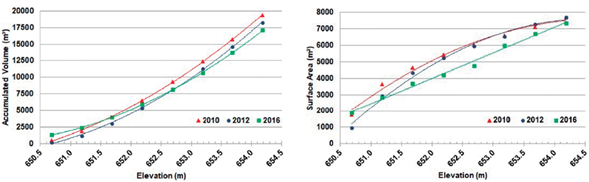
The analysis of the data that generated the charts demonstrate that, between 2012 and 2016, there was an increase in the accumulated volume in the lower section of the reservoir, ranging from 650.7 m to 652.2 m. However, the total volume of the reservoir up to the elevation of 654.2 m was equal to 19,360.7 m3 in 2010, 18,257.2 m3 in 2012, and 17,086.7 m3 in 2016. By observing Fig, 2, Fig. 3, and Fig. 4, it is possible to see the occurrence of desilting in the reservoir bed, as well as sedimentation in areas of medium and low depth.
From reservoir volumes, we obtained 1103.4 m' of sediments from 2010 to 2012 and a sedimentation of 1170.6 m' from 2012 to 2016. These values represent approximately 5.7% and 6.4% of the total volume of the reservoir respectively and an average annual percent sedimentation of 2.9% and 1.6% respectively. White (2000) and Rahmani et al. (2018) state that the worldwide loss in reservoir storage capacity is reported to be between 0.5% and 1.0% per annum. Despite observing that the sedimentation rate in the study area was higher in both periods considered, Rahmani et al. (2018) also concluded that smaller reservoirs experience higher values of annual depletion rates, which is fully consistent with the results of this current work.
From 2010 to 2012, there was a substantial accumulation of sediments in the deepest part of the reservoir, while minor variation was found in the shallower part (Fig. 6). It suggests that changes in land use with considerable soil excavation in the upper part of the watershed, which are a result of urbanization of rural areas for construction of residential condominiums, have increased soil exposure to erosion and lead to an increase in sediment transport to the reservoir under analysis.
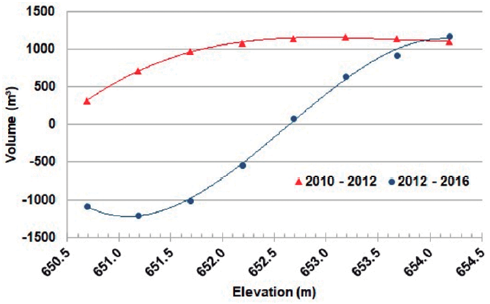
However, the analysis of the results from 2012 to 2016 shows a negative variation in sediment volume for deeper sites (650.5 m and 651.0 m), as well as a significant sediment accumulation from these elevations up to the water level. This is the result of two aspects:
i. Modification in the precipitation pattern from 2012 to 2016 (to be discussed in topic "Management takeaways"), probably due to climate change effects, leading to an increase in soil erosion and sediment transport in the upstream portion of the watershed;
ii. Stabilization of urbanization, with increasing protection of soil in the residential areas.
Some new restrictions in the land use of these upstream areas have also contributed to this effect.
Therefore, an interesting phenomenon occurred from 2012 to 2016, where it is possible to observe a desilting process in the deepest part of the water body and a concentrated sedimentation in the shallowest part, whereas, from 2010 to 2012, the sedimentation accumulation was scattered, with only a slight concentration in the deepest part of the studied area. According to news from the newspapers of the time, such as the one quoted by the Portal Saneamento Básico (2014), the dead volume of the reservoir was used to supply the population in the 2014-2015 drought season that occurred in the region.
The construction of a reservoir in a stream affects the hydrological regime of a river in regards to water and sediment flow, leading to changes in its morphological processes. The transport of sediment affects water quality, including its thermal change, a factor that impacts the capacity of transporting sediment flow (Webb and Walling, 1996). This reduced particle flow, which is linked to the continuous flow of water, can change the longitudinal profile of the reservoir, causing erosion in the riverbed, also known as carving.
Marginal erosion in river channels by the action of river currents is something that happens continuously and spontaneously. However, carving usually tends to be more intense than lateral erosion, which gradually modifies the channel cross-section, since the bottom is being widened and deepened (Coelho, 2008). Valentin et al. (2005) observed such a case in reservoirs from several countries, such as Australia, China, Ethiopia, and the USA. In USA, it was observed in the Hoover Dam on the Colorado River, where the greatest lowering of the average river bed was approximately 7.1 mat 12.4 km downstream from the dam (Galay, 1983); and in China, it was observed in the Sanmenxia Reservoir on the Yellow River (Wang and Wu, 2005), where the degradation was about 4.0 m at 68 km downstream from the dam (Li et al., 1980; Galay, 1983).
The increased water volume in the deepest studied section occurred due to a carving process in the riverbed, as observed when we compare the DEM images (Figs 2 to 4). There was a widening and deepening of the bed, and a decrease in the total accumulated volume of the reservoir, which happened due to the sedimentation by fine floating sediments in areas with an elevation higher than 652.2 m. It is likely that these fine sediments were also carried downstream, where it was possible to observe a severe sedimentation of another small reservoir located in this area.
It is worth mentioning that the minimum altitude in 2012 was lower than in 2010, though the total volume in 2010 (up to the water level) was higher than in 2012. The same characteristic is observed when comparing 2012 to 2016. This supports the conclusion that there was sedimentation in the studied area during the analyzed period, and that this process took place in shallow to medium depths, while the desilting happened in the deepest part. In the end, the process resulted in a decrease in the total available volume of this reservoir.
Management Takeaways
As previously mentioned in this work, for the first and second periods considered, the accumulated sediment in the study area represents approximately 5.7% and 6.4% of the total volume of the reservoir respectively and an average annual percent silting of 2.9% and 1.6% respectively.
The significant difference in the average annual rates can be explained by the rainfall distribution in Viçosa during the studied period. According to the data from INMET (2016), from December 2010 to June 2012, the total rainfall was equivalent to 2501.4 mm, and the average monthly rainfall was 131.6 mm. From June 2012 to September 2016, the total precipitation reached 4490.5 mm, while the average monthly rainfall reached only 86.4 mm.
Although the total rainfall volume was higher in the period between June 2012 and September 2016, INMET data shows that they were more evenly distributed over time. During the first interval, the rains were concentrated and more intense in the period between November to March of each year, thus increasing erosion processes. The data also shows that the average monthly rainfall was higher from 2010 to 2012 and has been decreasing progressively since 2013.
It is important to mention that during the summer periods of 2013/2014 and 2014/2015, the southeastern region of Brazil suffered a significant decrease in precipitation. These phenomena are related to the absence of the South Atlantic Convergence Zone, for the first period, and the El Niño phenomenon, for the second period, as detailed by Coelho et al. (2016).
The occurrence of more intense rains combined with the decrease in the total annual amount of precipitation brings up evidence of climate changes that have been noticed on a global scale. According to IPCC (2014), Central and South America live under the potential risk of reduced water availability and increased flooding and landslides, which are also related to global climate changes. It can also be observed in Viçosa.
Therefore, from all precipitation data discussed and all evidence previously presented, a very important relationship can be established between rainfall distribution and sedimentation in the studied area: more intense rainfall results in a higher rate of sediment accumulation, while moderate rains and drought periods result in a lower annual rate of sediment accumulation. In other words, heavier precipitation leads to an increase in sedimentation.
Land-use changes over time in the region have also contributed to the increasing sedimentation in the reservoir. In 1987 and 2007, Costa et al. (2013) carried out a mapping of the land use in the São Bartolomeu watershed to verify if permanent preservation areas (PPAs) and legal nature reserves were actually being respected. PPAs located along the banks of watercourses, when deforested, degraded, or improperly occupied, are susceptible to the effects of landslides and the consequent sediment transport to the riverbed, thus promoting its sedimentation (Departamento de Conservação da Biodiversidade, 2011).
These authors concluded that during this period the urban area expanded from 40.67 ha to 65.51 ha, mainly due to the construction of surrounding residential condominiums. Coffee crop areas also increased. In general, all land use classes had an encroachment of over 30% in PPAs during the evaluation period, therefore violating the current environmental legislation in Brazil.
All these changes along the São Bartolomeu watershed increased the rate of soil detachment over time, as well as the consequent transport of these sediments along the stream. This fact endorses the need for the development of sustainable practices that should support a permanent reduction in soil transportation toward the reservoir. This is more significant during a period of climate change, as the precipitation is more intense and frequent, as well as longer in duration, resulting in more erosion and more sedimentation of the reservoirs in an area with an undulated terrain pattern and erosive soil - like the one observed on the watershed under study.
In this context, some management measures can be proposed aiming at the reduction of soil erosion and desilting of the reservoir. For a short-term action, a desilting through dredging or mechanical excavation of the sediments could help improve the reservoir's storage capacity. For a long-term action, a drastic change by restricting land use laws along the upper portions of the watershed should be implemented by the municipality, which might promote the recovery of areas that have been degraded. In addition, the municipality should restrict real estate speculation in the upper portion of the watershed.
Conclusions
Based on the results obtained from the bathymetric surveys, we observed that the downstream fraction of the second reservoir located in the São Bartolomeu stream underwent a process of carving on its bed, as well as a recent sedimentation on its banks due to deposition of fine sediments. Overall, these processes have been responsible for reducing the water storage capacity of the reservoir, since the total sedimentation rate of the reservoir was 1103.4 m', and, as the urban area expansion is already underway in the upstream areas of the watershed, this process is expected to continue exerting that influence.
In the studied area, we observed a correlation between the deposition of sediments over time and the occupation and land use in the São Bartolomeu watershed. The deposition was also related to the intensity and distribution of rainfall in the region, with more intense rains and drier and longer winters being observed over the past few years as a reflection of local impact of climate change. In the period of heavy rains, there was a higher rate of sediment deposition, while, in the period of more moderate rains, the rate of deposition was much lower.
In addition, the catchment area of the studied reservoir underwent several changes over the years, exposing the soil to rainfall erosion. Consequently, there was an increase in the amount of transported sediment, which also explains the sedimentation in the area. This effect was reduced during the 2012 - 2016 period, as a response to a decrease in the average monthly rainfall and in land use in the upstream area.
Lastly, considering the current global scenario of more severe climate changes - mainly concerning rainfall distribution throughout the year - the reservoir's managers and the municipal government should keep the database of bathymetric surveys updated, enabling them to support analyses of annual sedimentation rate and provide useful data to determine management actions for mitigating erosion processes along the watershed, thus improving the total capacity of the reservoir. We mentioned actions that include planning the territorial occupation efficiently (taking into account the regional reality and the characteristics of the soil), providing favorable conditions for infiltration (reducing areas of exposed soil), and preserving the springs in surrounding areas of natural vegetation.
For future works, the sedimentation of the reservoirs can be estimated using mathematical modeling methods and erosion-transport empirical models. Measurements and modeling can be compared considering subsequently scenarios for climate and land-use changes, as well as using field data for verification and validation. We suggest applying the Soil & Water Assessment Tool (SWAT) to predict the environmental impact of climate change and land use; and the Hydrologic Engineering Center's River Analysis System program (HEC-RAS) to perform mobile bed sediment transporting computations with flow series data.

