


 English (pdf)
 Article in xml format
 Article references
 Send this article by e-mail
 Cited by SciELO
  Cited by Google
  Similars in
SciELO
Similars in
SciELO  Similars in Google
 Permalink
Introduction
Land degradation defined by FAO-UNESCO as the loss of its current and / or potential capacity to provide goods and services, is one of the major international concern. That is how the United Nations points out that it is one of the biggest challenges for the sustainability of food production and water supply in the 21* century (Gabriel, 2017), where agricultural practices and inappropriate land use have been the main causes of accelerated erosion in many developing countries (IAEA, 2015). The tropics are one of the most affected areas where water and wind erosion are the most contributing factors, with reported values of 915 x 106 and 474 x 106 degraded hectares, respectively (Lal, 1994; Velasquez el at., 2007).
Erosion is understood as the process that involves the detachment, transport and deposition of soil particles (Blanco-Canqui et al., 2016). In this regard, it is estimated that between 25.000 million and 40 billion kilograms of soil surface layer are eroded each year, and if this trend continues, it could represent losses of1.5 million square kilometres of land suitable for agriculture by 2050 (FAO, 2019). Colombia is no exception, since almost half of the soils are prone to erosion (IDEAM & UDCA, 2015), but the problem is aggravated if one considers that, of the 53.6 million hectares intervened in the country, 32,7 million have an inappropriate use (IGAC, 2019), which puts their productive capacity at risk.
In Colombia, the high vulnerability to erosion is not only favored by its geomorphological and climatic characteristics (IDIGER, 2019) (Rivera et al., 2010), but also by processes such as deforestation, soil cover removal, excessive tillage, poorly designed irrigation or drainage channels, and roads without adequate works (IDEAM & UDCA, 2015). Likewise, it has been pointed out that the highest degradation rates appear with tillage practices in favor of the slope (Sagredo, 2005), and when intense rainfall impacts bare soils with low structural stability (Castillo, 2004).
According to the national study of soil degradation in Colombia, conducted by IDEAM in 2015, Valle del Cauca is one of the departments most affected by the severity of erosion, whose figure corresponds to 5,4%, and this is mostly explained by the broad extension of the hillside area that it has (970,702 ha), with soils mainly corresponding to inceptisols, andisols, entisols and alfisols (CVC, 2013), the vast majority of which are susceptible to erosion (Tafur et al., 2006). In this regard, in the Dagua river basin, one of the main agricultural activities in hillside areas is pine growing (Loaiza et al., 2012), so most of its soils have been used for this crop, which is generally established on any type of soil and slope, without considering how vulnerable the soils are to erosion due to the topography of the land and how aggressive the rains are.
In addition to this, farmers, in order to avoid the occurrence of certain diseases related to high humidity, sow pineapple as a clean crop (absence of plant cover), establish it in favor of the slope and worse still do not use conservation practices, which favors erosive processes and the decrease of productive potential (Gómez et al., 2006) (Montiel, 2015) (Rivera et al., n.d). Thus, erosion losses have been reported in pineapple soils of 49 to 142 t/ha/ year, data corresponding to severe erosion (Álvarez & Peña, 2013). Likewise, it has been found that in low fertility soils, the decrease in nutrients N, Fe and Zn, as well as organic matter, has been considerable (García, 2008), so that the productive potential of these soils in areas of high precipitation could fall in less than 20 years (Quijandria et al., 1997). Thus, in pineapple growing municipalities such as Dagua with slopes greater than 20% (Chaparro et al., 2012), heavy rains have induced landslides for many years (Lozano, 2000), and the appearance of gullies have been reported (Rivera et al., n.d).
Currently, the largest producer of pineapple in the department is the municipality of Dagua, since for the year 2018 a production of 46,680 t, was reported. Then there are the municipalities of Restrepo with 35,700 t, Vijes with 14,400 t, and La Cumbre with 14,179 t (AGRONET, 2019). Therefore, the objective of this study is to identify the susceptibility to erosion risks in soils of the main pineapple producing municipalities, located in hillside areas of the Valle del Cauca department, based on climatic and geomorphological characteristics (rainfall erosivity and the slopes). This work is a tool to determine in which areas to sow and what type of management should be given to soils and crops to avoid degradation.
Materials and methods
The present work was carried out on an area located in the Valle del Cauca, whose geographic coordinates of the centroid are 3°40'34.324" N and 76°39'20.266" W, which covers the municipalities of Dagua, Restrepo, La Cumbre and Vijes, as the main pineapple producers of the department.
The study area has a surface area of 138,800,885 ha, of which 61.38% corresponds to the municipality of Dagua, 14,45% to the municipality of Restrepo, 16% to the municipality of La Cumbre and 8,17% to the municipality of Vijes, being mostly in a mountain area, according to the basic secondary information of the thematic cartography (geomorphology) of the Regional Autonomous Corporation of Valle del Cauca (CVC). Politically, the territory is divided into 52 districts, in which agricultural exploitation activities are mainly carried out (Loaiza et al., 2012) (Gonzalez et al., 2016).
The geographic information was provided by the CVC (2013), and is available in the corporate geographic advanced viewer, while the base mapping was downloaded from open data of the Agustín Codazzi Geographic Institute (IGAC).
The precipitation of the study area was characterized by historical information available in thirteen (13) meteorological stations belonging to the CVC, which have started operating in several years ranging between 1966 and 1986, currently remaining active (Table 1).
Table 1 Location of the CVC weather stations.
| Name | Municipality | Basin | Coordinate | Start date | |
|---|---|---|---|---|---|
| X | Y | ||||
| Aguacatal-Montebello | Cali | Cali | 1058549.999 | 877405.6117 | Jun-30-1969 |
| Buenos aires | Yotoco | Yotoco | 1071854.129 | 916464.6178 | May-31-1971 |
| Costa rica | Ginebra | Sabaletas | 1094047.494 | 907024.5997 | Feb-28-1975 |
| Dagua | Dagua | Dagua | 1043265.57 | 895668.4842 | Oct-31-1983 |
| Dapa | Yumbo | Arroyohondo | 1058101.811 | 885462.6364 | May-31-1971 |
| Diguita | Dagua | Anchicaya | 1033515.712 | 882755.42 | Mar-31-1971 |
| Guachazambolo | Palmira | Guachal | 1070380.2995 | 878515.6218 | Mar-31-1973 |
| Matapalo | Palmira | Guachal | 1071509.964 | 887218.9652 | Sep-30-1972 |
| Riobravo | Calima | Calima | 1058104.345 | 930664.9313 | Mar-31-1966 |
| San Pablo | Cali | Cali | 1050759.763 | 880677.3158 | Nov-30-1969 |
| San Vicente | Jamundí | Jamundí | 1050137.334 | 853301.2787 | Apr-30-1971 |
| Triana | Buenaventura | Dagua | 1030107.961 | 918238.2662 | May-31-1982 |
| Yumbillo | Yumbo | Yumbo | 1058618.72 | 887682.2518 | Mar-31-1986 |
Rainfall erosivity
The Dagua river basin, according to a study carried out by the University of Valle (2016), has been morphogenetically cataloged as a "hydrological system with rapid response and torrential characteristics", which presents precipitation levels that range from 900 to 8.000 mm / year, an aspect that contrasts with the high soil losses, because of the steep slopes, typical of the region (Aguirre et al., 2017). On the other hand, the area presents a monomodal rainfall regime, with a period of intense rainfall between the months of April and December, and a period where rainfall decreases, between the months of January-February-March, where the lowest value of average precipitation occurs in the month of March, while the maximum value is recorded in October (CVC, 2017).
The modified Fournier Index (MFI) was used to calculate the rainfall erosivity, which corresponds to the monthly average proposed by Arnoldus (1977) (Equation 1), and which has been widely used in the Colombian coffee zone (Ramirez et al, 2007; Echeverri & Obando, 2010; Lince & Castro, 2015). Once the MFI values were obtained, they were replaced as an independent variable to get the EI30 values, as suggested by Ramirez et al (2007) (Equation 2). For Equation 2 the average MFI values were used.
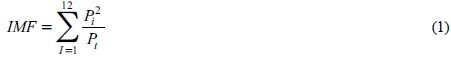
Where:
MFI = modified Fournier Index (mm)
Pi = Average monthly rainfall (mm)
Pt = Average annual rainfall (mm)
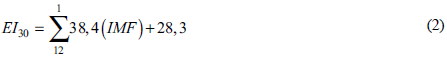
Where:
MFI = modified Fournier Index in mm
EI30 = Erosivity in MJ.mm.ha-1
The MFI and R classification (IE30) are presented in Tables 2 and 3.
Table 2 MFI classification. Source of consultation: Apaydin et al, 2006.
| MFI | ||
|---|---|---|
| Class | Rank | Classification |
| 1 | <60 | Very low |
| 2 | 60-90 | Low |
| 3 | 90-120 | Moderate |
| 4 | 120-160 | High |
| 5 | >160 | Very high |
Source of consultation: Rivera and Gomez, 1991.
Table 3 The classification of R (IE30).
| Class | Erosivity R (Mj.mm.ha-1) | Classification |
|---|---|---|
| 1 | <1.000 | Natural |
| 2 | 1.000-2.500 | Very low |
| 3 | 2.500-5.000 | Low |
| 4 | 5.000-7.500 | Moderate |
| 5 | 7.500-10.000 | High |
| 6 | 10.000-15.000 | Very high |
| 7 | 15.000-20.000 | Severe |
| 8 | >20.000 | Extremely severe |
The method of spatial autocorrelation taken into account for the spatialization of the R factor was the regularized spline, using erosivity records. The precipitation data are not found with a normal distribution, due to the limited existence of monitoring stations, therefore, it is necessary to use trend analysis such as the statistical method and non-parametric regression "regularized spline". This method allows spatially visualizing the spatial distribution of precipitation in the study area in a smoothed way, achieving a better understanding of the distribution of precipitation in space for the given temporality, since it adjusts functions by portions to groups of data, producing a surface with minimal curvature.
For this purpose, the ArcGis software and the geostatistical analyst extension were used.
Topographic factor
For the preparation of the slope map, a Digital Elevation Model (DEM) taken from ALOS PALSAR was used, with a resolution of 12.5 m and radiometric correction. The geoprocesses were carried out to determine the slope map.
The topographic factor calculation (L and S) was made based on the expressions proposed by Renard et al (1997) and Desmet and Govers (1996). For this purpose, a reclassification was carried out on the slope map, and specifically for the length of the slope (L), a DEM fill was used, from which it was possible to obtain a slope raster (degrees), used to create the factor with Equations 3, 4 and 5:
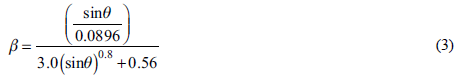
Where:
θ = It is the angle of the slope expressed in degrees.
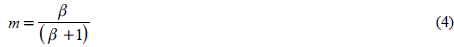
Subsequently, the B factor was obtained, using the raster calculator tool, and with these results it was possible to find the M factor, from Equation 4:
The L factor was calculated by Equation 5:
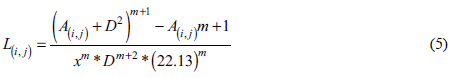
Where:
A (i, j) [m] = is the unit input area to the input of a pixel (cell).
D = is the size of the pixel.
X = is the form correction factor.
On the other hand, for the calculation of Factor S, Equation 6 was used:
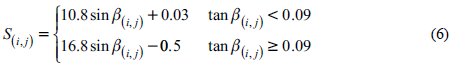
Where:
S (i, j) = Slope of the coordinate factor (i, j)
B (i, j) = Slope (degrees) with the coordinates (i, j)
When obtaining the sub-factor raster of (S), the slope of the terrain will be found. After calculating L and S separately, the LS factor is found.
Areas susceptible to erosion risks
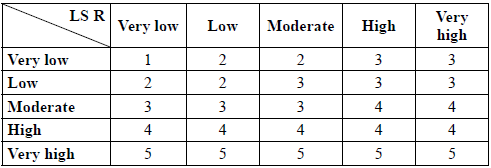
Once the maps of the rainfall erosivity and the topographic factor were obtained, these were used as input to establish the areas susceptible to erosion risks. To this end, the categories of very high and severe rainfall erosivity were unified, and were grouped into a single class (very high), the above with the purpose of generating five classification criteria that are comparable with those obtained for the topographic factor. Based on these criteria, vector analysis was carried out, and an overlay of maps to obtain the map of susceptibility to erosion risks based on rainfall erosivity and topographic factor, classifying them through a decision matrix into five variables which are: very low (1), low (2), moderate (3), high (4) and very high (5) (Table 4).
Results and Discussion
Modified Fournier Index (MFI)
The modified Fournier index presented average values ranging between 87,79 and 582,79, which according to the classification proposed by Apaydin et al (2006) correspond to a low and very high MFI classification. Likewise, it is evident that the high erosivity values extend covering the entire northwestern to southwestern area of the study area, corresponding mainly to the municipality of Dagua.
From the historical analysis of the monthly precipitation data for the different weather stations, it was found that only Matapalo showed low MFI values (87, 79), the rest of the stations presented values that range between (91,31 and 582,79), which are part of the moderate, high and very high categories (Table 5).
Table 5 Distribution of the MFI and the R factor.
| Name | Municipality | MFI total | classification | (MJ.mm.ha-1) | classification |
|---|---|---|---|---|---|
| Aguacatal-Montebello | Cali | 116.57 | Moderate | 4815.94 | Low |
| Buenos Aires | Yotoco | 141.70 | High | 5780.81 | Moderate |
| Costa Rica | Ginebra | 174.65 | Very high | 7046.01 | High |
| Dagua | Dagua | 103.03 | Moderate | 4296.07 | Low |
| Dapa | Yumbo | 123.37 | High | 5076.91 | Moderate |
| Diguita | Dagua | 260.65 | Very high | 10348.45 | Very high |
| Guachazambolo | Palmira | 91.31 | Moderate | 3845.74 | Low |
| Matapalo | Palmira | 87.79 | Low | 3710.80 | Low |
| Riobravo | Calima | 241.73 | Very high | 9622.12 | High |
| San pablo | Cali | 143.11 | High | 5834.89 | Moderate |
| San Vicente | Jamundí | 259.01 | Very high | 10285.62 | Very high |
| Triana | Buenaventura | 582.79 | Very high | 22718.83 | Extremely Severe |
| Yumbillo | Yumbo | 109.78 | Moderate | 4555.30 | Low |
These values indicate that soils can be affected by intense climatic aggressiveness with rain as an erosive agent. Although, there are no studies reported in this type of analysis for the Valle del Cauca region, there are investigations carried out in areas of neighbouring departments such as Caldas and Quindio, in which data with similar categories to those found (Ramirez et al., 2009) (Echeverri & Obando, 2010) (Castro et al., 2017).
Rainfall erosivity
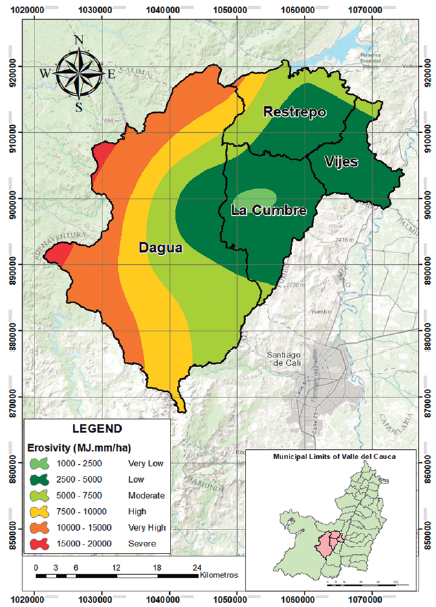
Values between 3710.8 MJ.mm.ha-1 and 22718.83 MJ.mm.ha-1 were found which, according to the classification of (Rivera & Gómez, 1991), correspond to erosion levels between low and too severe.
From the total of the study area, it was found that the municipalities of Restrepo, La Cumbre and Vijes showed, depending on the area, a rainfall erosivity mainly of low category. In contrast, Dagua presented severe, high and very high R values (Table 3). The graph presents a trend that shows an increase in R values as it approaches the western flank. An analysis based on the information available at the stations indicates that, of the thirteen evaluated, five presented low rainfall erosivity values (3710.8 MJ.mm.ha-1- 4815.9 MJ.mm. ha-1), and the rest were among moderate, high, very high and extremely severe values (5076.91 MJ.mm.ha-1 - 22718.83 MJ.mm.ha-1).
The results found are similar to those reported for some departments of the Andean area (Ramírez et al., 2009) (Castro et al., 2017) who primarily indicate erosivity classified as high and very high. These data are also consistent with the ranges indicated by Pacheco et al (2019) who reported erosivity values between 3162.12 and 12683.72 MJ.mm.ha-1 for an Ecuadorian tropical region and Liu et al (2020), who obtained average erosivity values for South America of 14378.64 MJ.mm.ha-1 between the years 1980-1999 and of 10273.67 MJ.mm.ha-1, between 2000-2017. Figure 1 shows the distribution of the R factor in the area.
Topographic factor
Figure 2 demonstrates that the highest values of the topographic index in the basin of the study area extend again from the northwestern zone to the southwestern zone, mainly covering the municipality of Dagua. This coincides with the upper part of the basin, that is, where the slopes that can reach 81° are located.
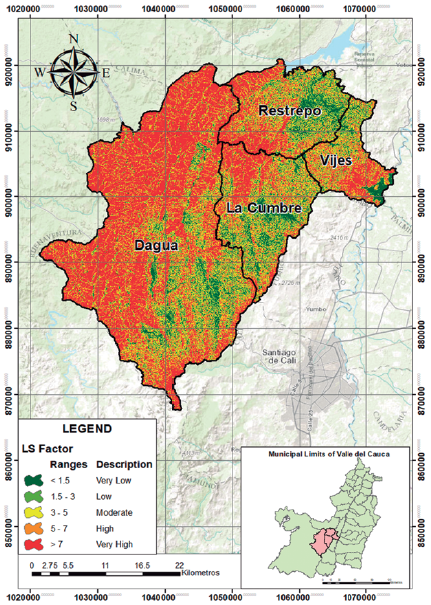
These results are consistent with that indicated by Cocuyame and Salazar (2015), who point out that the highest values of the topographic index are found on the steepest slopes of the Dagua river basin.
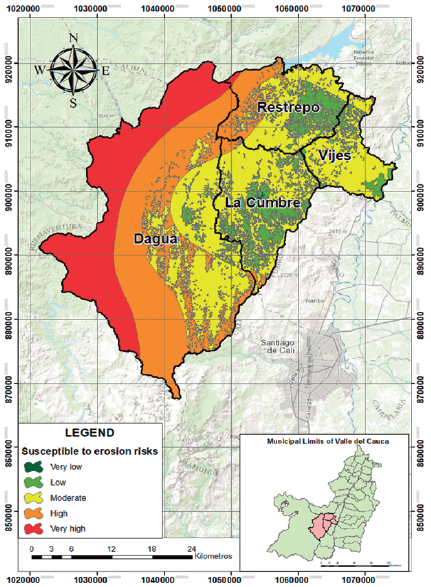
Map of susceptibility to erosion risks based on erosivity and Topographic factor
The map with the areas of susceptibility to erosion risks based on rainfall erosivity (R) and topographic factor (LS) is presented in Figure 3. The results indicate that of the four municipalities evaluated, Dagua has the highest susceptibility, the 74.46% of the area is under the high and very high categories, which corresponds to 63419.86 Ha, followed by Restrepo, where 77.38% of the area is under the moderate to high categories, which is equivalent to 15513.9 Ha, while most of the municipalities of Vijes and La Cumbre show moderate to low degrees of susceptibility to erosion risks, taking into account that it is a region with high slopes and intense rainfall with short return periods (Rivera et al., n.d) (Alarcón & Reyes, 2013).
Conclusions
The rains in the region that covers the main pineapple producing municipalities in the department of Valle del Cauca have high erosive potential, being more relevant in the area of influence of the climatic seasons of the municipality of Dagua.
Regarding the topographic factor, it is possible to notice that this index is higher towards the western flank of the study area, which corresponds mainly to the municipality of Dagua, which aggravates the processes of water erosion, and which in turn explains the behaviour of the high and very high susceptibility to erosion risks presented by this municipality. It is important to ensure the sustainability of productive systems; new practices must be implemented by farmers, leading to promoting soil conservation and thus reducing erosive processes.
It is relevant to promote practices such as maintaining a continuous vegetation cover, planting through the slope, the use of living barriers and ditches. Likewise, it is recommended to carry out studies that allow the determination of erosivity with the support of geographic information systems and the influence of the topographic factor at the department level, which will allow a better comparison and validation of the information regarding future researches.

