


 English (pdf)
 Article in xml format
 Article references
 Send this article by e-mail
 Cited by SciELO
  Cited by Google
  Similars in
SciELO
Similars in
SciELO  Similars in Google
 Permalink
Introduction
At present, with the rapid development of the industrial economy and the continuous development of tourist attractions, the point pollution and surface pollution in the river basin and around the scenic spot are increasing day by day. The water source of the scenic spot is affected mainly by the precipitation and runoff process, water and soil loss in the upper reaches, and the pollution brought by the surrounding areas of the scenic spot, which makes the pollution load of the scenic spot increase sharply and the water quality of the scenic spot deteriorate (Smith et al., 2018). Due to the prominent problem of eutrophication of water sources in tourist attractions, people pay more attention to the study of nutrients in surface runoff, while ignoring the threat of other heavy metal substances. The potential harmfulness of heavy metal pollution has brought serious threat to the water quality of water sources in tourist attractions. The accumulation of heavy metals in water sources not only directly affect the physical and chemical properties of water sources, reduce the biological activity of water sources, hinder the effective supply of nutrients, but also enter the food chain and groundwater through plant absorption and leaching, posing a serious threat to the ecological environment and human health (Liu et al., 2020). There is not only a problem of heavy metal pollution in surface water sources. There are prominent water quality problems in urban groundwater to varying degrees, and urban domestic pollution, industrial pollution, irrigation of farmland with untreated sewage and deterioration of geological conditions are the main causes of pollution (Wang et al., 2018). Therefore, the problem of heavy metal pollution in water sources of tourist attractions needs to be solved. In view of the prevention and control of heavy metal pollution in water sources, it is of great significance to accurately trace the source of heavy metal pollution in water sources of tourist attractions by using reasonable scientific research methods.
Tracing the source of heavy metal pollution in water sources of tourist attractions is to trace the sources of heavy metal pollutants in water sources of tourist attractions. It is the key technology and prerequisite for scientifically and accurately predicting the pollution of any water area. At present, great progress has been made in the study of pollution tracing. Liu et al. (2019) proposed a method for tracing thallium pollution in sediments of the Northern Pearl River Basin in South China. An improved IRMM sequential extraction procedure for selected depth profiles showed that the enrichment of thallium in geochemical flow components was extremely high. The near-range quantitative source analysis using lead isotope fingerprint technology showed that along the depth profile 80%~90% of the thallium pollution is from lead-zinc smelting waste. The results emphasize the key role of smelting activities in the discharge of large amounts of geochemical flow thallium into the sediments. Wang et al. (2018) proposed a method for tracing the source of heavy metal pollution in reservoirs in hilly areas of southern China, and studied the pollution characteristics, sources and health risks of soluble heavy metals in 19 representative reservoirs in hilly areas of southern China. The results show that due to the interference of human activities, the concentration of heavy metals in the studied reservoirs has great spatial heterogeneity. However, the pollution tracing error of the above methods is relatively large, and the evaluation accuracy of the tracing results is low.
In view of the above problems, a method based on GIS remote sensing is proposed to trace the source of heavy metal pollution in water sources of tourist attractions. Using GIS spatial analysis method, compiling remote sensing monitoring basin geographic information, using GPS to obtain longitude and latitude coordinates, positioning source of heavy metal pollution, designing plug-in application framework, integrating watershed geographic information and plug-in application framework, and building pollution tracing platform. Based on the analysis of the migration and transformation mechanism of heavy metal pollution in the water source of tourist attractions, the migration and diffusion coordinate system of heavy metal pollution in water sources is established. Through the migration, transformation and concentration of heavy metal pollutants in water source, the spatial-temporal distribution function model of heavy metal pollution in water source is constructed, and the error of tracing results of heavy metal pollution in water source of tourist attractions is obtained. The identification results of the proposed method are very close to the real value, and can accurately trace the source of heavy metal pollution in the water source of scenic spots. The tracing error is small, and the evaluation accuracy of the tracing results is high.
Geographic Information System
GIS is a computer technology system which takes the spatial data with geographical location attribute as the research object, takes the spatial database as the core, adopts the method of spatial analysis and spatial modeling, and provides various spatial and dynamic resources and environmental information timely. It is the product of the combination of traditional disciplines and modern science and technology, and a general technology for analyzing and processing massive spatial data (Kong et al., 2018). It can be used for dynamic description of spatial information, simulate and demonstrate the development and change process of things through space-time modeling, so as to provide services for scientific research, management and decision-making. Its biggest characteristic is that it can organically combine all kinds of information in social life with the graphic information reflecting geographical position, thus making it possible to solve complex spatial problems scientifically.
Global Positioning System
GPS is a system that uses GPS positioning satellites to locate and navigate the world in real time. It is called the global satellite positioning system. GPS is a kind of satellite navigation system with omni-directional, all-weather, all-time and high-precision developed by the U.S. Department of defense. It can provide global users with low-cost, high-precision three-dimensional position, speed and precise timing navigation information. It is an application model of satellite communication technology in the field of navigation. It greatly improves the information level of the Earth Society and effectively promotes the development of the digital economy.
Remote sensing technology
Remote sensing is a comprehensive technology of earth observation. In a broad sense, it refers to all non-contact remote detection, including the detection of electromagnetic field, force field, mechanical wave, acoustic wave, seismic wave, etc. In practical work, the detection of gravity, magnetic force, acoustic wave and seismic wave is classified as geophysical exploration, so only electromagnetic wave detection belongs to the category of remote sensing (Ahmed et al., 2018). In the narrow sense, it refers to the comprehensive detection technology that the electromagnetic wave characteristics of the target are recorded from a distance without contact with the detection target by using the detection instrument, and the characteristics and changes of the object can be revealed through analysis. Remote sensing technology can provide geometric and physical information of a large area and its surrounding environment in real time and quickly. The massive spectral information of ground observation provides accurate qualitative and quantitative data for target recognition and scientific law detection.
Platform design based on GIS plug-in and application framework
The construction of this platform adopts the design concept of application framework and is based on Arc GIS Engine Series products of Arc GIS company. The application framework has five main features: modularity, reusability, extensibility, simplicity and maintainability. The application framework can be logically divided into multiple levels and modules, so as to improve the aggregation of applications and reduce the coupling of applications. Each independent module communicates and interacts through a unified pipeline or protocol. When a module changes significantly, as long as its exit and entrance remain unchanged, the effectiveness and reliability of the system will not be affected. Extensibility is one of the significant characteristics of application framework, which means that the function of application framework has the ability to grow. The extensibility of framework enables us to realize different functions based on one platform and meet different functional needs.
Compiling watershed geographic information
In order to improve the effect of trace analysis of heavy metal pollution in water sources of tourist attractions, it is necessary to use GIS spatial analysis method to analyze water source direction through DEM elevation data monitored by remote sensing, so as to obtain complete and detailed water source data. Taking the water source basin of a tourist attraction as an example, the digital water source drainage network is extracted. The data source comes from the remote sensing elevation data obtained by the US space shuttle Columbia when it takes off. The data source covers more than 80% of the world and the whole territory of China (Xu et al., 2019). This article uses geographic information software for the Arc GIS series software released by ESRI, uses Arc GIS desktop version to process it, and stitches the two areas together to obtain a digital elevation map of a tourist attraction. Use the Hydrology hydrology analysis tool in Spatial Analyst Tools in the Arc GIS desktop system Toolbox to analyze, obtain the water source basin information of the entire tourist attraction, and complete the compilation of the basin geographic information.
Locate the source of heavy metal pollution in water sources
In order to trace the sources of heavy metal pollution in water sources of scenic spots more quickly and conveniently, it is necessary to calibrate the data of heavy metal pollution sources in water sources of scenic spots on the basis of the compilation of watershed geographic information. The longitude and latitude coordinates obtained by GPS are used to locate the source of heavy metal pollution in water sources, which provides theoretical support for the construction of water source heavy metal pollution tracing platforms. Through the actual investigation, combined with the census data of pollution sources, the names and coordinates of pollution sources were investigated. By using the add XY data tool in Arc GIS tools, the coordinates in the map coordinate system were automatically captured, the information of pollution sources was displayed, and each pollution source was marked according to the name. The GIS map built by the platform was obtained, and the location of heavy metal pollution sources in water sources was completed.
Design plug-in application framework
Because the whole pollution source tracing platform takes into account information query, pollution source tracing algorithm, geographic information positioning, decision support and other functions, its platform structure is complex and its requirements are changeable. Therefore, application development is a highly targeted work. The module design, hierarchical division, language selection and system deployment of the program all depend on the specific needs of the end user. In this paper, the plug-in programming is based on the interface. The framework program is established. The attributes and methods of each excuse are analyzed one by one. After analyzing all the interfaces, the plug-in and the whole framework are linked to complete the whole framework.
Integrating GIS plug-ins and frameworks
In order to further maintain the extensibility of the plug-in framework design, the plug-in set is encapsulated. After the plug-ins are written, they are compiled into the form of dynamic link library. Enter the dynamic link library file into the folder specified in the framework compilation. After the framework runs, it automatically traverses the dynamic link library plug-ins and interprets them on the framework to realize the corresponding functions.
Through the use of geographic information Arc GIS series software, the digital elevation map of a tourist attraction is obtained, and the hydrological analysis tool in Arc GIS is used to analyze the water source basin information of the whole scenic spot, and the geographic information of the river basin is compiled. Based on the longitude and latitude coordinates obtained by GPS, the source of heavy metal pollution in water source is located, and the plug-in application framework is designed. The plug-in set is encapsulated and compiled into the form of dynamic link library. The plug-in application framework is integrated to realize the construction of pollution tracing platforms.
Pollution characteristics and toxicity of heavy metals in water sources
Heavy metals in aquatic ecosystems are distributed in various components of the system, which have an impact on the components of aquatic ecosystems. When the accumulation of heavy metals in organisms reaches a certain degree, the symptoms of injury will appear, physiological obstruction, development stagnation, and even death. At the same time, the structure and function of the entire aquatic ecosystem will be damaged or even collapsed (Kang et al., 2019). The pollution characteristics are as follows:
(1) Trace heavy metals in natural water can cause biological poisoning. For example, the heavy metals cadmium and mercury can produce toxic effects only in the concentration range of 0.001-0.01mg/L.
(2) Heavy metals are enriched in organisms. The content of heavy metals in the food chain can be increased to tens of thousands of times in the last level of the food chain through the biological amplification of the food chain. Therefore, heavy metals may cause greater harm to people and the environment. For example, when the concentration of mercury in seawater is 0.0001mg/L, the mercury content in plankton reaches 0.01~0.002 mg/L, that in small fish is 0.2~0.5 mg/L, and that in large fish is 1~5 mg/L. the mercury content in large fish is 10000-60000 times higher than that in seawater.
(3) Not only can heavy metals not be degraded by microorganisms, on the contrary, certain heavy metal elements can be converted into metal organic compounds under the action of microorganisms. For example, the methylation process of mercury is to convert inorganic mercury into organic mercury through bacterial strains.
(4) There are various ways for heavy metals to enter the human body. For example, they can be ingested into the human body through breathing, drinking water, food, etc., which have toxic effects on human health. Due to the cumulative effect of heavy metals in the human body, some heavy metals often take decades to realize their harmful effects on the human body (Merino-Mascorro et al., 2018). In a word, heavy metals are potentially hazardous pollutants.
The water source is a dynamic, open and complex multi-phase system. The water environment medium, water quality physical and chemical factors are easy to affect the water source. The solid-phase material contains a large number of clay minerals, organic matter, metal oxides and their hydrogen oxygenates that can adsorb and invade its interior. The harm of heavy metals to the water environment will not show in a certain period of time, but when the environmental conditions of the water source change or the accumulated amount of toxic substances exceeds its bearing capacity, all kinds of ligands in the water source will suddenly activate to form chelates and chelates, thus causing serious ecological harm. The harm of heavy metals in water can be divided into three categories:
(1) It is harmful to aquatic organisms and organs.
(2) Algae, which are harmful to aquatic plants, play a very important role in the food chain of aquatic ecosystems. Once algae absorb heavy metals, they will cause disorder of their physiological function, growth and metabolism. The decrease of cytochrome and inhibition of photosynthesis lead to cell distortion, tissue necrosis and even poisoning death, which changes the composition and species of algae in the natural environment. Therefore, the sensitivity of aquatic organisms and algae is often used as a heavy metal pollution detector.
(3) Harmful to human health, heavy metals entering the human body are not easy to excrete and accumulate gradually, causing various and multi-level hazards to human health. Its toxicological effects are mainly manifested in the influence on the normal development of the fetus, reproductive disorders, and the reduction of human quality.
Migration and transformation mechanism of heavy metal pollution in water source
In order to effectively trace the source of heavy metal pollution in the water source of tourist attractions, it is necessary to study and analyze the migration and transformation mechanism of heavy metal pollutants in the water source of tourist attractions, master some laws of migration and diffusion of heavy metal pollutants in water sources of tourist attractions, and then, according to these laws, study and operate relevant mathematical tracing methods to realize the tracing and tracing of heavy metal pollution in water sources of tourist attractions.
Establishment of migration and diffusion coordinate system of heavy metal pollution in water source
After a heavy metal pollution event occurs, the heavy metal pollutants in the water source need to move for a period of time before they can be completely mixed in the water source. That is, any type of pollution must go through the following three mixing stages in sequence during this period to achieve complete mixing with the water source body:
(1) The mixing stage along the water depth in the water source, that is, the vertical mixing stage, has a range of influence called the near zone. The movement of pollutants in this area is particularly complex. The location of the pollution source, the form of discharge, and the hydraulics of the water body are the parameters. The main influencing factor of the mixing distance x in the direction of the water flow in the stage.
(2) From the completion of the first stage to the fully mixed stage of the water source, that is, the mixing stage, the intensity of the pollution source, water area conditions, and hydrological factors are the main factors affecting the mixing distance x2 and concentration distribution of the water flow direction in this stage.
(3) The area where the pollutants are fully mixed in the water source is the complete mixing stage, also known as the vertical mixing stage. The type and nature of the pollutants, the flow rate of the water source, and microorganisms are the main factors affecting the concentration changes in the area.
It can be seen that after heavy metal pollutants enter the water source, they show vertical, horizontal and vertical mixing zones as Figure 1.
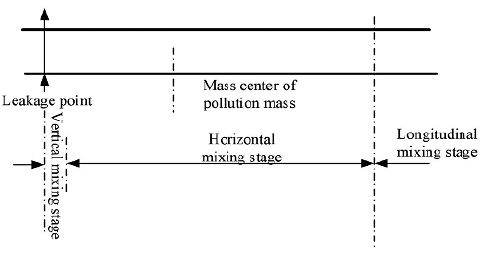
In Figure 1, the migration and diffusion patterns of pollutants in each mixing region are different. In order to accurately describe the migration and diffusion of pollutants in water source, the coordinate system of pollutant migration and diffusion should be constructed according to the mixing direction of pollutants after entering the water source. For example, the direction of migration and diffusion of pollutants entering the water source in the lateral mixing zone is the x direction, that is, the x direction is defined as the direction of water flow along the water source (Liu et al., 2018). The direction of migration and diffusion of pollutants in the longitudinal mixing zone is the y direction, that is, the y direction is defined as the direction perpendicular to the water surface. The direction of migration and diffusion of pollutants in the vertical mixing zone is the z direction, that is, the z direction is defined as the direction of gravity.
Through analysis, it is found that the pollutants are along the direction of the water flow (x direction). Because the thrust of the water flow is dominant, the migration of the pollutants in this direction is mainly carried out with the water flow. In the horizontal plane perpendicular to the direction of water flow (y direction), since the concentration of pollutants has a gradient, in this direction pollutants mainly migrate from areas with high concentrations to areas with low concentrations. Along the direction of gravity (z direction), due to the exchange of momentum, heat and mass between the pollutant and the water source, the migration and diffusion in this direction is more complicated, and the pollutant migration speed is affected by the size of the contact area between the pollutant and the water source.
Migration and transformation of heavy metal pollution in water source
Colloidal substances existing in natural water sources are deposited in suspended particulate matter of water sources. The main colloidal substances include organic and inorganic, including inorganic polymer compounds composed ofhydrated oxides and soil minerals, and organic polymer compounds composed of organic matter, humus and protein (Jia et al., 2020). Colloid has a huge specific surface area. Because of the surface energy and charge, a large number of ions can be adsorbed on the surface of various colloidal particles, such as pesticides and heavy metal elements in the water source, and a variety of physical and chemical reactions occur at the solid-liquid interface, which makes heavy metals transfer from aqueous phase to solid phase. Therefore, the migration and transformation of heavy metal ions are closely related to the existence of colloidal substances.
The migration and transformation of heavy metal ions transferred from liquid phase to solid phase water source are closely related to organic carbon, sulfide, pH, redox potential, carbonate, particle size, and primary minerals in sediment. Under the influence of these conditions, it has adsorption, coordination, precipitation and dissolution with the water source and the substances in the water source to realize the transformation of heavy metal ions in the water source. Therefore, heavy metal ions in the water source have complicated physical and chemical reactions. Therefore, the pollutants in the water source have the characteristics of position change and attenuation reaction in various forms under the joint action of water flow, gravity and various resistances, including push flow migration, dispersion dilution and transformation and migration:
(1) Push flow migration: also known as flow migration, refers to the behavior of pollutants moving in the x, y, z direction under the action of the water body after entering the water body. However, this migration behavior of pollutants only changes its spatial position in the water body, and does not reduce its concentration value. In general, if the pollutants in the water source only migrate with the flow, the product of the concentration of pollutants in the water body and the flow velocity component in the x, y, z direction is equal to the pollutant migration flux in the x, y, z direction, namely:

In formula (1), p x , p y , p z represents the flux of pollutants in the x, y, z direction, u x , u y , u z represents the water velocity component in the x, y, z direction, and C represents the concentration of pollutants.
(2) Dispersion and dilution: due to the uneven flow in all directions of the water source and the large gradient of pollutants entering the water source, the pollutants entering the water source will not only migrate in the flow direction, but also have diffusion behaviors such as molecular diffusion, turbulent diffusion or shear flow dispersion (Liu et al., 2019). Therefore, any type of pollutant entering the water source exists dispersion dilution, that is, dispersion dilution is a basic movement form of pollutant in water source.
Molecular diffusion: diffusion refers to the phenomenon that pollutants migrate to homogenization due to the existence of gradient, which is a common phenomenon after pollutants enter the water body. Among them, the molecular diffusion of pollutants refers to the phenomenon of random dispersion of pollutants caused by the irregular movement of pollutant molecules, that is, when the concentration of pollutants in water is not completely mixed, the pollutant molecules will move from the high concentration area to the low concentration area. Therefore, the molecular diffusion process of pollutants in water source obeys Fick's first law:

In the formula (2), I
x
, I
y
, I
z
represents the molecular diffusion flux in the x, y, z direction,  represents the concentration of heavy metal pollutants in the water source, E
M
represents the molecular diffusion coefficient of the pollutants, and the partial derivative term on the right side of the equation represents the concentration gradient along the x, y, z direction. The negative sign indicates that the diffusion of pollutant molecules is consistent with the negative concentration gradient.
represents the concentration of heavy metal pollutants in the water source, E
M
represents the molecular diffusion coefficient of the pollutants, and the partial derivative term on the right side of the equation represents the concentration gradient along the x, y, z direction. The negative sign indicates that the diffusion of pollutant molecules is consistent with the negative concentration gradient.
Turbulent diffusion: turbulence refers to the random pulsating diffusion of various physical quantities contained in any pollutant point in the water flow field with time variation. Turbulent diffusion, also known as turbulent diffusion, refers to the phenomenon of pollutant migration from high concentration area to low concentration area caused by turbulent field of water body. Its size is closely related to the whirling motion degree of water flow. Therefore, the turbulent diffusion law of pollutants in water source can be expressed by Fick's first law:

In formula (3), U x , U y , U z represents the turbulent diffusion flux of pollutants along the x, y, z direction, and E x , E y , E z represents the turbulent diffusion coefficient of pollutants along the x, y, z direction.
Shear flow dispersion: the pollutants entering the flowing water body are usually transported along with the water flow, and the dispersion coefficient is closely related to the average cross-section velocity and pollutant concentration (Ren et al., 2020). However, due to the influence of perimeter and water viscosity, the concentration and velocity distribution of pollutants on the same section are often non-uniform, that is, there will be shear stress and velocity gradient in the water source. Similarly, the first law can be used to characterize the mass flux of pollutants produced by dispersion:

In formula (4), O x , O y , O z respectively represents the pollutant diffusion flux generated by dispersion in the x, y, z direction, and D x , D y , D z represents the dispersion coefficient along the x, y, z direction. The difference between molecular diffusion and turbulent diffusion is that only after pollutants enter the water source does the shear flow dispersion occur, and the coefficient magnitude is generally 10~104m2/s.
(3) Transformation and transportation: Generally speaking, the pollutants that enter the water body are usually adsorbed by suspended substances such as sediment and aquatic organisms in the water body. The role of the water body makes the pollutant concentration in the water body change in time and space by means of aggregation, precipitation and resuspension, that is, the pollutant has a transformation and transportation effect in the water body type. Generally, different types of pollutants will be transformed and transported in different ways after entering the water source. For example, particulate heavy metal pollutants generally move with water in the form of ions, molecules or colloids dissolved in water. Dissolved heavy metal pollutants are transformed and transported through food chain. The insoluble pollutants such as Na, K, CI and F can only migrate with the flow because of no transformation and attenuation.
Speciation and bioavailability of heavy metal pollution in water source
Usually, the toxicity and bioavailability of heavy metals in water sources are studied together. The toxicity of heavy metals is closely related to the speciation of heavy metals in water sources. Therefore, the bioavailability of heavy metals in water sources also depends on their speciation.
Due to the variety of heavy metal forms, some of the heavy metals in the water source are easy to form insoluble hydroxides, carbonates and sulfides, and some of them can be transferred into the bottom water source through adsorption and polymerization with coarse particles. Therefore, the existing forms of heavy metals in water sources mainly include the following two aspects:
(1) The form of heavy metals in natural water and the form of heavy metals in water sources. Water source Water source can not only provide nutrients for aquatic organisms, but also store toxic substances. As an important part of the water environment, it is not only a carrier of water source pollutants, but also an indicator of water source pollution.
(2) The environmental behavior and toxic effects of heavy metals are not only related to the content of heavy metals, but also depend on the existing forms, migration and transformation characteristics and bioavailability of heavy metals in environmental media. Therefore, in the process of studying the pollution of heavy metals in water sources, simply analyzing the content of heavy metals can not truly reflect the pollution degree of heavy metals. Combined with its morphological analysis, the pollution level is comprehensively considered (Sun et al., 2018). Through the analysis of the form of heavy metals to study its geochemical process and toxic effect has a great role in promoting, based on this to evaluate its potential migration law and environmental hazards, so that the toxicity, bioavailability, chemical activity and re migration of heavy metals can be better revealed.
There are different forms of heavy metals in water sources, and their migration ability and toxic effects are quite different. Exchangeable state is easily dissolved in water or exchanged by other polar ions when environmental conditions change. Because of the instability of its existing form, it is an important part of water quality. Carbonate bound state is especially easy to re-enter the water source when the water source environment changes. The strong oxidation of iron will be partly released into the water source due to environmental changes. The organic state is relatively stable and is not easy to be absorbed and utilized by organisms. The residual form is the most stable of all forms, and it is not easy to release into the water environment for a long time. For organisms, the toxicity of metal elements in dissolved state is the largest, while that of particulate metal is relatively small. If a kind of compound which is completely insoluble in water can be formed and firmly bound in the water source, it will be safer and more ideal.
Tracing method of heavy metal pollution in water source
Taking the heavy metal pollution incident of water sources in tourist attractions as an example, a mathematical model that can grasp the relevant information of pollution sources is established, that is, tracing the source of heavy metal pollution in water sources of tourist attractions as Figure 2.
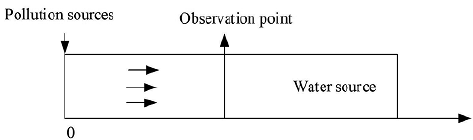
If the geometry of the water source canal remains unchanged, a number of observation points q. are arranged in the calculation area [0, L], and q(t) represents the pollutant concentration distribution function observed during the t period. Therefore, the tracking and tracing of such sudden water pollution is how to determine the model parameters, the location of the pollution source, the time of discharge and the intensity based on the known information. The migration and transformation equation of pollutants in sudden water pollution incidents can be approximated to:
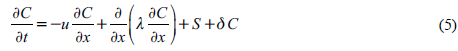
In formula (5), u represents the average water flow velocity of the water source, y represents the longitudinal dispersion coefficient of the water source, ò represents the attenuation coefficient of the pollutant in the water source, and S represents the source term of the pollutant in the water source.
If F = 0 is used to represent the location of the pollution event, and the water source area [0, L] is taken as the research object, the pollutants entering the water source section will move with the flow, longitudinal dispersion and attenuation under the combined action of water flow and shear force. If it is assumed that the pollutant concentration of the upstream inflow and downstream outflow of the research object are both 0, then:
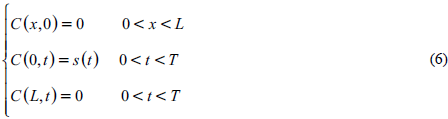
In formula (6), s(t) represents the intensity of pollutants entering the canal. To construct a water source heavy metal pollution tracing model based on the above formula, that is, the time and space distribution function model of heavy metal pollutants in water sources is:
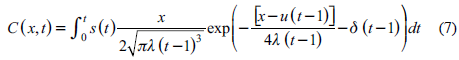
In addition, due to the accident site, monitoring equipment, sampling, etc., there is an observation error in the pollutant concentration observation sequence value q(t ), and this error plays a decisive role in the accuracy of the tracing result. Therefore, the pollutant concentration time series value of the observation point can be expressed as:

In the formula (8), q j,noisy . , q j,exact , represents the observation value with error and the accurate observation value, ε represents the error level, ω represents a set of random numbers conforming to the standard distribution, and m represents the number of observations. The error of the tracing result of heavy metal pollution in this type of water source can be expressed as:
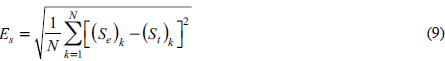
In formula (9), E S represents the error value of water source heavy metal pollution tracing results, S t represents the actual value of water source heavy metal pollution tracing, S e represents the tracing result ofwater source heavy metal pollution, and N represents the output number of water source heavy metal pollutant emission intensity and water source heavy metal pollutant concentration spatial and temporal distribution. Through the above steps, according to the mixing direction of pollutants entering the water source, the migration and diffusion coordinate system of heavy metal pollution in the water source is established. Through the migration, transformation and concentration of heavy metal pollutants in the water source, the spatial-temporal distribution function model of heavy metal pollutants in the water source is constructed, and the tracing error of heavy metal pollution in the water source of tourist attractions is obtained.
Overview of the study area
The research area is a tourist attraction with a total water source of about 6km. The terrain belongs to the typical low mountain and hilly area. The terrain in the study area fluctuates greatly. The general trend of the terrain is high in the southeast and low in the northwest. The basic landform is erosion erosion landform, denudation landform and accumulation landform.
The average altitude of the scenic spot is 1000~1500m, and the total area of the scenic spot is 16,400 km2. The climate of the tourist attraction is a typical warm temperate zone and semi-humid continental monsoon climate with four distinct seasons. Summer is hot and rainy, winter is cold and dry, and spring and autumn are short. The annual average temperature is 13.6 °C, the annual frost-free period is 180~200 days, and the annual average rainfall is 624.8mm.
Data acquisition and processing
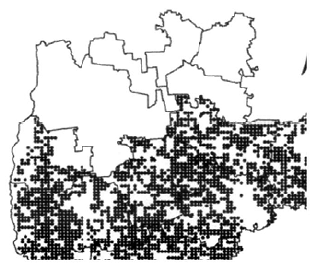
In this study, SPSS13.0 was used for basic statistical analysis, GS7.0 was used to analyze the spatial variability of heavy metal content data. Spatial interpolation module of Arc GIS desktop 9.2 software was used to make and output the distribution of heavy metal index sample points in water source, as shown in Figure 3.
The samples were dried in a vacuum freeze dryer. The dried samples were filtered with a 4-mesh standard screen to remove the large stones, garbage and other debris, and then sealed in a dry and clean self sealing bag. Put the appropriate amount of sample into agate mortar and grind it through 100 mesh sieve. Mix the screened samples evenly, put them into self sealed bags and label them. After that, the samples were placed in a refrigerator at 4 °C and kept away from light to avoid the degradation of light and microorganisms and ensure the reliability of the samples. Take a proper amount of treated sample, continue to grind and make it pass through 200 mesh screen. These samples are used to determine the speciation of heavy metals.
Analysis of human disturbance on heavy metal elements
Coefficient of variation is a variable that describes the spatial distribution. Through the study of the coefficient of variation, we can understand the volatility of heavy metal content changes, and then analyze the degree of heavy metal pollution by human beings. The larger the coefficient of variation is, the greater the degree of heavy metal pollution is affected by human beings. That is to say, heavy metals with obvious external pollution can be identified and analyzed. Its calculation formula is as follows:
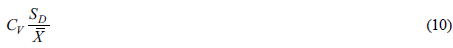
In formula (10), S D represents the standard deviation of the sampled sample, and X represents the sample mean. The classification of the degree of variation is shown in Table 1.
Table 1 Classification of variation degree
| Coefficient of variation | Degree of variation |
|---|---|
| <15% | Low variation |
| 15%~36% | Moderate variation |
| >36% | High variation |
The coefficient of variation of heavy metal elements in water sources of tourist attractions is as Table 2.
Table 2 Variation coefficient of heavy metal elements in water sources of tourist attractions
| Heavy metal elements | Coefficient of variation | Degree of variation |
|---|---|---|
| Zn | 56.24% | High variation |
| Cd | 96.29% | High variation |
| Cu | 66.54% | High variation |
| Cr | 16.87% | Moderate variation |
| Ni | 43.09% | High variation |
| Pb | 58.35% | High variation |
According to the data in Table 2, the order of variation coefficient of heavy metal elements in water sources of tourist attractions is Cd > Cu > Pb > Zn > Ni > Cr. Except for Cr, the other metal elements are highly variable, especially Cd, with a coefficient of variation of 96.29%, indicating that its spatial distribution is extremely uneven and highly interfered by human beings.
The variation coefficient of heavy metal pollution elements in water sources of tourist attractions is as Table 3.
Table 3 Variation coefficient of heavy metal pollution elements in water sources of tourist attractions
| Heavy metal elements | Coefficient of variation | Degree of variation |
|---|---|---|
| Pb | 32.24% | Moderate variation |
| Ni | 56.48% | High variation |
| Cu | 56.87% | High variation |
| Zn | 46.09% | High variation |
| Cr | 73.62% | High variation |
| Cd | 68.35% | High variation |
The order of variation coefficient of heavy metal pollution elements in water sources of tourist attractions is Cr > Cd > Cu > Ni > Zn > Pb. Except for Pb, the variation of other elements is high. The variation degree of Ni and Cu is 56%, while that of Cr and Cd is about 70.5%. Therefore, Ni-Cu and Cr-Cd have certain similarities in spatial distribution.
Compared with the data in Table 2 and table 3, the results of coefficient of variation of Cr and Pb are quite different. In the analysis of the coefficient of variation of heavy metal elements in the water source of tourist attractions, Cr belongs to moderate variation, while in the variation coefficient table of heavy metal pollution elements in tourist attractions, it is highly variable. The coefficient of variation of heavy metals in water sources of tourist attractions is 58.35%, but the variation coefficient of heavy metals pollution in water sources of tourist attractions is the lowest, only 32.24%. The results show that the concentration of Pb in the sediment of water source polluted by heavy metals in scenic spots is relatively close, and the concentration of Pb does not exceed the national secondary standard and remains at a low level. It can be concluded that the discharge of heavy metal pollution in the water source of tourist attractions is not the main source of Pb pollution. The reasons for the difference are: Based on the principle of average distribution, the sampling results reflect the overall pollution status of water sources in a long period of time, while for the heavy metal pollution of water sources in tourist attractions, the samples are taken after field investigation. The nature of heavy metal pollution elements in water sources of tourist attractions depends on the types of pollution sources. Therefore, the results of the coefficient of variation are quite different.
Correlation analysis of heavy metal elements
Generally, there is a significant correlation between heavy metals as one of the sources of heavy metals. Therefore, in order to find homologous heavy metals, it is necessary to carry out correlation analysis. The specific steps of correlation analysis are as follows:
(1) Perform Z-Score standardization on all data first to prevent interference with the analysis results due to the difference in concentration of different types of heavy metals.
(2) The correlation analysis of heavy metals and organic matter content (LOI) was carried out.
(3) In order to ensure the accuracy of the correlation analysis results, the bilateral significance level test was carried out on the correlation analysis results.
The results of correlation analysis of heavy metal elements are as Table 4. The results of the significance level test are as Table 5.
Table 4 Correlation analysis results of heavy metal elements
| Z-Score (Ni) | Z-Score (Cu) | Z-Score (Zn) | Z-Score (Cr) | Z-Score(Cd) | Z-Score(LOI) | |
|---|---|---|---|---|---|---|
| Z-Score(Ni) | 1.000 | |||||
| Z-Score(Cu) | -.045 | 1.000 | ||||
| Z-Score(Zn) | -.045 | .768 | 1.000 | |||
| Z-Score(Cr) | .517 | -.287 | -.405 | 1.000 | ||
| Z-Score(Cd) | .058 | .187 | -.108 | .385 | 1.000 | |
| Z-Score(LOI) | .479 | .139 | .167 | -.175 | .195 | 1.000 |
Table 5 Significance level test results
| Z-Score(Ni) | Z-Score(Cu) | Z-Score(Zn) | Z-Score(Cr) | Z-Score(Cd) | |
| Z-Score(Ni) | |||||
| Z-Score(Cu) | .872 | ||||
| Z-Score(Zn) | .839 | .002 | |||
| Z-Score(Cr) | .047 | .294 | .135 | ||
| Z-Score(Cd) | .848 | .503 | .713 | .165 | |
| Z-Score(LOI) | .093 | .634 | .578 | .548 | .487 |
According to the results in Table 4 and Table 5, there is a certain positive correlation between Ni and Cr, the correlation coefficient is 0.517, and the p value in the test results is 0.048 (< 0.05), so the two are significantly positive correlation. The correlation coefficient of Cu and Zn is 0.78, and their significance level is 0.01 (< 0.05), which means that the positive correlation between Cu and Zn is extremely significant and the homology is very strong. There is a positive correlation between Ni and organic matter content, but their significance level is 0.095 (> 0.05), which indicates that organic matter content has a certain influence on Ni, but it is not the main influencing factor.
Trace error analysis of heavy metal pollution
In order to verify the effectiveness of the tracing method of heavy metal pollution in tourist attractions based on GIS remote sensing, it is assumed that the error follows the Gaussian distribution a = 0.01, and the pollution source parameter G=(x1, x2, s , s2) is uniformly distributed and independent of each other. Among them, x1, x2 obeys uniform distribution H(0,100), s1, s2 obeys uniform distribution H (0,10). Using the proposed method, the Liu et al. (2019) method and the Wang et al. (2018) method for iterative calculation, the tracing errors of different methods are obtained as Table 6.
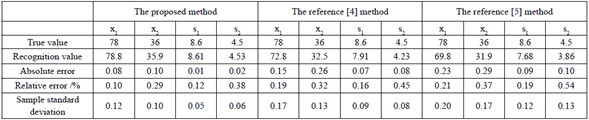
According to the data in Table 6, the absolute error, relative error and standard deviation of the proposed method are less than 0.2%, 0.4% and 0.15 respectively, and the absolute error, relative error and standard deviation of pollution source intensity are less than 0.02%, 0.4% and 0.06 respectively, and the tracing value is in good agreement with the real value. It can be seen that compared with the Liu et al. (2019) method and the Wang et al. (2018) method, the tracing identification result of the proposed method is very close to the true value, and the accuracy of the prior distribution of the unknown parameter is higher under the same random sampling frequency. The tracing error is smaller, and the tracing assessment accuracy is higher.
Conclusion
This paper proposes a method based on GIS remote sensing to trace the source of heavy metal pollution in the water source of tourist attractions, which can accurately trace the source of heavy metal pollution in the water source of tourist attractions, with small tracing error and high accuracy of tracing results evaluation. However, it has not formed a clear definition of the trace source of heavy metal pollution in water sources, and lacks a set of systematic and complete tracing theory. Therefore, a clear and complete tracing theory is proposed in the next research to provide more accurate theoretical and methodological support for the tracing and tracing of heavy metal pollution in water sources.

