


 English (pdf)
 Article in xml format
 Article references
 Send this article by e-mail
 Cited by SciELO
  Cited by Google
  Similars in
SciELO
Similars in
SciELO  Similars in Google
 Permalink
Introduction
The site specific ground response study requires the soil parameters of thickness, density, and shear modulus of each layer as inputs. The soil type and thickness of each layer are generally obtained by drilling boreholes and logging the borehole information. The in-situ soil densities of each layer are usually obtained from the undisturbed soil samples collected in boreholes. In most cases, the G max for site response analysis is evaluated using relationships based on the standard penetration test (SPT) N values. There are many available regression equations between N values and small strain shear modulus in literatures for different soils by different researchers.
The existing correlations were developed by Imai and Yoshimura (1970), Ohba and Toriumi (1970), Ohta et al. (1972), Ohsaki and Iwasaki (1973)), Hara et al. (1974), Imai and Tonouchi (1982), Seed et al. (1983, 1986) and Anbazhagan and Sitharam (2010). Most of the old correlations are listed in the popular text book of Kovacs (1981) and Kramer (1996). Kovacs (1981) has presented the summary of SPT-N values and G max correlations based on the above first five research works. Kramer (1996) has modified the correlation developed by Imai and Tonouchi (1982) for a sandy soil by replacing the measured N values with energy corrected N values (N 60 ).Seed et al. (1983) presented the correlation based on their previous studies. Seed et al. (1986) have presented G max correlation based on the Ohta and Goto (1976) data. Correlation proposed by Seed et al. (1983, 1986) and Kramer (1996) is being used in SHAKE2000 site response software to estimate the shear modulus from the SPT-N values. A correlation by Anbazhagan and Sitharam (2010) is a recently developed one, after 27 years of gap. This paper presents the summary of the above correlations and comparisons. A new correlation has been developed considering the measured old and new data from Japan and India, where N values are measured with hammer energy of 78%. The modification factor for old and new correlations is suggested for other regions, where the SPT-N values are measured with different hammer energies.
These relationships are region specific, which depends on the type and characteristics of the soil in the respective region. It is not reasonable to use existing correlations to obtain shear modulus for ground response studies without considering local soil condition. Hence, in this paper an attempt has been made to develop a relationship between SPT-N value and G max considering SPT and SCPTU data from Su-Xin expressway, China, where is rich in the content of silt.
In this paper the small strain shear modulus is measured using the shear wave velocity obtained from SCPTU and in situ density from undisturbed soil samples obtained at the same depth in the corresponding boreholes. These values are used to generate a correlation between SPT measured and corrected N values and G max . The developed relationships are compared with a similar relationship available in the literature.
Small Strain Shear Modulus
The stiffness of a body (or structure) is defined as the resistance of that body to deformation under applied force (Abbiss, 1979). It is derived from: (a) The shape of the body; (b) Boundary conditions, such as fixities and load positions; (c) The stiffness properties of the constituent materials (shear modulus, etc.) (Anderson, 1978).
Thus, deformation depends upon stiffness, which in turn depends on the stiffness properties. Then the subject of this paper is how to estimate stiffness (small strain shear modulus). In geotechnical engineering practice stiffness is normally defined within the context of the mathematical theory of elasticity, although this is not strictly necessary.
Tests on reconstituted materials have shown the important influence that "state" (void ratio, current effective stresses) and stress history can have on stiffness (Ballard, 1975; Burland, 1989; Cai et al., 2014). The shear modulus of a granular material at very small strain levels is affected fundamentally by three factors: (a) The void ratio of the specimen; (b) Inter particle contact stiffness, which will depend upon particle mineralogy, angularity and roughness, and effective stress; (c) Deformation and flexing within individual particles, which will depend on particle mineralogy and shape.
The shear modulus at low strain level for soil layers has been determined using shear wave velocity from SCPTU and density from undistributed soil samples using the following equation (Abbiss, 1979)

where p is density measured from the undisturbed sample and, Vs is shear wave velocity measured using the SCPTU. G max has been evaluated for corresponding depth of N values in the respective locations.
A great many techniques exist from which stiffness parameters can be derived, ranging from the "simple" SPT to the sophisticated self-boring pressuremeter. This paper considers a limited selection of more unusual techniques, based on the author's experience and belief that they will have value in many situations (Clayton, 2011; Matthews, 2000; Gordon, 1997). In particular, two classes of test are reviewed: the first one is traditional seismic testing consisting three tests, (a) continuous surface wave testing, (b) down-hole geophysics, (c) cross-hole geophysics; another one is advanced seismic testing including seismic piezocone penetration test (SCPTU) and multichannel analysis of surface wave (MASW)
In this paper, the shear wave velocity (Vs) is measured by seismic piezocone penetration test (SCPTU).
Site Description
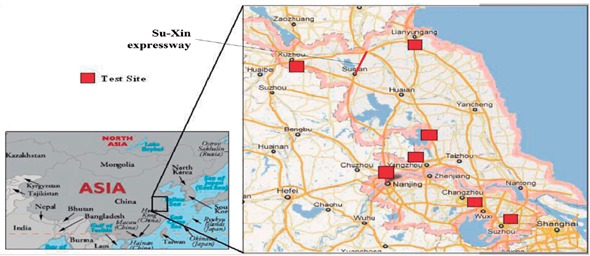
In this paper the Su-Xin expressway (Jiangsu) is as a basic project. The expressway from Suqian to Xinyi is an important part of expressway network planning in Jiangsu province, where the location of Su-Xin expressway is shown in Figure 1. This construction has a very vital significance to improve the road network layout structure of the transport corridor in Jiangsu province and share responsibility for the Beijing-shanghai expressway traffic flow. Test section is located at the first section in Su-Xin expressway: K7+630~ K7+730. The handled length in K7+630~ K7+710 is 80 m, while the width is 40m and the gross area is 3200 m2; the handled length in K7+710~ K7+730 is 20 m, while the width is 40 m and the gross area is 800 m2.
The testing site is nearby Luoma Lake with a distribution of many rivers and flat terrain. The main geological structure is Tancheng-Lujiang fault zone which is still active. The seismic intensity is about 8 in such intra-regional. The geomorphic types of testing sites are principally the alluvial plain of the waste of the Yellow River, rolling plain and scattered denudation monadnock. The soil of this location is almost unconsolidated quaternary sediment. The ground surface is recent artificial miscellaneous fill and cultivated soil, below which is silt and silt sand. The groundwater level in winter is 3.8m.
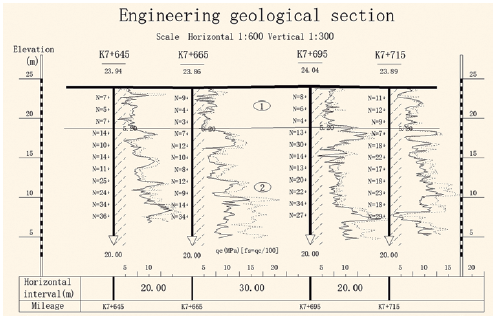
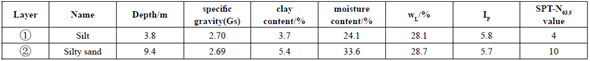
Based on the research content in this paper the supplementary investigation was been made in the testing site to get more valid data. According to the supplementary investigation, the soil layer of this location roughly divided into four levels from top to bottom, which can be obtained by Figure 2. Table 1 gives the main physicomechanical indexes of soils
Geotechnical Data
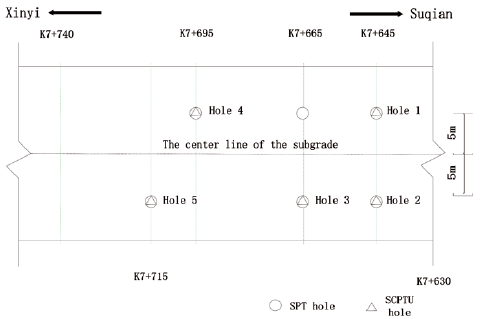
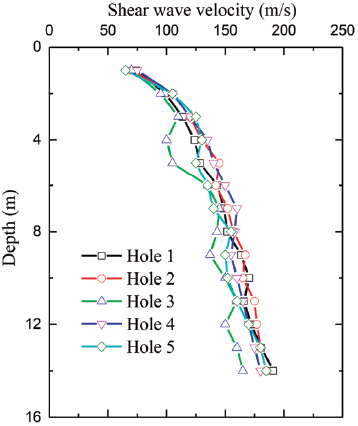
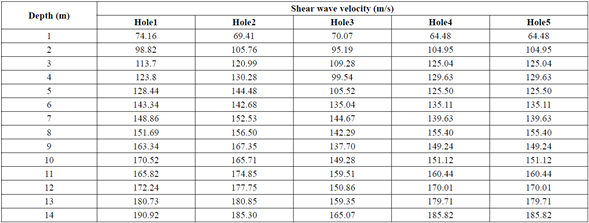
The shear wave velocity of hole 1 with depth is shown in Figure 4. Typical recorded wave arrivals for a source to first receiver distance of each 1 m and the processed data are shown in Table 2. Shear wave velocity of 5 holes are presented the trend of the overall increase with depth (The locations of 5 holes were shown in Figure 3). The shear wave velocity values of sandy silt layer range from 70 to 100 m/s, and The shear wave velocity values of silt layer range from 100 to 200 m/s. Shear wave velocity and cone tip resistance have a similar trends, shear wave velocity obviously increased with the suddenly increase of the cone tip resistance, The reaction of shear wave velocity data have a consistency with cone tip resistance and side friction by revealing the changes in soil. The equivalent soil shear wave velocity varies from 50 to 200 m/s. Most of the area, having an average shear wave velocity of 100-150 m/s, can be classified as medium to dense soil.
The SPT is one of the oldest, most popular, and most common in situ tests used for soil exploration in soil mechanics and foundation engineering. This test is used for many geotechnical projects because of the simplicity of the equipment and test procedure. In particular SPT tests are used for seismic site characterization, site response, and liquefaction studies towards seismic microzonation (Bolton Seed, 1985; Kayen, 1992; Cetin, 2004). This test is quite crude and depends on many factors due to the variations of applications carried out in the test and some equipment used in the test. Those factors includes the drilling methods, drill rods, borehole sizes and stabilization, sampler, blow count rate, hammer configuration, energy corrections, fines content, and test procedure (Schmertmann and Palacios, 1979; Kovacs et al., 1981; Farrar et al., 1998; Sivrikaya and Togrol, 2006). The combined effect of all these factors can be accounted by applying the correction factors separately or together. The SPT-N values may vary even for identical soil conditions because of sensitivity to operator techniques, equipment, malfunctions, and poor boring practice. So the SPT based correlations may be used for projects in preliminary stage or where there is a financial limitation, but for important projects, it is preferable to measure dynamic properties directly by using suitable field tests (Anbazhagan and Sitharam, 2008).
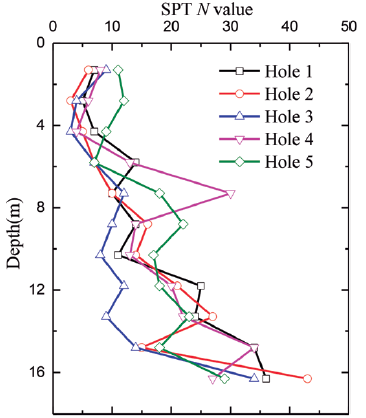
Boreholes with a diameter of 110 mm were drilled using hydraulic rotary drilling rigs up to the hard stratum. SPT tests were conducted at a regular sampling interval of 1.5 m in each borehole, and additional disturbed soil samples were also collected. Most of the penetration resistances (SPT-N values) in the boreholes were measured using donut hammer. The undisturbed soil samples are collected according to Chinese Standard GB 50021 (2009). The undisturbed soil sample is procured by driving the thin walled sampler of diameter of 75 mm and 700 mm length tube into the borehole at desired depth/ change of strata. To avoid densification of soil samples due to hammering, the following precautionary steps are followed in the field: (a) The length of tube is marked on the driving rod and the driving is carried out carefully up to tube length (up to mark) by adjusting hammer height of fall, and (b) usually, the height of the hammer fall is limited to 76 cm. After ensuring complete penetration due to hammering, the tube is turned at least for two revolutions to shear the sample off at the bottom. The loose/disturbed soil in the upper end is removed and waxed on either end and taken to the laboratory. These samples are used to evaluate in situ densities of the soil layers. In most of the locations, the boreholes are drilled up to weathered rock and in few locations boreholes reached up to hard rock. SPT-N values of hole 1 with depth are shown in Figure 5. These boreholes were also used for ground improvement project of Su-Xin expressway and other studies.
N and V s Corrections
Shear wave velocities are corrected for overburden stress using traditionally following equation (Sykora, 1987; Robertson et al., 1992; Andrus and Stokoe, 2000; Youd et al., 2001; Juang et al., 2002; Andrus et al., 2004).
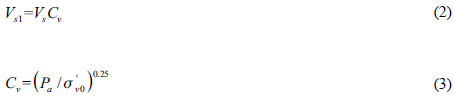
where Vs1 is overburden stress corrected shear wave velocity, Cv is factor to correct measured shear wave velocity for overburden pressure, σ'v0 is effective overburden pressure, Pa is 100 kPa.
A maximum Cv value of 1.4 is generally applied to Vs at shallow depth (Andrus and Stokoe, 2000). The overburden stress corrected shear wave velocity Vs1 is evaluated for each layer, which is used to estimate the overburden stress corrected shear modulus G max1 .
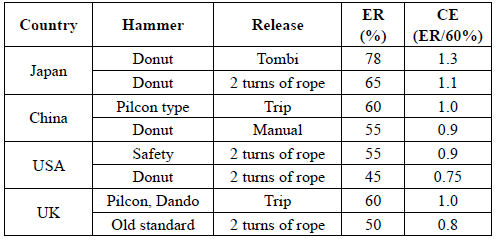
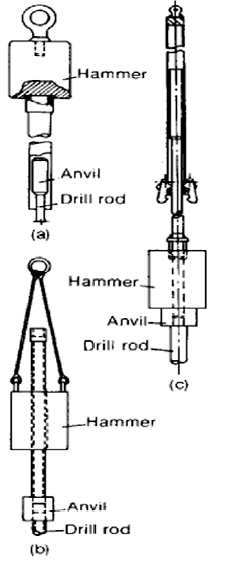
The N values from field boreholes have been corrected for various corrections. One of the important factors that affect the SPT-N value is the energy transferred from the falling hammer to the SPT sampler. The energy ratio (ER) delivered to the sampler depends on the type of hammer, anvil, lifting mechanism, and the method of hammer release. Where energy measurements cannot be made, careful observation and notation of the equipment and procedures are necessary to estimate the CE value. The use of good-quality testing equipment and carefully controlled testing procedures will generally yield more consistent ERs. For liquefaction calculation, Yilmaz and Bagci (2006) took the CE value as 0.7 for the SPT hammer donut type, delivering 60% energy. In this study the delivered hammer energy is not measured, but the hammer used is donut hammer. From the Table 3 of summary of rod energy ratios, it can be seen that the delivered energy ratio (ER) is 55% and CE is taken as 0.9 (Skempton, 1986). The different SPT hammer was shown in Figure 6. Since the energy ratio for SPT is known in this article, the energy-ratio-corrected N-values N60 can be obtained by using the following equation:

where N 60 is the energy-ratio-corrected N-values, CE is the hammer energy parameter.
The N values from field boreholes have been corrected for various corrections, such as (a) overburden pressure CN, (b) hammer energy CE, (c) borehole diameter CB, (d) presence or absence of liner CS, (e) rod length CR, and (f) fines content Cfine (Seed et al., 1983, 1985; Skempton, 1986; Youd et al., 2001; Cetin et al., 2004; Pearce and Baldwin, 2005). Corrected N60 value (N1)60 are obtained by using the following equation:

where CN is the overburden pressure parameter and not exceeding a value of 1.7.
The SPT-N values recorded in the field increase with increasing effective overburden stress; hence overburden stress correction factor is applied (Seed and Idriss, 1982). This factor is commonly calculated from the equation developed by Liao and Whitman (1986). However Kayen et al. (1992) has suggested the following equation, which limits the maximum CN value to 1.7 and provides a better fit to the original curve specified by Seed and Idriss (1982):

where σ'v0 is effective overburden pressure, Pa is 100 kPa, and CN should not exceed a value of 1.7.
This empirical overburden correction factor is also recommended by Youd et al. (2001). The other correction for borehole diameter, rod length, and sampling methods are modified from Skempton (1986). The correction factors are listed by Robertson and Wride (1998). The borehole diameter correction factor of 1.00 for 110 mm borehole diameter is used. The rod length correction factor CR is applied based on the length of the rod. Sampler correction factor CS for the presence or absence of liner is taken as 1.0 for standard sampler.
The corrected N value (N1)60 is further corrected for fines content based on the revised boundary curves derived by Idriss and Boulanger (2004) for cohesionless soils as described below:
where FC is percent fines content (percent dry weight finer than 0.075 mm).
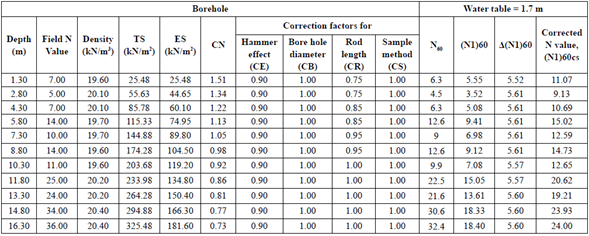
Typical corrected N values for hole 1 is shown in Table 4. Similarly SPT-N corrected values with depth have been determined for all the boreholes.
Relation between G max and SPT-N Values
The correlation between measured G max (calculated from measured shear wave velocity and density of each layer) and the measured SPT-N values is attempted. From the 6 sets of SCPTU and SPT testing points, about 50 pairs of N and G max values have been used for the regression analysis. To obtain the practical relationship between shear modulus and N values, also to understand data matching, different combinations of corrected and uncorrected values were attempted, which are discussed in the following.
Before starting the discussion, we first analyzed the relationship between the cone tip resistance qt and shear wave velocity Vs. The Figure 7 was the regression relation between cone tip resistance qt and shear wave velocity Vs. in test site. From this figure we could see that the shear wave velocity was mainly increased with the cone tip resistance. The relationship was shown with by index function and the coefficient of determination was good (R2=0.94). The regression equation between qt and Vs. is given below

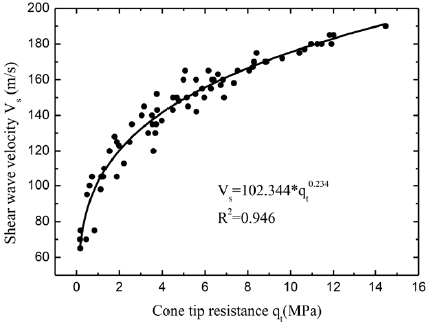
According to related research the SPT-N values had a positive correlation with the cone tip resistance (Anbazhagan P and Sitharam TG, 2010). On the other hand, there was also a positive correlation between shear wave velocity and small strain shear modulus. Thus we could infer that there was also a positive correlation between SPT-N values and the small strain shear modulus which was speculated by the shear wave velocity.
Relation between corrected N and uncorrected G max values
According to the research experience of the previous scholars, many kinds of equations were used to compare with which is the best equation for the regression relation between SPT-N values and small strain shear modulus (Ohta, 1972; Imai, 1982; Anbazhagan, 2010). Studies showed that when using exponential function, the related equation had a highest coefficient of determination and there was a better fitting. So the predicted small strain shear modulus in this paper could be used for the engineering. There is an exponential relationship between measured values of SPT-N and shear modulus G max . Correlation between measured values of SPT-N and shear modulus G max is presented in Figure 8(a). The regression equation between G max and N is given below:

where G max is low strain measured shear modulus in unit of MN/m2, N is measured SPT-N value.
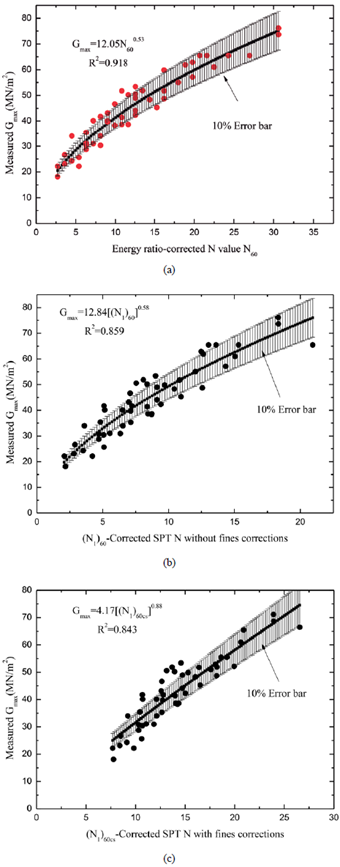
Figure 8(a) also shows the actual data and fitted equation with ±10 % error bars. It gives a visual sense of how well the data defines the best fit curve (Motulsky, 2004). The best fit equation has the R squared value of 0.918.
To study the difference between corrected and uncorrected SPT-N values in the regression equation, two combinations of plots were generated. Figure 8 shows correlations that are (b) corrected N values without fines content correction and measured modulus and (c) corrected N values with fines content correction and measured shear modulus. In the first case corrected N values are estimated excluding fines content correction factor according to Equation 5, and in the second case the corrected N values are estimated including fines content correction factor according to Equation 7. The both are giving a similar R2 (0.859 and 0.843). The data range in the first case (N1)60 is distributed from 2 to about 21, but in the second case, the (N1)60cs is distributed from 8 to about 28. For the purpose of developing the regression equation, any one of the corrected N value without or with fines content correction ((N1)60 or (N1)60cs) may be used. This is so because the corrected N values without or with fines content correction yield similar best fit equations and R2 values. The developed regression equations for the corrected N values without or with considering fines content correction are given below:
Without fines content correction

With fines content correction

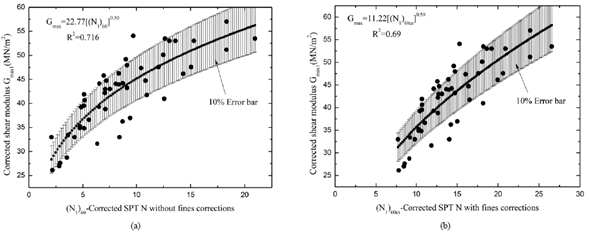
Relation between corrected N and corrected G max values
The overburden stress corrected shear modulus has been evaluated using traditional Vs correction factor given in Equation 3. Figures 9a and 9b show the corrected shear modulus G max1 , versus corrected N values of (N1)60cs and (N1)60cs. It was found that the regression fit is poor and gives lower R2 values when compared to the relationship between corrected N and measured G max values. Also similar to the above results, the corrected N values without or with fines content correction gives similar fitted equation, but the first one gives slightly higher R2 value (0.716) when compared to the second one (R2=0.69). The regression equation for the corrected shear modulus (G max1 ) and corrected N values without or with considering fines content correction is given below:
Without fines content correction

Without fines content correction

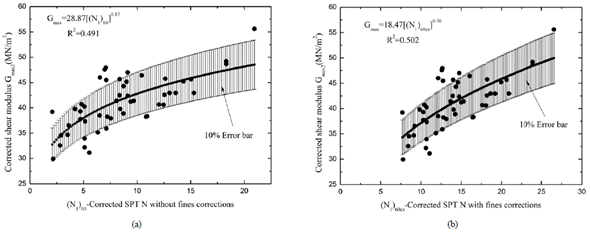
To trace out the problems, an attempt is made to use similar overburden stress correction factor applied to N values. The overburden stress corrected shear modulus of each layer has been evaluated using the correction factor given in Equation 6. Figures 10a and 10b show the corrected shear modulus (G max2 ) versus corrected N values of (N1)60 and (N1)60cs. The regression fit is very poor and gives low R2 values when compared to corrected N and corrected (Gmax1) values. The regression equation for the corrected shear modulus (G mx2 ) and corrected N values without or with fines content correction is given below:
With fines content correction
With fines content correction
From this study, it is clear that the correlation between the normalized shear modulus and N does not give a better regression equation even though the data are same. It is necessary to review the traditionally used overburden stress correction factor for Vs. The traditional shear wave velocity correction factors may be revised in future based on these data or by including more data if available.
Results and discussions
To validate N versus G max relation presented in this study, it has been compared with existing relations available in the literature. Many regression equation between N, (N1)60, and (N1)60cs with Vs and Vs1 are available in the literature for different soils by different researchers, but limited regression equation are available for N versus G max . The popularly used correlations are developed by Ohta and Goto (1976) and Imai and Tonouchi (1982), but in the relationship presented by Imai and Yoshimura and the relationship presented by Ohba and Toriumi (1970) were developed by assuming uniform density.
Recently, Anbazhagan and Sitharam (2010) developed a correlation between measured SPT-N and shear modulus values using data measured for seismic microzonation study of Bangalore, India. The original equation proposed by Anbazhagan and Sitharam (2010) is

where the unit of G max is MN/m2.
The equations were reproduced in Anbazhagan and Sitharam (2010) for the corrected N values (corrected N values without or with fines content) for Silts and with less percentage of clay, which is as follows:
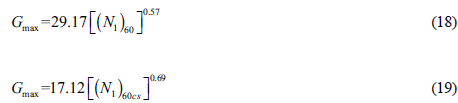
Figure 11 shows the Equation 17, Equation 18, and Equation 19 using uncorrected values of N. In order to compare equations developed in our study, it is assumed that Equation 18 and Equation 19 based corrected N values (N1)60 and (N1)60cs as highlighted in the work of Anbazhagan and Sitharam (2010).
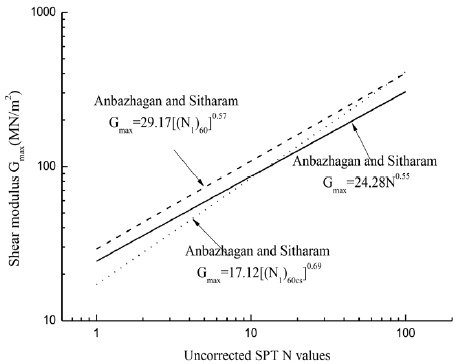
In Figure 11, horizontal line gives uncorrected or corrected SPT-N values based on the equation. If SPT-N value of X is uncorrected for Equation 10, the same X is corrected N value without fines content correction for Equation 11 and corrected N value with fines content correction for Equation 12. This similar explanation also applies for Figures 13 and 15. From Figures 11 and 12, it is clear that corrected N values without fines content corrections yield a higher shear modulus (G max ) against measured N values. From Figure 12, G max equations developed using corrected N considering fines content correction (Eq. 12) matches with G max equation using measured N values (Eq. 10) up to the N values of 15 and G max equation using corrected N without considering fines content correction for N values about 30. For the N values between 15 and 30, Equation 12 lies between Equation 10 and Equation 11.
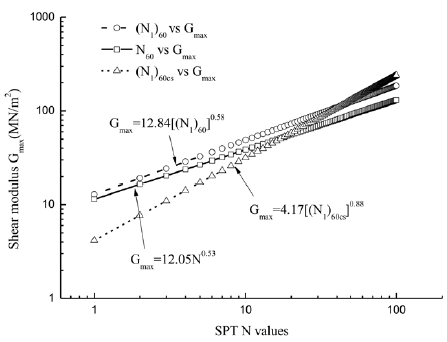
Figure 13 shows the comparison of equations developed in this study with Equation 17 presented by Anbazhagan and Sitharam (2010). From Figure 13, it is clear that corrected N values with fines content corrections yield a higher shear modulus (G max ) against Equation 17, but Equation 17 has a similar trend with the Equation 12; this may be attributed to soil type and number of data. In Anbazhagan and Sitharam (2010) most of the data are above the N value of 50 (for clay and sand) and the average shear wave velocity is about 250-500 m/s while the average shear wave velocity in this study is about 100-150 m/s. Hence, the G max may have some distinction with different soil type. Figure 15 shows a comparison of equations developed in this study for corrected values, with Equations 18 and 19 presented by Anbazhagan and Sitharam (2010). Shear modulus values have been evaluated considering (N1)60 and (N1)60cs using Equation 18 and Equation 19. From Figure 14, regression relations developed in this study between corrected N values ((N1)60 and (N1)60cs) and measured shear modulus (Eq. 11 and Eq. 12) have similar trends with those of Anbazhagan and Sitharam (2010). The correlations developed in this study used the measured SPT-N values of up to 20 (refusal), whereas Anbazhagan and Sitharam (2010) had used a measured N value of up to 50. The corrected average shear wave velocity in Anbazhagan and Sitharam (2010) is about 300500 m/s while the average shear wave velocity in this study is about 80-140 m/s. So, the G max may have some distinction with different soil type. Also, the proposed correlation is unique, independent of the lithology, soil grading, age, cementation, etc. The developed equations in this study can be directly used for soil type "Jiangsu silts of China" however for the important structures; the best way is to measure G max directly using in situ seismic tests.
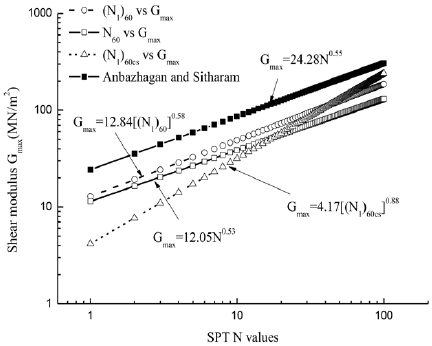
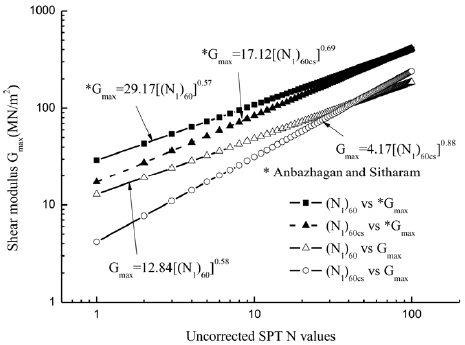
Figure 14 Comparison of relations developed in this study based on corrected N values with Anbazhagan and Sitharam (2010)
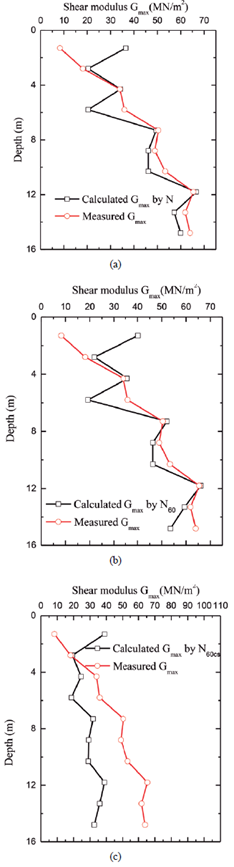
Comparison of measured and calculated G max values
The shear wave velocities measured in the seismic piezocone penetration test (SCPTU) can be compared with those estimated using empirical models which are developed in this study above. The SPT-N and G max correlations of Jiangsu silts of China with respect to the aforementioned relationships are presented with the small strain shear modulus determined from the SCPTU results. Moreover, the small strain shear modulus determined from the corrected N values (without or with considering fines content correction) is compared in Figure 15. Although a continuous small strain shear modulus profile down to a depth of 16 m could be obtained from both SCPTU Vs measurements and SPT-N and G max correlations in this study. The correlation of small strain shear modulus profiles in both SCPTU measurements and N60 or (N1)60 and G max correlations is similar for the available data as seen in Figure 15. But the data calculated using (N1)60cs and G correlations has a larger error with measurements.
Conclusions
Regression relation between SPT-N and G max values have been developed using 50 pairs of SPT-N and G max from geotechnical boreholes and SCPTU data. The regression equation using measured values gives best fit and R2 values when compared to the corrected N and corrected G max . The regression relation between corrected N values without considering fines content correction (N1)60 or with considering fines content correction (N1)60cs and G max are also giving similar R2 values. In the relation between corrected N values and measured shear modulus, any one of the corrected N values (without or with considering fines content correction) can be used for regression analysis. The relation between corrected N and G max shows poor regression relation for the same data. The traditional overburden stress correction factors applied for shear wave velocity need a relook. The traditional shear wave velocity correction factors may be revised in the future based on these data or including more data if available. The proposed relations are comparable with the existing relations similar to this study. Existing relations were developed with many assumptions during the developing stage of geotechnical earthquake engineering (GEE). These relations have to be reviewed with present knowledge of GEE and may be updated and reproduced in the future. The developed equation between N and G max is more suitable for Jiangsu silts of China.

