


 English (pdf)
 Article in xml format
 Article references
 Send this article by e-mail
 Cited by SciELO
  Cited by Google
  Similars in
SciELO
Similars in
SciELO  Similars in Google
 Permalink
1. Introduction
The Iraqi marbles of Mawat and Penjween (Gimo group) are located in the extreme northeast of Iraq, near the border with Iran (Figs. 1 and 2). According to the tectonic classification of Buday and Jassim (1987), these Marbles are located in the Suture Zone of the Penjween Walash Subzone of Central Zone of the Euogeosyncline.
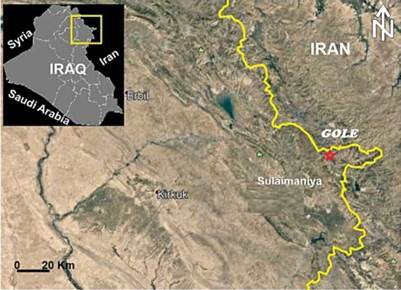
Figure 1 Satellite image of northeast Iraq showing the location of the study area near Gole village (from Google Earth).
The Gimo group comprises an alternation and interfingering of grey-white marble and dark grey calc-schist, with thin sheets of metabasalts in some places. This group shows a remarkable lithological resemblance to the Qandil Series from the Eocene. The Gole marble is a part of the Gimo group situated in the northeastern part of Sulaimani city at 35° 46' 40.68" N and 45° 49' 19.07" E (Figs. 1 and 2).
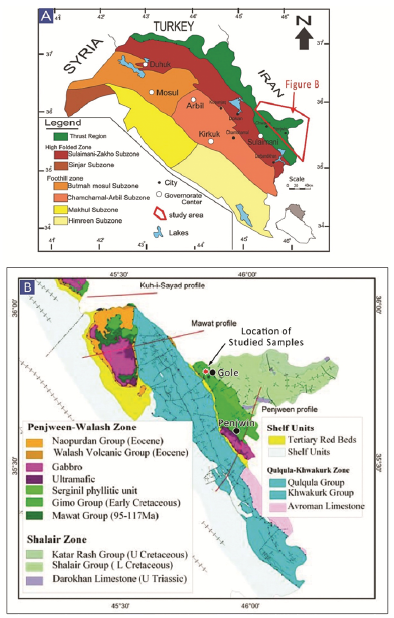
Figure 2 A. Geotectonic map of the Zagros Suture Zone, northeast Iraq, showing the location of the study area. B. Geological map of the Penjween area (after Jassim and Goff, 2006).
Various studies have been carried out on the metamorphic rocks of the Penjween area, including those by Bolton (1958), Samirnov and Neldov (1962), DeVilliers (1975), Jassim et al. (1982), Buday and Jassim (1987), Awadh (1991), Karim (2004), Awadh and Kettanah (2008). Most of these studies were directed towards elucidating the conditions of metamorphism. However, the metamorphic sequences in the area have not been studied in detail, and their relevance to the general geological framework remains unknown.
Jassim et al. (1982) described the metamorphic evolution of the inner zone of the Iraqi Zagros in the Bulfat, Mawat, and Penjween Massifs, suggesting that all these units were affected by the same metamorphic event, and more specifically as a result of regional metamorphism and contact metamorphism. They estimated the temperature of this contact metamorphism to be 750 °C and low to medium pressure of regional metamorphism.
Karim (2004) studied the origin of the structure and textures of some Kurdistan marbles and reported plastic flow textures formed because of burial and tectonic fracturing and later filled with sparitic calcite.
Awadh and Kettanah (2008) studied the petrology and geochemistry of the Shalair Metamorphic Rock Group (SMRG) and showed that three lithological units characterize the SMRG: metapelite, metacarbonate, and meta-arenite, and that the Kater Rash Volcanic Group (KRVG) is characterized by a metaigneous series including metabasalt, metaandesite, and metarhyolitic dacite. All these rocks are regionally metamorphosed into low-grade metamorphism of the greenschist facies-chlorite zone. In addition, they suggested thermal conditions of metamorphism of about 340±20 °C at pressure conditions of approximately 2.5-3 Kb.
This study aims to investigate the mineralogical, geochemical characteristics of Gimo marble and determining the origin of their protolith and to provide insight into the palaeo-depositional environment of the formation and as well as provide a better understanding of the origin and geotectonic setting of this part of the Iraqi Zagros Suture Zone (IZSZ).
2. Geological setting
The Gole area is located approximately 20 km north of Penjween Town in the Sulaimani governorate, northeast Iraq, at 35° 46' 40.68" N and 45° 49' 19.07" E (Figs. 1 and 2). The area is geologically complex, situated within the northeastern end of the IZSZ (Fig. 2A). The Gole area belongs to IZSZ, which formed due to the collision between the Arabian passive margin and the Iranian active margin and is considered a part of the Zagros Orogenic Belt (Talbot and Alavi, 1996; Ali et al., 2016). The tectonostratigraphic units of the IZSZ preserve a complex geological record of the Arabian crust evolution during the closure of the Neo-Tethys Ocean (Jassim and Goff, 2006). The IZSZ is marked by two allochthonous thrust sheets: the upper and lower allochthonous units (Aswad, 1999; Aswad et al., 2011). The lower allochthonous unit contains volcano-sedimentary rocks of the Walash-Naopurdan nappe, whereas the upper allochthon - or 'ophiolite-bearing terrain' - is represented by the Bulfat, Penjween (Gimo-Qandil Group) (Aswad, 1999; Aswad et al., 2011), and Mawat complexes of the Albian-Cenomanian (97-105 Ma) (Aswad and Elias, 1988).
The Gimo marble in the Gole area represents a part of the Qandil Metamorphic Series (QMS), which occurs in the Penjween-Walash Sub Zone (Fig. 2B) according to the geotectonic subdivision of Iraq proposed by Buday (1980). This QMS structurally overlies the Walash and Naopurdan Series and is composed mainly of weakly metamorphosed limestone and schist, forming the frontier range of eastern Iraq.
Buday (1980) divided the QMS into two subgroups. The lower subgroup is composed of two units: (i) the Gimo group, the lowermost unit by Buday and Blackman (1975), which includes metavolcanics interbedded with marbles, calc-schists, and phyllites; and (ii) the Sirginil group, the upper unit, which is composed mainly of metamorphosed limestone, calc-phyllites, phyllites, and sparse conglomerates, without any volcanic admixture. The contact of the Sirginil group with the overlying sedimentary unit is erosional, whereas the contact between the Gimo and Sirginil group units is tectonic (Mirza et al., 2017; Mirza and Rashid, 2018). Based on field investigations, the exposed rocks in the study area are calcareous members of the Gimo group. This group occurs in an elongated zone, stretching from the Penjween area in the southeast to the northern parts of the Bulfat Massif (east of Qaladiza), up towards the Rawanduz river valley in the NW, and forms continuous outcrops north of the Rawanduz River. Lithologically, the Gimo group consists of several rock units that show lateral variations; however, the main features of the group are a 600 m thick, massive, and thickly bedded layer of marble and calc-schist interbedded with basaltic lava flows (Fig. 3). The equivalent lithologies of the Gimo group in the Bulfat Massif are strongly altered by contact metamorphism, owing to intrusions of intermediate and elemental composition.
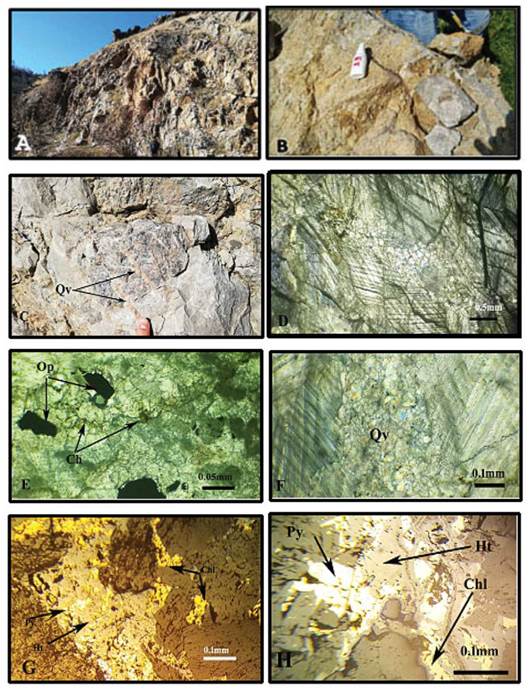
Figure 3 Field images and photomicrographs of Gimo marble samples. A. Outcrops of Gimo marble beds in the study area; B. field occurrence of grey-coloured calcitic marble; C. quartz veins that mostly show an open-space filling texture; D. photomicrograph of calcite grains with deformation twinning and a homeoblastic mosaic texture, shown in plane-polarised light (PPL; E. subhedral opaque minerals (Op); and chlorite (ch) as accessory minerals F. photomicrograph of a quartz veinlet (Qv) shown in cross-polarised light (XPL); G and H. Metallic minerals associated to the Gimo marble, viewed under reflected light microscope representing hematite (Ht), Pyrite (Py) and Chalcopyrite (Chl.)
The Gimo and Sirginil sequences were hypothesized to have been formed before the Tertiary (Buday, 1980), with regional metamorphism occurring during the Late Cretaceous, causing deformation of the entire series. However, despite this tectonic disruption, the original sedimentary textures of the rocks and their primary geochemical features have mostly been preserved. The Gimo group in the Penjween area consists of massive white grey marbles, meta-tuffites, and amphibolites, which have been intruded by mafic and ultramafic rocks of the Penjween Complex. Jassim and Goff (2006) suggested that the Gimo group was deposited on seamounts in the Neo-Tethys Ocean. Thermal metamorphism around the Mawat and Penjween intrusive rocks has been described by Jassim and Al-Hassan (1977) and Buday (1980), and they have considered the metamorphism grade of the Gimo group in the Biotite zone.
3. Materials and methods
During fieldwork, eight 'fresh' marble samples were collected across strike within the Gimo group to investigate its petrogenesis. Six thin sections and three polished blocks were prepared at the Kurdistan Institution for Strategic Studies and Scientific Research laboratory. They were examined using a polarised-light microscope in transmitted and reflected mode to determine their mineral contents and petrographic characteristics, respectively (i.e., mineral assemblages, associations, grain sizes, and textures).
Each fresh sample of marble was powdered through a 200 mesh in an agate mill to avoid contamination. Fused-glass discs were prepared for major element analysis by X-ray fluorescence (XRF) at the Laboratory of Electron Microscopy and Microanalysis of the Faculty of Natural Sciences, University of Patras, Greece, with a relative standard deviation percentage (RSD %) of less than 5% for all analyzed elements. Loss on ignition (LOI), which consists principally of CO2 in these samples, was determined at 950 °C for 90 min.
Trace element concentrations, including rare-earth elements (REEs), were obtained at the SGS laboratory in Canada by using sodium peroxide fusion and analysis through inductively coupled plasma atomic emission spectroscopy (ICP-AES) and inductively coupled plasma mass spectrometry (ICP-MS). The detection limits for all analyzed elements in this study are presented in Tables 1, 2, and 3.
Table 1 Major oxide contents (wt.%) of Gimo marble samples (L.D.: Limits of Detection in %; LOI: loss on ignition, nd: not detected).
| Samples | G1 | G2 | G3 | G4 | G5 | G6 | G7 | G8 | Mean | L.D % |
|---|---|---|---|---|---|---|---|---|---|---|
| SiO2 | 1.68 | 1.04 | 0.88 | 3.18 | 1.58 | 1.64 | 4.61 | 0.68 | 1.91 | 0.0002 |
| Al2O3 | 0.06 | 0.11 | 0.05 | 0.03 | 0.17 | nd | 0.12 | 0.01 | 0.07 | 0.0002 |
| TiO2 | nd | 0.01 | nd | 0.01 | 0.02 | 0.02 | nd | nd | 0.01 | 0.0010 |
| CaO | 53.52 | 54.40 | 54.30 | 51.69 | 53.62 | 52.70 | 51.15 | 54.63 | 53.25 | 0.0003 |
| MgO | 0.46 | 0.68 | 0.66 | 0.71 | 0.64 | 0.64 | 0.75 | 0.73 | 0.66 | 0.0010 |
| MnO | 0.03 | - | - | - | - | - | - | - | - | 0.0010 |
| Fe2O3 | 0.22 | 0.14 | 0.12 | 0.12 | 0.13 | 0.14 | 0.30 | 0.12 | 0.16 | 0.0003 |
| 0.00 | 0.11 | 0.05 | 0.05 | 0.12 | 0.04 | 0.07 | 0.04 | 0.06 | 0.0010 | |
| Na2O | 0.02 | 0.01 | 0.01 | 0.01 | 0.01 | 0.01 | 0.01 | 0.01 | 0.01 | 0.0010 |
| P2O5 | nd | 0.07 | 0.04 | 0.07 | 0.06 | 0.03 | 0.04 | 0.11 | 0.05 | 0.0010 |
| LOI | 42.00 | 43.17 | 42.99 | 40.69 | 43.11 | 42.64 | 41.38 | 43.42 | 42.43 | |
| Total | 98.00 | 99.72 | 99.09 | 96.56 | 99.45 | 97.86 | 98.43 | 99.74 | 98.61 | |
| CaCO3 a | 95.44 | 97.00 | 96.84 | 92.17 | 95.61 | 93.98 | 91.22 | 97.42 | 94.96 | |
| MgCO3 a | 0.97 | 1.43 | 1.38 | 1.50 | 1.34 | 1.33 | 1.56 | 1.52 | 1.38 | |
| SiO2/Al2O3 | 28.05 | 9.81 | 19.02 | 99.38 | 9.38 | - | 39.08 | 67.50 | 34.03 | |
| Mg | 0.28 | 0.41 | 0.40 | 0.43 | 0.38 | 0.38 | 0.45 | 0.44 | 0.40 | |
| Ca | 38.26 | 38.88 | 38.82 | 36.95 | 38.33 | 37.67 | 36.56 | 39.05 | 38.06 | |
| Mg/Ca*100 | 0.73 | 1.06 | 1.02 | 1.16 | 1.00 | 1.02 | 1.23 | 1.12 | 1.04 |
a: CaCO3 and MgCO3 values were calculated via stoichiometry
Table 2 Trace element contents of Gimo marble samples (ppm).
| Trace elements (ppm) | G1 | G2 | G3 | G4 | G5 | G6 | G7 | G8 | Mean | D.L |
|---|---|---|---|---|---|---|---|---|---|---|
| Ba | 8 | 6 | 5 | 3 | 4 | 8 | 7 | 5 | 5.7 | 2.5 |
| Ce | 6 | 5 | 10 | 3 | 6 | 4 | 8 | nd | 5.3 | 0.04 |
| Co | 4 | 4 | 4 | 5 | 3 | 4 | 5 | 4 | 4.1 | 0.05 |
| Cu | 27 | 23 | 4 | 3 | 18 | 1 | 5 | 2 | 10.4 | 0.03 |
| Cr | 4 | 4 | 3 | 3 | 3 | 4 | 3 | 4 | 3.5 | 0.26 |
| Ni | 18 | 13 | 15 | 13 | 15 | 15 | 19 | 13 | 15.1 | 0.03 |
| Pb | 1 | 1 | 1 | 1 | 1 | 1 | 1 | 1 | 1 | 0.09 |
| Rb | 5 | 4 | 3 | 3 | 4 | 4 | 5 | 3 | 3.9 | 0.12 |
| Sr | 856 | 258 | 213 | 245 | 268 | 288 | 687 | 246 | 382.6 | 0.04 |
| Th | 1 | 2 | 2 | 2 | 2 | 2 | 2 | 1 | 1.75 | 0.02 |
| W | 2 | 5 | 4 | 8 | 3 | 6 | 3 | 5 | 4.5 | 0.02 |
| Y | 4.5 | 15 | 14.8 | 15 | 23 | 21 | 13.2 | 13 | 14.94 | 1.7 |
| Zn | 17 | 20 | 9 | 7 | 18 | 7 | 10 | 5 | 11.6 | 0.06 |
| Zr | 6 | 8 | 9 | 8 | 9 | 9 | 21 | 7 | 9.6 | 0.6 |
| Hf | 3 | 3 | 3 | 3 | 3 | 3 | 3 | 3 | 3 | 0.02 |
| Sr/Rb | 171 | 65 | 71 | 82 | 67 | 72 | 137 | 82 | 93.375 | |
| Sr/Ba | 107 | 43 | 43 | 82 | 67 | 36 | 98 | 49 | 65.625 |
Table 3 REE contents of Gimo marble samples (ppm).
| REE (ppm) | PAAS | G1 | G3 | G7 | Average | L.D(ppm) |
|---|---|---|---|---|---|---|
| La | 38.00 | 3.10 | 10.30 | 2.90 | 5.43 | 0.1-10000 |
| Ce | 80.00 | 2.70 | 6.00 | 5.10 | 4.60 | 0.05-1000 |
| Pr | 8.90 | 0.52 | 2.00 | 0.90 | 1.14 | 0.05-1000 |
| Nd | 32.00 | 2.00 | 8.10 | 1.80 | 3.97 | 0.1-1000 |
| Sm | 5.60 | 0.40 | 1.60 | 0.38 | 0.79 | 0.1-1000 |
| Eu | 1.10 | 0.10 | 0.37 | 0.10 | 0.19 | 0.05-500 |
| Gd | 4.70 | 0.49 | 1.97 | 0.45 | 0.97 | 0.1-1000 |
| Tb | 0.77 | 0.07 | 0.28 | 0.05 | 0.13 | 0.05-10000 |
| Dy | 4.40 | 0.52 | 1.74 | 0.50 | 0.92 | 0.05-1000 |
| Ho | 1.00 | 0.10 | 0.37 | 0.10 | 0.19 | 0.05-500 |
| Er | 2.90 | 0.31 | 1.04 | 0.25 | 0.53 | 0.05-1000 |
| Tm | 0.40 | 0.05 | 0.14 | 0.05 | 0.08 | 0.05-500 |
| Yb | 2.80 | 0.20 | 0.90 | 0.18 | 0.43 | 0.1-1000 |
| Lu | 0.43 | 0.05 | 0.14 | 0.05 | 0.08 | 0.01-1000 |
| Σ REE | 183.00 | 10.61 | 34.95 | 12.81 | 19.46 | |
| Σ LREE | 164.50 | 8.72 | 28.00 | 11.08 | 15.93 | |
| Σ HRRE | 18.50 | 1.89 | 6.95 | 1.73 | 3.52 | |
| Σ LRR/ Σ HRR | 8.89 | 4.61 | 4.03 | 6.40 | 5.02 | |
| (La/Yb)N | 1.14 | 0.84 | 1.19 | 1.06 | ||
| (La/Sm)N | 1.14 | 0.95 | 1.12 | 1.07 | ||
| Er/Nd | 0.16 | 0.13 | 0.14 | 0.14 | ||
| Y/ Ho | 45.00 | 40.00 | 132.00 | 72.33 | ||
| Eu/Sm | 0.25 | 0.23 | 0.26 | 0.25 | ||
| Sm/Yb | 2.00 | 1.78 | 2.11 | 1.96 | ||
| (Nd/Yb)N | 0.88 | 0.79 | 0.88 | 0.85 | ||
| (Pr/Yb)N | 0.82 | 0.70 | 1.57 | 1.03 | ||
| Ce/Ce* | 0.62 | 0.38 | 0.44 | 0.48 | ||
| Pr/ Pr* | 1.21 | 1.37 | 1.69 | 1.42 | ||
| La/La* | 4.87 | 4.84 | 1.20 | 3.64 | ||
| Gd/Gd* | 1.64 | 1.26 | 5.90 | 2.93 | ||
| Eu/Eu* | 0.52 | 0.48 | 0.56 | 0.52 |
Ce/Ce*= CeN / (2Pr- NdN); Pr/Pr*=PrN / (0.5CeN+0.5NdN); La/La*= - 3 LaN/ (3PrN-2NdN); (Eu/Eu* = EuN / (SmN + GdN)0.5; L.D: Limits of Detection.
4. Results
4.1. Petrographic features
Rock-forming minerals and their textures can be used to interpret the origin of metamorphic rocks as well as the settings from which those rocks were derived (Georgieva et al., 2009). Notable occurrences of marble rocks with a lensoid/massive form can be traced throughout the Gole area. The marble that outcrops in the area is inclined towards the northeast and forms medium to massive beds, which are often brecciated (Figs. 3A and B). They are also commonly traversed by quartz veins that mostly show an open-space filling texture (Fig. 3C).
The Gimo marble bodies show a clear petrographic variation, although most are massive, coarse-grained, and light grey to pale yellow or white in color (Fig 3A, and B). At the microscopic scale, they exhibit homeoblastic and mosaic textures. The studied marble has simple mineralogy; they essentially consist of large recrystallized calcite (Fig. 3D), with secondary quartz, chlorite, and opaque minerals mostly in the form of hematite, pyrite, and chalcopyrite (Figs. 3E, F, G, and H). Optical microscopy revealed the predominance of a homeoblastic texture, with the carbonates being medium-grained (1.0-2.0 mm) or coarse-grained (>2 mm) (Fig. 3). The light grey marble at the microscopic scale is characterized by the presence of quartz veinlets (Fig. 3F).
Calcite crystals in the studied samples either show curved or straight grain boundaries, which sometimes form triple points (Fig. 3D). Deformation twin textures are also present in calcite, and comprise both crossing and lamellae twins that lie parallel to the rhomb edges (Fig. 3D). This type of twinning is common in calcite that forms in regional metamorphic environments and/ or shear zones (Barker, 2014), and forms because of variable stresses and temperatures applied to the crystal after it has formed. According to Ferrill et al. (2004), the calcite twin width and its temperature of deformation are positively correlated.
4.2. Geochemical data
4.2.1. Major Oxides
The results of the geochemical analysis show the relatively high purity of the crystalline calcite (Table 1). All oxides, apart from CaO and LOI (i.e. SiO2 + TiO2 + Al2O3 + Fe2O3 + MnO + MgO + Na2O + K2O + P2O5) sum to less than 6 wt.%, while CaO contents exceed 51 wt.% (Table 1). The insoluble residues, notably SiO2 (0.68-4.61 wt.%), Al2O3 (0.00-0.17 wt.%), and K2O (0.00-0.12 wt.%), have very low contents, and measured TiO2, MnO, and Na2O contents were negligible.
Bulk-rock analyses of the Gimo marble show very similar SiO2 contents of 0.68-1.68 wt.%, except for samples G4 and G7, which display higher values (3.18% and 4.61%, respectively) related to the presence of quartz veinlets (Fig. 3). The SiO2/Al2O3 ratio for all samples is highly variable (9.38-99.38), but is still typical of pure marble (Obasi and Ogungbuyi, 2014).
The most important major element oxides in carbonates in metamorphic terrains are CaO and MgO, which show values of 51.15-54.63 and 0.46-0.75 wt.%, respectively, in the studied samples. The major oxide contents of the Gimo marble are similar to those of calcitic-type marble and relatively pure limestone (Table 1, Fig. 4).
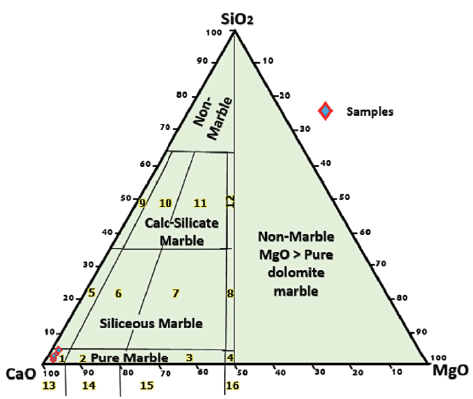
Figure 4 Plot of Gimo marble samples on a CaO-MgO-SiO2 ternary diagram classification system (from Storey and Vos, 1981). Numbered fields are as follows: 1: pure calcite, 2: pure dolomitic calcite, 3: pure calcitic dolomite, 4: pure dolomite, 5: siliceous calcite, 6: siliceous dolomitic calcite, 7: siliceous calcitic dolomite, 8: siliceous dolomite, 9: calc-silicate calcite, 10: calc-silicate dolomitic calcite, 11: calc-silicate calcitic dolomite, 12: calc-silicate dolomite, 13: calcite marble, 14: dolomitic calcite marble, 15: calcitic dolomite marble, 16: dolomite marble, non-marble, and MgO > pure marble.
The very low MnO content in the studied samples may be attributed to the similarity in the ionic size of Mn2+ and Ca2+, as both ions may readily substitute for each other on a crystal lattice (Ephraim, 2012). According to Goldschmidth et al. (1955), the CaO contents in calcitic marbles are usually around 50-54 wt.%, while MgO contents are <15 wt.%. The average CaO content of the Gimo marble is 53.25 wt.%, which shows that mineral phase calcite is dominant and that the protolith was a pure carbonate rock.
The LOI content varies between 40.69 and 43.42 wt.% with an average of 42.43 wt.% (Table 1), the highest values likely reflecting rocks with the lowest quartz contents. Qadhi (2008) observed that the proportion of silicate minerals, such as chlorite and quartz, in marble was negatively correlated with the LOI values of the rocks.
4.2.2. Trace element
Trace element data obtained from the studied Gimo samples are summarised in Table 2, which shows that only Ba, Ce, Co, Cu, Cr, Ni, Pb, Rb, Sr, Th, W, Y, Zn, Hf, and Zr had concentrations above their detection limits. In most of these cases all measured trace elements show values mostly less than 28 ppm, apart from Sr.
In addition, the Sr, Ba, Cu, Y, and Zr contents vary significantly (Table 2), which possibly suggests a complex distribution of these elements between the samples (Georgieva et al., 2009). In the Gimo case, Sr, Ba, and Rb displayed average values of 382.6, 5.7, and 3.9 ppm, respectively, with Sr being enriched in the studied marble, as it is a typical cation that can replace Ca (Konrad and Dennis, 1995; Frimmel, 2009; Taelman et al., 2013). Shearman and Shirmohammadi (1969) considered that the Sr content of recent carbonates ranges from 30 to 200 ppm, although the average Sr concentration of the Gimo marbles (382.6 ppm) is higher than this range (Table 2). Indeed, Sr is the only trace element that showed an elevated concentration, which was particularly pronounced in samples G1 and G7 (856 and 687 ppm, respectively). Such enrichment in marble is related to Sr2+, readily substituting for Ca2+ in limestone, with both ions having the same charge and a similar atomic radius (Konrad and Dennis, 1995). In addition, enrichment of Sr in the Gimo marbles suggests that they have not undergone significant weathering (Zhang et al., 2017).
The studied marble samples show large variations in Zr content (6-21 ppm), whereas low contents were observed for Co, Rb, Ba, Cr, Pb, Th, W, and Ni (Table 2). The post-Archean Australian Shale (PAAS; Taylor and McLennan, 1985) normalized trace element concentrations are plotted in Figure 5. The large-ion lithophile elements (LILEs) such as Rb, Ba, and Th were extremely depleted compared to PAAS. The studied samples were slightly enriched in Sr compared to PAAS. The high-field strength elements (Zr and Hf) and ferromagnesian trace elements (Co, Ni, and Cr) were depleted in all marble samples with respect to PAAS.
Rb is a large cation with a small charge that tends to be compatible with major elements, and its low ionic potential (ratio of charge to ionic radius) makes this element relatively soluble in aqueous solutions. Because of its solubility, it is quite mobile during metamorphism and weathering (Amrouni et al., 2018). According to Dypvik and Harris (2001), the enrichment of Rb in carbonate rocks is mutually associated with the presence of K-bearing minerals (clay minerals) as detrital sediment. The petrographic and geochemical observations of the Gimo marble confirm the absence of K-bearing phases as detrital sediment; hence, their impact on PAAS normalized trace element patterns (Fig. 5) can be assumed to be insignificant. Therefore, the very low Rb content in the studied samples may be related to its input during metamorphism and weathering.
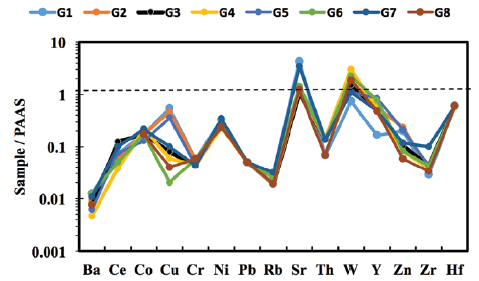
Figure 5 PAAS-normalised trace element patterns for selected Gimo marble samples using normalisation values from Taylor and McLennan (1985).
Among the high field strength elements, Zr concentrations ranged from 6 to 21 ppm, with an average of 9.6 ppm, and Y concentrations range from 4.5 to 23 ppm. Average values for the transition elements with moderate to low concentrations are as follows: 15.1 ppm for Ni, 11.6 ppm for Zn, 10.4 ppm for Cu, 3.5 ppm for Cr, and 4.1 ppm for Co. In addition, Pb and Th have low average concentrations of 1 and 1.75 ppm, respectively. The presence of Th and Pb in the Gimo marble reflects their mutual association with LILEs, which are usually mobile and radioactive (Obasi and Madukwe, 2016).
The average concentrations of Cr and Ni were 3.5 and 15.1 ppm, respectively (Table 2). These values are lower than those of the PAAS, which has contents of 110 and 55 ppm, respectively (McLennan, 2001). In general, TiO MnO, Cu, Pb, Zn, and Ni have an important influence on the color of marbles; thus, their low concentrations in the studied samples explain the observed white and grey colors.
4.2.3. Rare Earth Elements
The measured REE contents in the studied samples are presented in Table 3. These samples have moderate total REE (EREE) contents of 10.61-34.95 ppm, with an average of 19.34 ppm, and it is evident that light rare-earth element (LREE) components dominate over heavy rare-earth element (HREE) components, as the total concentrations of each lie within the ranges of 8.7228.0 ppm and 1.73-6.95 ppm, respectively (Table 3).
The REE concentrations of the studied samples were normalised against PAAS (Taylor and McLennan, 1985). The normalised REE pattern diagrams are presented in Figure 6, where the following equations were used to express Eu, Pr, La, and Ce anomalies in the studied samples: (i) Eu/Eu* ratio = EuN/ (SmN + GdN)0.5, (ii) Pr anomaly = Pr/Pr* = PrN/(0.5CeN + 0.5NdN), (iii) La anomaly = La/La* = LaN/(3PrN - 2NdN), and (iv) Ce anomaly = Ce/Ce* = 3CeN/ (2LaN + NdN) (Bau and Dulski, 1996; Shields and Stille, 2001).
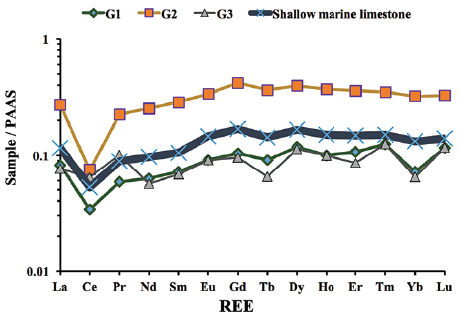
Figure 6 PAAS-normalised REE patterns for Gimo marble samples using normalisation values from Taylor and McLennan (1985).
PAAS normalized REE patterns for all samples show that HREEs are slightly enriched with (La/Yb)N of 0.84-1.19, and (La/Sm)N of 0.95-1.14. In all samples, the average REE content was 19.46 ppm. Ce anomalies were always negative and varied from 0.38 to 0.62.
The studied samples have variable EREEs (10.61-34.95 ppm), Y (4.5-23 ppm; ave. 14.94 ppm), and Ho (0.1 to 0.37 ppm; ave. 0.19 ppm) contents. Their Y/Ho (40.0-132.0; ave. 72.33) and Eu/Sm (0.23-0.26; ave. 0.25) ratios are similar to those of seawater, while their Sm/Yb (1.78-2.11; ave. 1.96) ratios are slightly higher than those of modern seawater (Kandemir and Yilmaz, 2009) (Table 3). Following normalisation of REEs to PAAS (Taylor and McLennan, 1985), the studied samples exhibit (i) depleted LREE relative to HREE (Nd/ Yb)N (0.79-0.88; average 0.85) and (Pr/Yb)N (0.70-1.57; ave. 1.03), (ii) negative Ce/Ce* (0.38-0.62; ave. 0.48), (iii) slightly positive Eu/Eu* (0.48 -0. 56; ave. 0.52), (iv) slightly flat Pr/Pr* (1.21-1.69; ave. 1.42) anomalies, and (v) a positive La/La* anomaly (1.2-4.87; ave. 3.64).
5. Discussion
The very low MgO content of all studied samples is because of the lack of dolomite, which commonly forms owing to the replacement of Ca by Mg during metamorphism or diagenesis. This indicates that the protolith of the Gimo marble was a relatively pure limestone that was deposited in a shallow marine basin (Obasi and Ogungbuyi, 2013).
Melezhik et al. (2008) suggested an Mg/Ca ratio of 0.1 as the boundary between calcite marble (CM), dolomite marble (DM), and dolomitized calcite marble (DCM). The Mg/Ca ratio of 0.5 sets a lower limit for the DM, whereas the Mg/Ca ratio of stoichiometric dolomite is 0.62. The Gole marble is characterized by variable Mg/Ca ratios ranging between 0.73 and 1.23 (Table 1, and Fig. 7A), which is greater than that of stoichiometric dolomite, therefore indicating the absence of dolomite. In addition, the plot of Ca% vs. Mg% that we used to explain the protolith of the studied samples was not affected by dolomitization. Hence, the studied samples are plotted along the limestone-dolostone mixing line (Fig. 7B) owing to very low concentrations of both Mg and SiO2 and high concentrations of Ca (Fig. 3 A, and B).
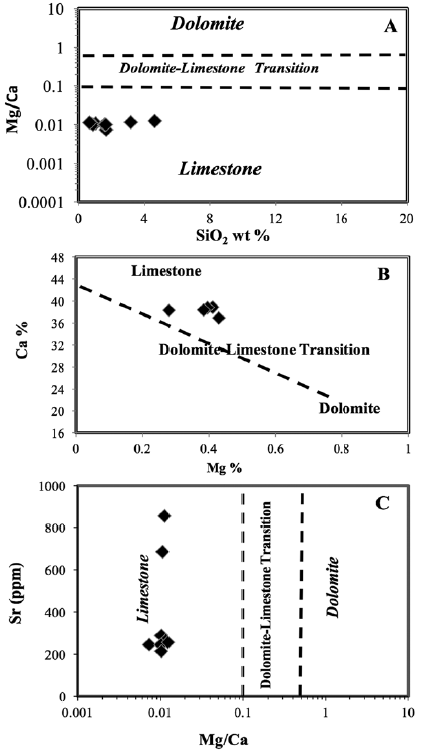
Figure 7 Lithological classification based on geochemical data for Gimo marble samples (after Melezhik et al., 2008); A. Mg/Ca vs. SiO2 diagram, B. Mg vs. Ca diagram, and C. Mg/Ca vs. Sr diagram.
In addition, the studied samples show a moderate concentration of Sr of 382.6 ppm (Table 2), and by using the Sr vs. Mg/Ca plot, the samples are projected in the field of limestone (Fig. 7C). The SiO2 content of some Gimo marbles exceeded 1 wt.% (Fig. 7A and Table 1), which is attributed to the presence of quartz veinlets and some silicate mineral such as chlorite that were identified by petrographic examination (Fig. 3).
The alkali content of carbonate rocks decreases with an increase in salinity and depth (Clarke, 1911). In general, the composition of a metacarbonate is largely controlled by the distance of its formation from the nearest continent and the topographic elevation at which it is deposited, as well as whether volcanism occurred nearby. All geochemical features of Gimo marbles are characteristic of limestone deposition in a continental basin (Zhang et al., 2017). The very low alkali content (Na2O + K2O < 0.1 wt.%) in the studied marbles indicates that the limestone protolith formed in a shallow, saline environment and was later metamorphosed.
In general, a high silica content of a limestone indicates that the basin of deposition of the protolith is near the shoreline (Brownflow, 1996); however, it sometimes reflects the inclusion of quartz veins and veinlets that form after deposition of the precursor sediment. In general, the silica content of marble is related to the availability of silicate minerals and chert nodules, which are produced as impurities in the protolith that may be formed after the deposition of the protolith or during metamorphism (Obasi and Madukwe, 2016; Mirza, 2019; Mirza, 2021). The petrographic study of the Gimo marble revealed the presence of quartz veinlets (Fig. 3F); hence, the silica content is mostly attributed to epigenetic events.
Useful information about the depositional environment of limestone can be provided by LILE ratios (Zhang et al., 2017). A ternary diagram of Rb-Sr-Ba can be used to distinguish limestones deposited in the open ocean, inland freshwater bodies, and continental margins (Fig. 8A). In general, marine limestones that form on continental margins can be distinguished from inland freshwater limestones based on their different Sr/Ba and Sr/Rb ratios, whereby both values are higher in continental margin limestones than in inland freshwater limestones (Fig. 8B). In the case of Gimo marble, all the studied samples are projected in the continental margin field.
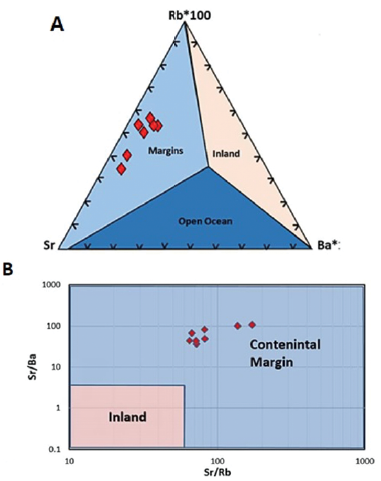
Figure 8 A. Rb-Sr-Ba ternary diagram and B. Sr/Ba vs. Sr/Rb discrimination diagram for limestones indicating a continental margin depositional environment for Gimo marble samples (after Zhang et al., 2017).
The enrichment and depletion of REE in carbonate rock may be influenced by various factors: (i) addition of terrigenous particles from the continent (McLennan, 1989), (ii) scavenging processes related to depth, salinity, and oxygen levels (Elderfield, 1988); (iii) biogenic sedimentation from the overlying seawater (Murphy and Dymond, 1984), and (v) authigenic removal of REE from the water column and early diagenesis (Sholkovitz, 1988).
REEs are relatively immobile during post-depositional processes, such as diagenesis (Cullers et al., 1979) and metamorphism (Muecke, 1979). To confirm the sedimentary nature of the protolith, it is necessary to investigate the geological characteristics of its depositional environment, which can be achieved in this case by assessing the trace element and REE concentrations. Haskin et al. (1966) and Jarvis et al. (1975) showed that the enrichment of REEs in marbles is positively correlated with the proportion of insoluble substances, such as quartz, clay, mica, silicate, and iron minerals.
According to Tanaka and Kawabe (2006), unaltered marine sedimentary carbonates are expected to preserve the chemical characteristics (i.e. REE ratios) of the medium in which the carbonates precipitated. However, care must be taken when interpreting REE contents in marbles, as they may also be influenced by the presence of non-carbonate materials, such as fine-grained siliciclastic material, especially when present in excess of 5 vol.% (Banner et al., 1988). Fortunately, petrographic and geochemical observations of the Gimo marble show that only negligible amounts of non-carbonate phases occur, and hence their impact on REE patterns can be assumed to be insignificant. In addition, the very low Er/Nd ratio (0.13-0.16) suggests that the Gimo marble is only very slightly influenced by the geochemistry of detrital materials. Tanaka et al. (1990) observed that concentrations of La, Nd, Sm, and Eu in coastal waters have a decreasing linear relationship, and the REE patterns of these waters are characterized by a marked discontinuity between Eu and Gd. Similar features are present for the REE patterns of the Gimo marble (Fig. 6), which indicates that their protoliths were deposited in a shallow, near-shore marine environment. This interpretation agrees with the negligible amounts of Na2O, Fe2O3, and MnO measured in the samples (Table 1) (Clarke, 1911; Turekiah and Wedepohl, 1961; Frank, 1975).
According to Zhang et al. (2017), the EREE of oceanic plateau carbonates is 1.31 ppm, but it is 10 -30 ppm for carbonates deposited along continental margins and in continental interiors. The REE content of the studied samples ranged from 10.61 to 34.95 ppm; hence, it is interpreted that the studied samples formed in a continental margin setting.
Boulvais et al. (2000) suggested that the REE distribution in marbles varies depending on the degree of fluid interaction that limestone experiences, such that patterns in these elements can be used to understand the nature of fluid flow during metamorphism.
According to Shields and Webb (2004) and Shields and Stille (2001), progressive REE scavenging during post-depositional modification may produce a positive correlation between the Ce anomaly and REE. However, the studied samples display a notable negative correlation between Ce/Ce* and total REE content (Fig. 9A), implying that such a diagenetic influence is absent. In addition, the correlation between Eu/Eu* and EREE in Fig. 9B highlights the enrichment of Eu in carbonate minerals and depletion of Eu in other minerals, which is interpreted to record Eu removal during metamorphism by the reduction of Eu3+ to Eu2+ (Jarvis, et al., 1975). The positive La/La* anomalies (average 3.64) and slightly flat Pr/Pr* anomalies (average 1.42), which are plotted in area IIIb of the Pr/Pr* vs. Ce/Ce* scatter plot (Fig. 9C) confirm that the Ce anomalies are not a relic of La interference.
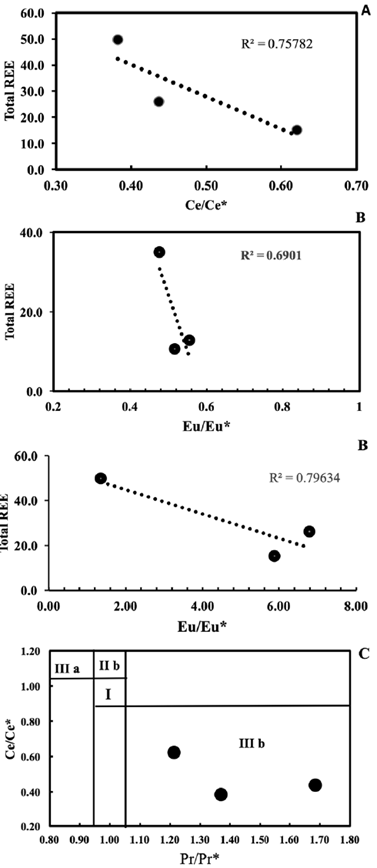
Figure 9 Variation diagram of EREE content vs. A. Ce/Ce* and B. Eu/Eu* for Gimo marble samples. Ce/Ce*= CeN / (2Pr- NdN ); Eu/Eu* = EuN/(SmN + GdN)0.5, where subscript N refers to normalised values taken from Taylor and McLennan (1985). C. Ce/Ce* vs. Pr/Pr* ratios diagram from Bau and Dulski (1996)
The significant negative Ce anomalies and slight positive Gd anomalies observed in the Gimo marbles (Table 3 and Fig. 6) indicate that their protoliths were carbonate rocks of sedimentary origin, and that they were deposited in marine environments (Özyurt et al., 2020). In addition, it has been suggested that a pronounced negative Ce* anomaly can be divided into three zones: (a) <0.5, (b) ~0.6-0.9, and (c) ~0.9-1.0 which represent oxic, suboxic and anoxic marine water, respectively (Chen et al., 2015). The Ce/Ce* anomaly of the studied samples ranges between 0.38 and 0.62 (with an average value of 0.48), indicating the oxidation of Ce3+ to less soluble Ce4+ that was removed continuously by scavenging (Sholkovitz et al., 1994; Tobia and Mustafa, 2019). Accordingly, the protolith of the studied samples was deposited in an oxygenated environment. A comparison of the REE contents of shallow marine carbonate rocks presented by Özyurt et al. (2020) with those found in this study, show that the studied Gimo samples exhibit the same pattern with strong fractionation of LREE over HREE with a negative Ce anomaly (Fig. 6).
It is also notable that the La-Nd-Sm-Eu contents of the Gimo samples define an inclined straight line and HREE (Gd-Dy-Tm-Er-Yb-Lu) contents show more flat patterns (Fig. 6). A low Er/Nd ratio (0.13-0.16) indicates that minor detrital material was present in the protolith.
The Y/Ho ratio can be used as a tracer to assess whether carbonate samples reflect primary marine signatures or siliciclastic components (Nozaki et al., 1997). According to Nozaki et al. (1997) and Zhang and Nozaki (1998), and high Y/Ho ratios (average of 61 ± 12) occur in the upper 200 m of seawater. However, other studies have proposed that typical Y/Ho ratios in marine carbonates that are free of contamination from terrigenous material show a wider range of values (44-74) or a chondritic value of 28 (Bau 1996, and Liu et al., 2019). The studied samples display high Y/Ho ratios with an average of 72.30 (40.0-132.0), which is consistent with detritus-free marine sediments (average 45.5), and defined as super chondritic.
Davou and Ashano (2009) reported that low concentrations of Na2O in marble indicate a shallow, near-shore, low energy, and 'clean water' marine environment of deposition for the protolith. A low Al2O3 concentration is also interpreted as indicating a low-energy environment.
Finally, several trace elements, including Zr, Hf, Th, and Al2O3, are considered to be particularly sensitive to shale contamination, as they occur in detrital alumina silicate minerals in much greater volume in average shale than in marine carbonate (Özyurt et al., 2020). The studied samples predominantly exhibited low Th (< 3 ppm), Hf (< 4 ppm), and Zr (< 22 ppm) contents, which supports the observation that contamination by detrital minerals is minor to negligible (Table 2). The constraints on the pre-metamorphic parent material of the Gimo marbles were derived from the discrimination plot of Na2O/Al2O3 vs. K2O/Al2O3 of Garrels and Mckenzie (1971), which shows that the studied marble samples fall within the field of sedimentary and metasedimentary rocks (Fig. 10A). The MgO-CaO-Al2O3 discrimination diagram of Leyreloup et al. (1977) (Fig. 10B) also supports a sedimentary origin, as the studied samples plot outside of the field defining a magmatic origin.
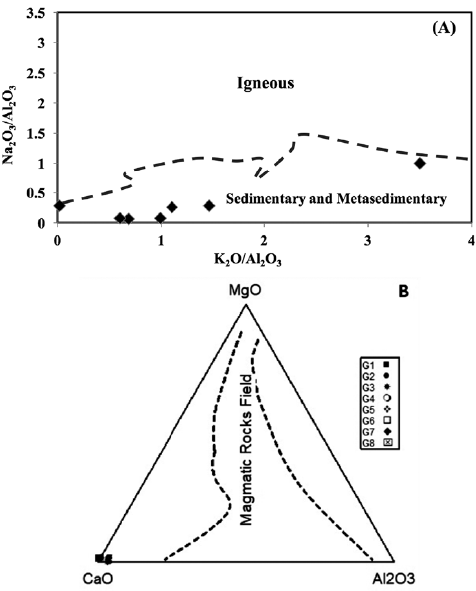
Figure 10 A. Na2O/Al2O3 vs. K2O/Al2O3 diagram for Gimo marble samples (after Garrels and Mackenzie, 1971); and B. Compositions of Gimo marble samples on a MgO-CaO-Al2O3 discrimination diagram (after Leyreloup et al., 1977).
6. Conclusions
1. From a petrographic perspective, the white and grey-colored Gimo marbles display similar mineralogical assemblages and mostly have homeo-blastic and mosaic textures. Carbonate minerals (calcite), quartz, chlorite, and ferric iron oxides and sulphides occur in trace amounts as accessory minerals.
2. The mineralogical and geochemical data correlate well with each other, suggesting that all marbles formed from the same source and/or the same geological process controlled the bulk composition. In addition, both field observations and the application of geochemical indices indicate that the Gimo marble is of sedimentary and metasedimentary origin.
3. 3- The absence of dolomite in the Gimo marble indicates that the pro-tolith of the studied samples was a relatively pure limestone prior to its metamorphism.
4. 4- The very low content of Th, Hf, and Zr in Gimo marble supports that contamination by detrital minerals is minor to negligible.
5. 5-The PAAS-normalised REE distribution patterns reveal slight enrichment in HREE, with negative Ce, and positive La anomalies (average La/ La*= 3.64) and a super chondritic Y/Ho ratio (average 72.3).
6. 6- The Ce/C* vs. Pr/Pr* relationships and the position of the studied samples in area IIIb indicate that they display real Ce anomalies and not an artefact of La interference.
7. 7- The REE pattern of the studied samples indicates that the protolith limestone formed in a continental margin setting. In addition, the significant negative Ce anomaly indicates that the protolith of Gimo marbles was a carbonate rock with a sedimentary origin that was deposited in an oxygenated marine environment.

