


 English (pdf)
 Article in xml format
 Article references
 Send this article by e-mail
 Cited by SciELO
  Cited by Google
  Similars in
SciELO
Similars in
SciELO  Similars in Google
 Permalink
Introduction
The forecast of seismic events implies estimating possible hypocentral parameters, the time of occurrence, and the magnitude of the predicted event. Conducting this type of forecasting is a complex task that poses important challenges related to understanding the mechanics of earthquakes, the permanent variations in the field of efforts, and the technology strategy to be used. To date, this type of forecast has been performed considering events that release large amounts of energy (M > 5-6), but the overall ability to forecast earthquakes, either individually or on a statistical basis, remains remote (Tiampo & Shcherbakov, 2012; Cicerone et al., 2009).
However, research groups from different countries have shed some light on certain precursor phenomena taking place before the occurrence of an earthquake. In the last decades, there has been remarkable progress in the techniques and methods used for earthquake forecasting on a global level. Physical process models such as Accelerating Moment Release (AMR), variations in the b-value and the M8 family of algorithms, among others; as well as the smoothed seismicity models, whose most relevant techniques are 1) the time-independent smoothed seismicity, 2) the Relative Intensity (RI) model or 3) the Proportional Hazard Model (PHM), account for the variety of available options, whose study and statistical modeling generate promising results in the matter (Tiampo & Shcherbakov, 2012).
The identification of electromagnetic precursors has also been the object of study as several hypotheses have been tested, e.g., models of DC electric field formation in the ionosphere by seismic events (Sorokin et al., 2005) or fractal and percolation theories. Another method consists of the identification of Seismic Electric Signals (SES), and more recently, the natural time analysis, based on the correlation between the occurrence of seismic events and the SES with the Varotsos-Alexopoulos-Nomicos (VAN) method, which has shown partial success in short and medium-term forecasts (Varotsos et al., 2019; 2006; 1993) and analyzes after the occurrence of large seismic events (Sarlis et al., 2021; 2015). However, its methodology and effectiveness have been tested, and the high rate of false positives have derived on low reliability of the VAN method to the point that, eventually, it would be the government that decides to issue an alert without adequate scientific support, leading this methodology to be an unproven hypothesis (Vargas et al. 2021; Helman, 2020; Lighthill, 1996).
The physical mechanisms proposed for generating electromagnetic emissions such as SES are related to piezoelectric, hydrodynamic, and electrokinetic effects, among others (Petraki et al., 2015; Freund, 2011; Hunt et al., 2007; Makarets et al., 2002; Ballato, 1995). Controlled experiments have been conducted that determine the characteristics of electromagnetic signals propagation, depending on the geographical conditions, conductivity, edge effects, among others (Huang, 2005). For example, quartz-free gabbro samples have been subjected to periodic stresses of up to 22 MPa, producing electric currents between 50 and 400 pA for dry samples and no current for the fully saturated ones (Dahlgren et al., 2014).
Reports of seismomagnetic effects (Stacey, 1964) and the use of ultra-low frequency (ULF) variations of the magnetic field before, during, and after an earthquake have positive results (Hattori, Han, & Huang, 2013; Hattori et al., 2013; Takahashi et al., 2007; Johnston, 1997; Park, 1996), unipolar magnetic pulses (Scoville et al., 2015) and, more recently, showing ULF magnetic field bursts containing electromagnetic pulses with a period between 15 and 20 seconds before M6.8 and M8.5 seismic events in April 2012 and September 2013 respectively, unassociated with lightning or magnetic storms (Swati et al., 2020) supporting the theory of ionospheric disturbance by acoustic gravitational waves (Singh et al., 2018).
This work tries to identify a possible relationship between electromagnetic (EM) signals recorded on the Earth's surface and medium and large-scale seismic events, under the hypothesis of the existence of EM precursors associated with seismic sources, which arise before seismic events, caused by established physical mechanisms (Clavijo Ramírez & Sánchez, 2016). The procedure to be followed involves recognizing and analyzing possible Seismic Electric Signals in the time domain, looking for anomalies before seismic events (Varotsos et al., 2013; Uyeda et al., 1999) through observation, identification, and analysis of other anomalies, both electrical and magnetic.
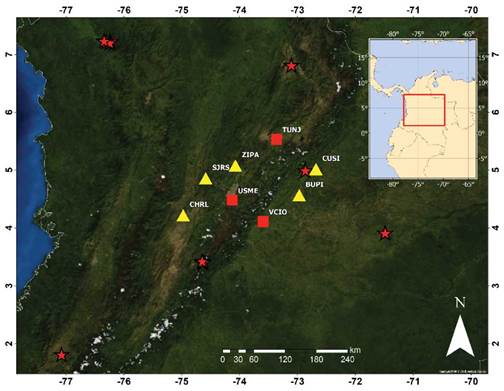
Figure 1 shows the location of three (3) permanent multi-parameter stations (recording of seismic, electrical, and magnetic signals) and the recorded earthquakes, with magnitudes Mw ≥ 4.2. As a result, magnetic disturbances, mainly long-term, have generated certain conjectures related to possible seismic precursors, aspects that are presented and discussed in this work.
Methodology
An instrumental deployment of multi-parameter stations was performed, acquiring seismic, electrical, and magnetic signals on the surface. With these data, we proceeded to identify possible correspondences between seismic events and EM disturbances before these events, in windows of up to 11 days (Varotsos et al., 1993). The seismic, electrical, and magnetic signal recording was performed in three stations of the Seismological Network of the National University of Colombia (RSUNAL); first, during 2016 and, later, during 2020. This experiment was performed using permanent, multi-parameter RSUNAL stations, part ofa project supported by COLCIENCIAS, the National University of Colombia, and the Antonio Nariño University (Solano Fino, 2017).
The RSUNAL is a hybrid arrangement of eight (8) triaxial seismic stations, seven (7) broadband, and one (1) short period. Three (3) of the seven (7) broadband stations are multi-parameter since they have five (5) additional channels, three (3) magnetic with orthogonal components, and two (2) electrical orthogonal on the surface (RSUNAL, 2021). This work used the data from the three (3) multi-parameter stations: USME, TUNJ, and VCIO (see Figure 1).
The sensors used in multi-parameter stations are:
• Broadband Seismometer CME 4311: Electrochemical transducer designed for permanent or portable installation. It is a robust instrument that is easy to install. In addition, it does not require maintenance, mass blocking, or leveling. The instrument offers an effective solution for installations with a noise level close to the low noise model with a response between 1/60 and 50 Hz (CME, 2021).
• Non-polarizable electrode for burial Tinker & Rasor DB-A: Copper and copper sulfate (Cu/CuSO4) electrode, non-polarizable, allows direct exposure of copper sulfate over a large contact area. It has a shelf life of up to 10 years. Its structure is made of PVC/ABS and has a low freezing point and high evaporation point, making it robust for most environments. Dimensions 7 cm in diameter, 12.2 cm tall, and a weight of 896 g (Tinker-Rasor, 2021).
• Magnetometer Bartington Mag648L: Low power, low noise triaxial magnetometer with ± 60 μT range. It has vehicular, perimeter security, and ground measurements applications (Bartington Instruments, 2021).
The multi-parameter stations were designed and assembled in the Geophysics Instrumentation Laboratory (LIG) of the Geosciences Department of the National University of Colombia. Consist of a 10-inch PC and three hardware devices communicated through USB ports: an acquisition card (7 differential channels at 16 bits and a sampling frequency up to 3 kHz), a GPS 18x LVC (Garmin International Inc., 2011), and a 3G modem for sending data via cell phone.
All the elements previously described are installed in a resistant case, with external connection ports for sensors (broadband seismometer, electrodes, and magnetometer), 3G USB modem, GPS, and power. With them, low electromagnetic noise levels are achieved. Each station stores and sends data from three seismic, two electrical, and three magnetic channels in near real-time. According to the Seed Reference Manual (Ahern et al., 2014), the nomenclature of the channels is shown in Table 1.
Table 1 Channels nomenclature used on multi-parameter stations.
| Sensor | Chanel | Nomenclature |
|---|---|---|
| Seismometer | North | BHN |
| East | BHE | |
| Vertical | BHZ | |
| Dipoles | North | HQN |
| East | HQE | |
| Magnetometer | North | HFN |
| East | HFE | |
| Vertical | HFZ |
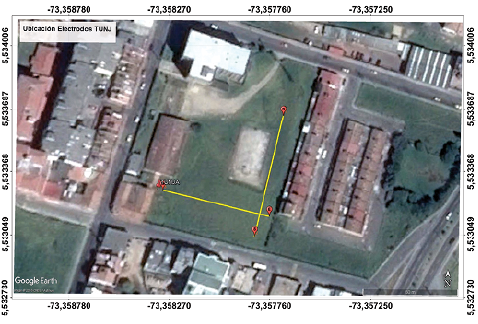
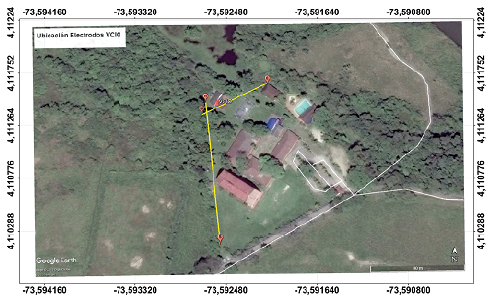
The multi-parameter stations are installed at the Usme (Bogotá), Villavicencio (Meta department) and Tunja (Boyacá department) campuses of the Antonio Nariño University - UAN (UAN, 2021). Its installation was performed following the general recommendations for SES measurement (Varotsos et al., 2006a). The digitizer, the seismometer, and the magnetometer were installed inside a 1 m x 1 m x 1 m booth, with access to the urban electrical power supply. The electrodes were installed according to the possibilities of terrain and topographic dimensions offered by each of the UAN campuses. The electrodes locations at each station, forming quasi-orthogonal dipoles, are shown in Figures 2, 3, and 4, including their lengths.
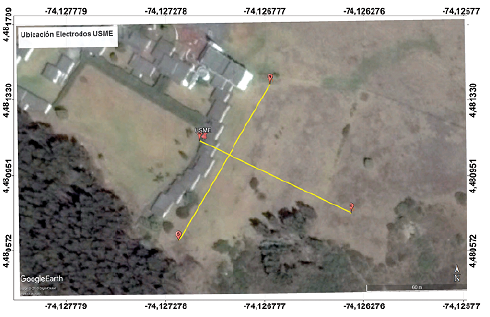
A coaxial cable connects the electrodes and digitizer to reduce EM noise. The cable connection to the electrode was protected with silicone to reduce corrosion. Each electrode is buried approximately 50 cm deep.
Data processing
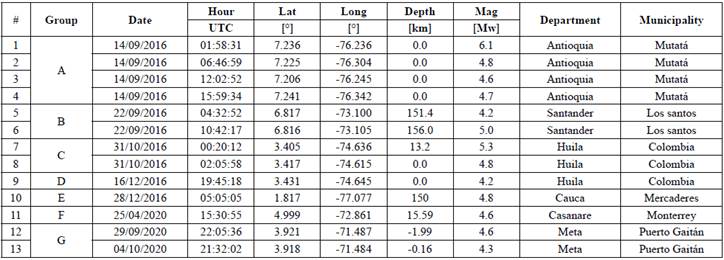
Once the data were acquired, the authors selected the period to be analyzed. Considering that the SES could be recorded from minutes before and up to 11 days before a seismic event (Varotsos et al., 1993), the period for analysis began 11 days before the selected event and ended 24 h after the event to verify the possible presence of post-event disturbances. The considered seismic events were those with magnitude M ≥ 4.2, with an epicenter at a distance no greater than 150 km from any station or up to 300 km if the magnitude of the earthquake was Mw > 5. Table 2 shows the considered earthquakes. Group A seismic events belong to the Mutatá thrust Fault, with high angle, 150 km length and directly influenced by Murindó (left lateral, 60 km length, N12.6W strike) and Urumita (thrust, 300 km length, Chocó-Panamá, and North Andes boundary) faults (Reyes García, 2019). Group B earthquakes come from Los Santos (or Bucaramanga) Nest at 60 - 150 km depth, possibly due to the collision of subducted Nazca Plate and old Farallon Plate detached slab by delamination lithosphere effect (Chicangana & Vargas, 2008). Group C and D earthquakes are related to the Algeciras Fault System near the Altamira Segment on the SW Colombia; it has right lateral displacement with neotectonic features involving basement and sedimentary layers. The Altamira thrust fault has a sinuous trend with N45°E strike and SW dip between 50° and 70° (SGC, 2016). Group E seismic event is related to the Nazca Plate subduction at 170 km depth but with a normal fault focal mechanism associated (7°, 61°, -124°; 241°, 44°, -45°) according to the SGC. Group F seismic event comes from the Colombian Llanos foothill delimited by two inverse fault systems: Guaicaramo and Cusiana (SGC, 2010), the event has a thrust focal mechanism (351°,36°, 41°; 226°, 67°, 119°). A hypothesis related to group G events relates to the deep injection of co-produced wastewater from oil and gas extraction (Gomez Alba & Vargas, 2020).
Results
Registered data
The data gathered at USME, TUNJ, and VCIO stations were processed, including traces merging, gap and overlaps elimination, and application of different filters (Solano-Fino, 2017). Also, scaling of the data to the corresponding units of electric potential [V] and magnetic field [nT] in windows of 11 days before each event (or set of events) was performed.
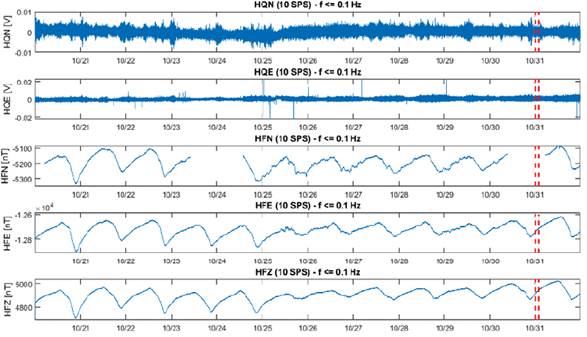
Figure 5 Electrical and magnetic data. USME station. 11 days' period. Group C earthquakes (discontinuous red lines).
Herein authors show the results of processed data gathered at the three stations for the set of events of group C (Table 2) since this data has better quality and more visible anomalies. Figures 5, 6, and 7 show the electrical and magnetic data acquired in the five (5) EM channels at USME, TUNJ, and VCIO stations, 11 days before and one after the two earthquakes corresponding to the group C. Magnetic (HQx) and electrical (HFx) disturbances are marked in green.
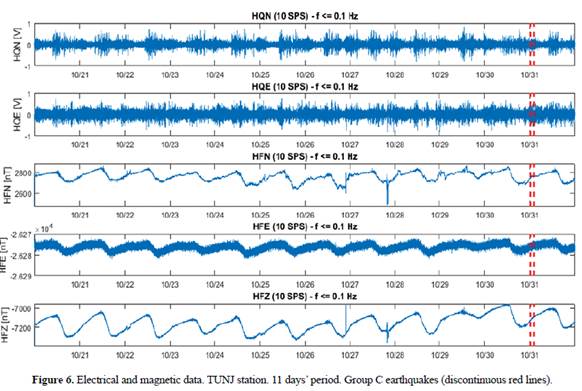
Figure 6 Electrical and magnetic data. TUNJ station. 11 days’ period. Group C earthquakes (discontinuous red lines).
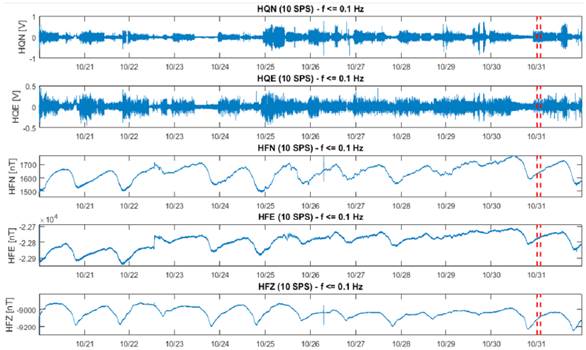
Figure 7 Electrical and magnetic data. VCIO station. 11 days’ period. Group C earthquakes (discontinuous red lines)
The authors were able to see that the HQN and HQE electric dipole channels do not present identifiable SES. The electrical disturbances are consistently above the DC level of the signal, which, in this case, is equal to 0 V. It was observed that signals from the USME station have a low noise level in its electrical channel, while the TUNJ and VCIO stations have noise that sometimes reaches 1 V pick-to-pick. There is a defined 24-hour cycle of alternating from low noise (12 h duration) to high noise (12 h duration), possibly due to the operation of some electromagnetic devices in the vicinity of the stations. Spectral analysis of the electric field data showed the signal's randomness since there were no amplitude peaks in dB/Hz in relation to SES or another type of signal, different from noise.
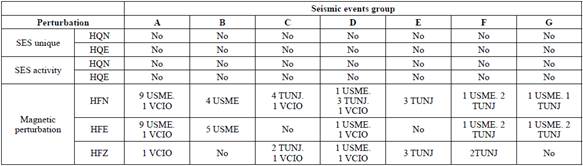
The HFN, HFE, and HFZ magnetic channels show variations in the magnetic field related to the Earth's rotation with an approximate period of 24 h and minor disturbances, possibly due to cultural noise (radio, television, cell phones). However, some disturbances could be related to seismic events. Table 3 summarizes the disturbances found in the five electromagnetic acquisition channels. Authors were able to identify slow signal variation only on time since these signals were filtered below 0.1 Hz looking for more identifiable particularities at very low frequencies.
Discussion
Measurements of electrical potential differences, performed using non-polarizable dipoles, do not allow establishing a causal relationship regarding seismic events with Mw ≥ 4.2 for the period evaluated in this study. The gathered data yields inconclusive results regarding the behavior of electric field disturbances. This applies to both one-time SES and SES activities. For this reason, in this work and for the analyzed time windows, it is not possible to associate some variations in the electrical signal as precursors with the earthquakes selected for the study. The performed spectral analysis neither shed any light on the behavior of the anomalies, despite their use in other works (Swati et al. 2020).
Although authors do not observe SES in the electrical channels (HQx), changes are observed in the magnetic signals' ultra-low-frequency (ULF) amplitude before a seismic event. It is a decrease in the intensity of the daily peak-to-peak magnetic field with an increase on the average in the same period, days before or almost simultaneously with the occurrence of the earthquake. For each observed anomaly, the period was doubled to 22 days to check that there was no similar disturbance before the 11 days' window.
Only stations with visible anomalies are displayed. Visual inspection would make it possible to identify the presence or absence of more anomalies and, therefore, the possibility that they serve as an empirical precursor of a seismic event. This can be seen in Figures 8, 9, 10, and 11 (for 2016) and Figures 12, 13, 14, and 15 (for 2020), where the anomalies remain unique for each 22-day window, supporting the hypothesis that they may be precursor disturbances of seismic events in the cases and stations here described. Note that anomalies can occur even when high-frequency noise is present in the trace. There is new evidence on magnetic susceptibility variation due to the Wenchuan earthquake with slip dynamics linked to high-temperature thermal (Liu et al., 2016) and the Tohoku-Oki earthquake where the magnetic fabric of the subduction wedge accretion prism indicates abrupt coseismic changes (Yang et al., 2013).
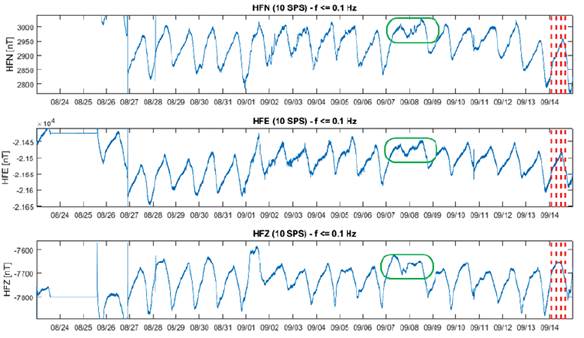
Figure 8 Low-frequency amplitude anomalies (on green) before the group A earthquakes. Station VCIO. 22 days' window.
However, the data obtained from the magnetic sensors of the three stations in some channels or, in other cases, in all channels, allows us to see not only the periodic variations of the magnetic field because of the Earth's rotation but also is possible to identify minor disturbances that could be associated with seismic events. Although these associations of alterations in the magnetic field to a particular seismic event are merely suggestions, a long-term study with a more significant number of stations could be more indicative of the possible presence of magnetic precursors detectable by the RSUNAL multi-parameter stations including, if they exist, selectivity (the soil ability to allow EM signals reach the surface) and proportionality (direct relation between the EM anomaly amplitude or duration and the seismic event magnitude) properties on this phenomenon (Varotsos et al., 2006b).
Magnetic anomalies are described in detail below. In Figure 8, the VCIO station shows a reduction in the magnetic field peak-to-peak between September 7th and 9th, starting seven (7) days before the four (4) Mutatá 2016 seismic events (group A); this corresponds to 70% the usual 24 h peakto-peak. There is noise between 09/01 and 09/04 related to geomagnetic storm conditions according to the daily planetary A-index with values between 28 and 40, from 09/05 to 09/08 A-index is less than 17, which does not apply for a storm, and after 09/09 values are less than 8 (National Oceanic and Atmospheric Administration, 2021). Although a low peak is absent at 18:00 on 09/08, an ionospheric electric field reversal cannot be assumed since there is no electric field or electron or current density data support (Rastogi, 1997).
Figure 9 shows, on USME station, a 50% peak-to-peak reduction, starting on September 19th, three days before the Los Santos seismic events (group B), with a duration of about 40 h. On USME station, a five (5) days anomaly starting on September 25th preceded the group C seismic events in Colombia (Huila) with a 50% peak-to-peak reduction continuing after the events and including a high-frequency noise increase (Figure 10).
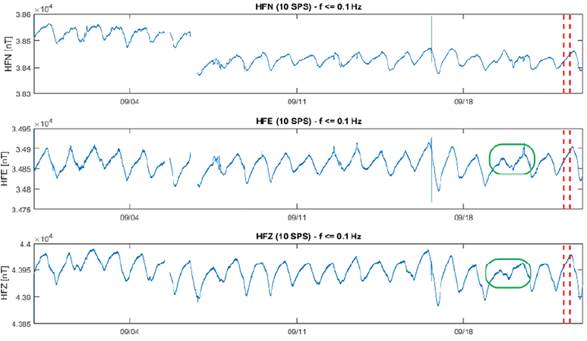
Figure 9 Low-frequency amplitude anomalies (on green) before the group B earthquakes. Station USME. 22 days' window.
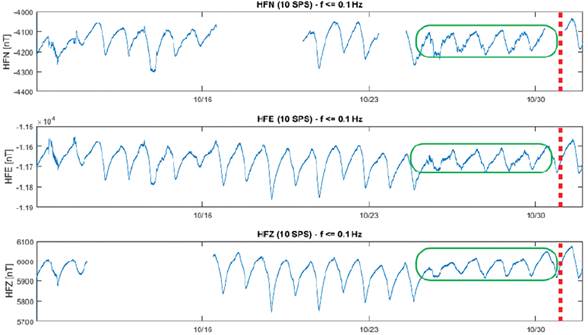
Figure 10 Low-frequency amplitude anomalies (on green) before the group C earthquakes. Station USME. 22 days' window.
The magnetic signals recorded on VCIO station before group C (Colombia, Huila) seismic events (Figure 11) show a 50% peak-to-peak amplitude reduction beginning three (3) days before them and disappear 12 h before the earthquakes. In Figure 12, the USME station lacks the vertical magnetic channel before the group F Monterrey (Casanare) seismic event. Still, the horizontal channels show an anomaly stopping exactly when the earthquake occurred and beginning on April 21st, with a duration of approximately 70 h and a 30% reduction in amplitude.
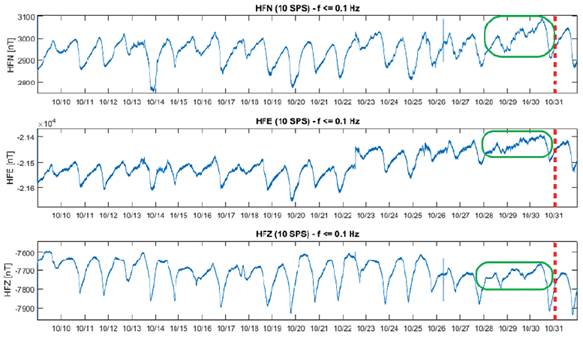
Figure 11 Low-frequency amplitude anomalies (on green) before the group C earthquakes. Station VCIO. 22 days' period.
In Figure 12, the USME station lacks the vertical magnetic channel before the group F Monterrey (Casanare) seismic event. Still, the horizontal channels show an anomaly stopping exactly when the earthquake occurred and beginning on April 21st, with a duration of approximately 70 h and a 30% reduction in amplitude. In Figure 13, the TUNJ station exhibits what seems to be electronic acquisition noise on the East-West and vertical channels before the Monterrey event until April 16th; however, North-South channel and after April 16th, all the channels show good quality data, and between April 22nd and 25th a reduction of 30% the peak-to-peak amplitude can be seen occurring 3.5 days before the seismic event. Both Figures 12 and 13 do not show a simultaneous high-frequency noise with the low-frequency anomalies.
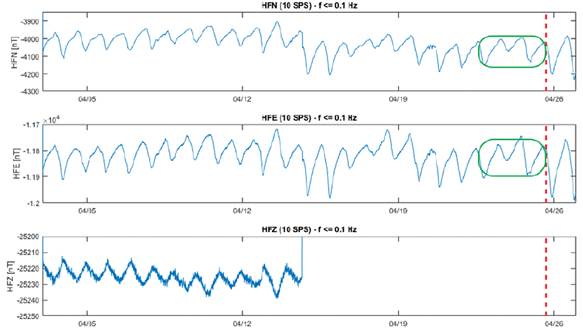
Figure 12 Low-frequency amplitude anomalies (on green) before the group F earthquake. Station USME. 22 days' period.
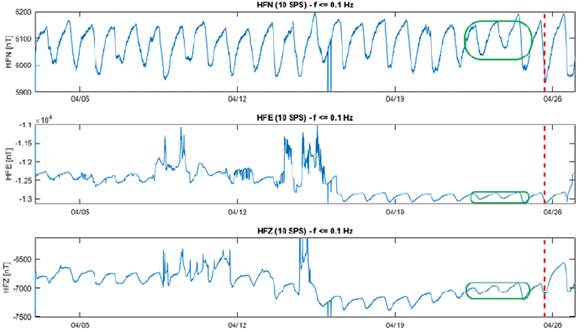
Figure 13 Low frequency amplitude anomalies (on green) before the group F earthquake. Station TUNJ. 22 days' period.
Due to electronic saturation (Figure 14), the vertical magnetic channel at station USME is not present. Two anomalies can be appreciated occurring before the Puerto Gaitán (Meta) group G events; both anomalies last about 65 h with a 50% reduction in the amplitude and begin seven (7) days before the September 29th Mw4.6 event, and six (6) days before the October 4th Mw4.3 event. The second anomaly coincides with the first event, and, in both cases, high-frequency fluctuations are present. Finally, in Figure 15, station TUNJ has noise on the vertical magnetic channel, probably due to electronic acquisition problems or on-site cultural noise; however, horizontal channels operate properly and show an anomaly seven (7) days before the September 29th Mw4.6 Puerto Gaitán (Meta) event with a duration of 80 h and 50% amplitude reduction, there was no anomaly before the October 4th Mw4.3 event. So far, the presence of such magnetic anomalies lacks a model considering earthquakes' magnitude and location and the geology setting of each station. Still, there are clear tendencies: the anomalies last between two (2) and four (4) days, begin from three (3) to seven (7) days before the earthquake(s) and show a 30% - 70% peak-to-peak amplitude reduction compared with the pre and post magnetic data.
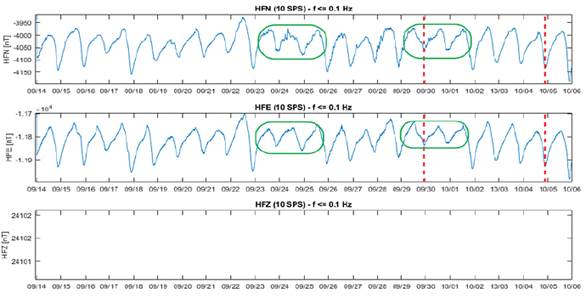
Figure 14 Low-frequency amplitude anomalies (on green) before the group G earthquakes. Station USME. 22 days' period.
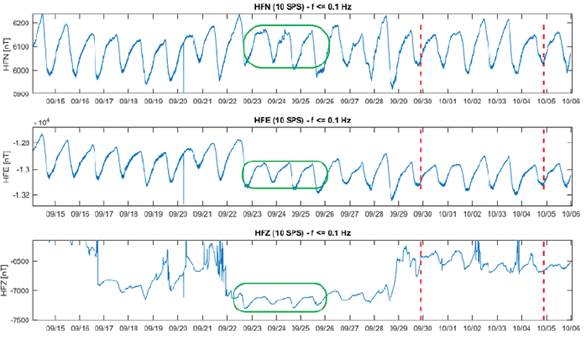
Figure 15 Low-frequency amplitude anomalies (on green) before the group G earthquakes. Station TUNJ. 22 days' period.
In this way, considering the above exposed, it is prudent to conclude that in this work, no clear evidence of electrical nor magnetic precursors of seismic events has been identified, despite having detected disturbances in these signals.

