


 English (pdf)
 Article in xml format
 Article references
 Send this article by e-mail
 Cited by SciELO
  Cited by Google
  Similars in
SciELO
Similars in
SciELO  Similars in Google
 Permalink
1. Introduction
Resource degradation occurs gradually but monitoring land and water resources can help prevent potential hazards (Masoudi and Amiri, 2015; Masoudi et al., 2018; Morales and Zuleta, 2020). More than 250 million people are directly affected by desertification, and more than one billion people in 100 countries are at risk of desertification and land degradation. It threats about 6 million hectares of the world's land. Two thirds of Iran's lands are under desertification or degraded. Unfortunately, due to natural and human factors, land degradation is progressing recently (Gibbs and Salmon, 2015; Dubovyk, 2017; Ferrara et al., 2020). Since four hundred years ago, 30 % of the natural forests and rangelands converted into pastures and farmlands and caused soil organic carbon loss, soil structure decline and changes in soil physical and chemical properties (Yaghobi et al., 2018; Afcaal et al., 2020). More than two-thirds of Iran has arid and semi-arid climate and drought, air pollution and climate change contributed to Iran's current environmental crisis especially in the central, west and southwestern regions. Now, the major land-degradation research focuses on the evaluation and monitoring based on the different data sources, conservation and ecological restoration, and determination of driving factors at different spatial and temporal scales, trend simulation development and predictive quantitative models (Xie et al., 2020).
Various models are introduced for land degradation monitoring such as FAO-UNEP (1984), Environmental Sensitive Area; ESA (Kosmas et al., 1999), Modified Iranian Classification of Desertification; MICD (Ekhtesasi and Mohajeri, 1995), The Global Assessment of Soil Degradation; GLASOD (Oldeman et al., 1991), Global Assessment of the Status of Human-induced Soil Degradation; ASSOD (Van Lynden and Oldeman, 1997), The Land Degradation Assessment in Dry lands (LADA) (FAO, 2002); The Iranian Model of Desertification Potential Assessment (IMDPA) (Ahmadi, 2008). The models considered various criteria and indices to evaluate potential resource degradation and many of these models determined fluctuations of groundwater through years and seasons. These models provided vital information for farming plans, farming dates and rangeland improvement and development programs. For the reason of fragility in dry land ecosystem, reliable sources of water like groundwater should be provided (Shammout et al., 2018; Chen et al., 2020). Various authors emphasized that extraordinary consumption of the world's groundwater, mainly in most of the Middle Eastern countries, has affected the quality of groundwater and has contributed to the reduction of crop per unit area in farmlands (Verner et al., 2013; Parizi et al., 2019; Mirzaei et al., 2019). Therefore, the wise management of resources guarantees the survival of human societies (Mohanty et al., 2010). And because of climatic and topographic conditions in Iran, groundwater is very important in ensuring food security (Ashrafzadeh et al., 2016). Groundwater is the main resource of water for the agriculture industry (Jafari et al., 2018). A couple of years back, in the absence of land use planning, a huge volume of groundwater was consumed which led to financial problems (Wu et al., 2020). The central plains of Iran are facing the complication of the declining level of groundwater because of the lack of permanent rivers and dams, mismanagement of water bodies, climatic variability, and anthropogenic activities. Therefore, monitoring groundwater level is vital to controlling and predicting the consumption rate. Due to the reason that the measurement of the level of groundwater in aquifer plains is a time-consuming process, the estimation of the level of groundwater here has a higher priority than other locations.
Looking at literature in the field of agriculture and water resources, many of the researchers are interested in methods with smallest number of variables to monitor and predict the level of groundwater. Recent approaches in non-classical methods have also raised the bias in the application of spatial statistics for realization of spatial replacements (Jeihouni et al., 2015). The level of groundwater indicates groundwater availability, groundwater flow, and the substantial attribute of an aquifer (Nair and Sindhu, 2016; Alqadi et al., 2019). Several models have been used to evaluate groundwater quantity and quality in the world (Bodrud-Doza et al., 2016). Statistical models and spatial interpolation have been compared in different studies, such as environmental sciences (Abudu et al., 2010; Parmar and Bhardwaj, 2014; Khaki et al., 2016; Meshram et al., 2020). In recent decades, artificial intelligence systems are used as analyzing tools to study issues related to water and environmental sciences (Jeihouni et al., 2015; Wu et al., 2020). Artificial neural network (ANN) is beneficial in a position where the fundamental real process relationships are not completely understood and well-suited in modeling dynamic systems on a real-time basis (Lim and Kolay, 2009). ANNs operates on the principles of learning from a training set. Before training, the network does not have any earlier information about the type of problem (Bessaih et al., 2014). ANNs show a smooth but accurate result of many imagery issues (Suprayogi et al., 2020; Iqbal et al., 2020). Several articles have, heretofore, studied the utilization of ANNs in the field of water resources (Kazemi and Hosseini, 2011; Yesilnacar and Sahinkaya, 2012; Pektas and Dogan, 2015; Sebghatiand Gholami, 2019). ANN is an applicable estimation tool for groundwater levels in areas without information or inadequate observation points. (Sethi et al., 2010; Karimi et al., 2012; Rankovic et al., 2014; Khaki et al., 2015; Alizamir et al., 2017; Mohanty et al., 2010; Lohani and Krishnan 2015; Porte et al., 2018; Chitsazan et al., 2013; Nair and Sindhu, 2016)
Accordingly, the Partial Least Square Regression (PLSR) method was initially used as a calculation algorithm for special vectors, but was quickly interpreted by statistical criteria. In fact, the general idea of PLSR is to find the hidden variables. The hidden variables are quantitative variables which explain the variability of the response variable (Chun and Keles, 2010; P. Roy and K. Roy, 2008). The PLSR technique admits examining the relationships between visible and hidden variables simultaneously (Wold et al., 2001). This method uses two outer and inner test models that apply a two-step complex process to estimate weights (Tekin et al., 2014). Recently, PLS regression has been applied to soil and groundwater mapping (Ibrahim and Wibowo, 2013; Dhungana, 2015; Humbert et al., 2015; Tzanakakis et al., 2015; Kawamura et al., 2017; Gad et al., 2020). Adaptive Neuro-Fuzzy Inference Systems (ANFIS) and ANN can be regarded as powerful tools in the statistical model identification algorithm and to produce a simple model by virtue of competency of task estimation and categorization (Gong et al., 2018; Emamgholizadeh et al., 2014). Fuzzy models propose interest over mathematical ones; the process of inference is close to human logic and easier to measurement with complicated non-linear methods. Moreover, these methods are advantageous and more functional to specialist modeling researchers (Esen and Inalli, 2010).
ANFIS adopts a special system of fuzzy inference with a back-propagation algorithm founded by a group of input data and output data (Babuska, 1998). ANFIS was first declared by Jang (1993). Tan et al. (2017) assumed the ANFIS approach to measure country sustainability performance. They found that using ANFIS, evaluation validity as it may be better through sublevel choice of training samples by other data from UN-Habitat, or World Bank, or even new data sets. Solgi et al. (2016) applied ANFIS models for predicting Biochemical Oxygen Demand in the Karun River in the western part of Iran. Ahmed and Ali-Shah (2017) applied ANFIS to predict of BOD in Water River. They concluded that ANFIS is a convenient method to investigate BOD with advisable validity, suggesting the ANFIS method is a beneficial tool for water quality parameter analyses. Almuhaylan et al (2020) mentioned the ANFIS can provide more accurate, the anticipation of groundwater depth. In this study, we determined the efficiency of non-linear algorithmic models in predicting the level of groundwater and evaluating land degradation with a small number of variables. The purpose of our study is to compare ANN, ANFIS and PLSR methods for assessing groundwater level in Sharif Abad watershed and determine the severity of groundwater degradation.
2. Materials and Methods 2.1.
Study Area
The Sharif Abad watershed is located in between 34° 37' - 34°56'N and 50°31' - 51°02'E covering an area of 96787 ha. In central part of Iran, Qom Province, Iran (Fig. 1). The study area is very important in the production of pistachio and alfalfa. At present, 37% of the watershed area is under farmlands and orchards (over 35,000 ha). 24,000 ha out of 35,000 ha are alfalfa fields and pistachio orchards. According to the Iranian Ministry of Agriculture, in 1989, the area of pistachio orchards and alfalfa fields was 5,000 ha, indicating a 7-fold increase in the farming area. The rangelands are converted to farms and orchards and drilling numerous water wells increased the farming intensity. The climate of the area is arid, and the average rainfall is 145.3mm.
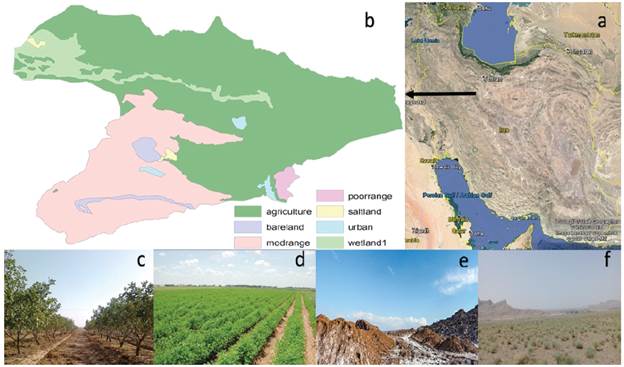
Figure 1 Location of study area in Iran map (a) land uses in the Sharifabad watershed, Iran (b), agriculture lands(c and d), bare land (e), rangland (f)
Groundwater data of 24 Piezometric wells from 2002 to 2016 was used to do modelling studies using PLS Regression, ANN, and ANFIS. In addition to monthly rainfall, topographic wetness index (TWI), distance of the river (m), latitude and longitude in the Universal Transverse Mercator (UTM) coordinate system were explained input and level of groundwater set an output of each method. However, to activate the over fitting condition, in all models, 70% of the data was applied for model training, while 30% of data were employed for testing and validation. The coefficient of correlation is calculated as the criterion of a linear relationship between observational and estimated values (Rankovic et al., 2012). A brief description of models is demonstrated in sections.
2.2. Partial least square regression (PLSR)
Partial least square regression (PLSR) is a modern method of predictive modelling, which works with large data matrix and collinear variables. PLSR was first developed by Wold (1985) but the theoretical basis of PLSR was developed by Varmuza and Filzmoser (2009). PLSR generalizes the important aspects of multiple linear regression (MLR) and Principal component regression (PCR). Ordinary least square (OLS) regression works well with a full rank matrix of predictors (X) but when X is singular, PLSR takes care of the problem. PLSR extracts the factors from X and Y matrices and maximizes the covariance.
PLSR uses the linear decomposition of X and Y as: X = T Pt +Ex and Y = UQt + Ey
Where T = X-scores and U = Y-scores
P = X-loadings and Q = Y-loadings, Ex = X-residuals and Ey = Y -residuals Using the U, PLSR automatically predicts Y. T and U are linear combinations of X and Y variables, respectively. Suppose tj, uj, pj and qj denote the jth columns of T, U, P, and Q respectively, where (j = 1..., a).
2.3. Artificial neural networks
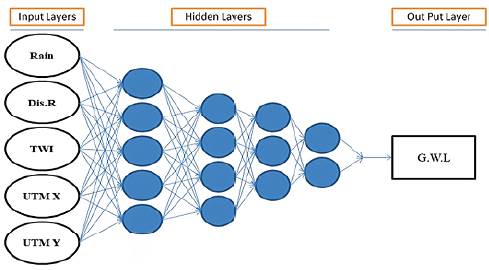
The artificial neural network (ANN) is a computational approach introduced to model the neurons' function in living tissues. McCulloch and Pitts (1943) developed a mathematical analysis for ANN from algorithms and applied mathematics called Threshold Logic to it. Choosing the right number of neurons and layers provide a better model of the artificial neural network (Ennouri et al., 2017). In neural networks, neurons are responsible for processing. In fact, each neuron is associated with a set of its preceding and subsequent elements, which, this non-linear relationship provides the prediction of target data (Alipour et al., 2014). Li et al. (2018) proposed that ANNs can be used at events that do not have the structure and complexity of the relationship among output data and input information. Network models, Multilayer Perceptron's (MLPs), Generalized Feed forward networks (GFF), Modular Neural Networks (MNN), Radial basis function (RBF) trained by Momentum Optimization Algorithm (MO), Levenberg-Marquardt algorithm (LM), Conjugate Gradient (CG) Learning Rule, Sigmoid Axon and Tanh Axon as transfer function were selected and compared in Neurosolution software. Four hidden layers were used to regulate the weights of neurons to achieve the desired output. For network model, in addition to rainfall, distance Piezometer well from the Qara-Chai River, topographic wetness index (TWI), latitude and longitude were also considered as the input and groundwater level was defined as the output (Fig. 2). The TWI indicator is shown in Equation-1. TWI Index is a helpful tool for describing the humidity conditions in the watershed scale, presented by (Grabs et al., 2009). TWI index of each Piezometer was calculated using DEM in Saga GIS software (Eq.1).
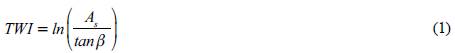
Where β is the local slope (radians) and As is the contributing area of upstream (m2).
2.4. Adaptive Neuro-Fuzzy Inference System (ANFIS)
Adaptive Neuro-Fuzzy Inference System (ANFIS) approach applied two networks learning algorithms - Neural and Fuzzy logic, for scheming nonlinear relations between dependent and independent variables. It enables fuzzy laws to be determined and prepare data for the expert. Furthermore, it could transform the intricacy of human sagacity into fuzzy systems category (Alipour et al., 2014). There are various joined nodes in the structure of an ANFIS model. The output of some nodes is reined by accommodating variable joint the node, so the output data would predict a predefined error value. This showed that some nodes are examined to have an adaptive part in the structure of the method (Baghban et al. 2017).
The frame of ANFIS involves five layers (Fig. 3), and the functions correlate with nodes of the matching layer is similar. Each input has two rules (A1 and A2, B1 and B 2) in the initial layer (input nodes), which can make two rules in another layer (rule nodes). A brief diagram of the operations of the five layers is given as follows (Jang, 1993): Layers 1 through 5 composed of input nodes, rule nodes, average nodes, resulting nodes and output nodes. The rules of every single layer are introduced in equations two to seven, respectively Equations 2 to 7.
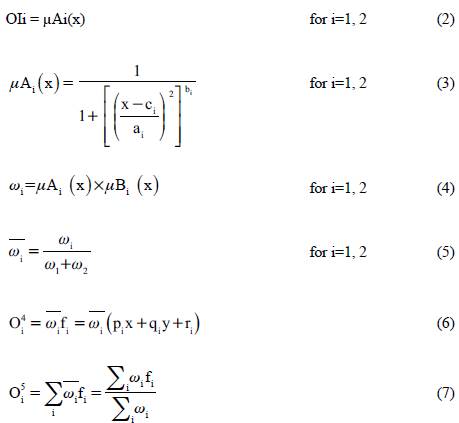
Formula: Where x is the input to the node i, and Ai is nominal labels ruled by fit membership function µAi; {ai, bi, ci} is the variable collection. Here {pi, qi, ri} is the variable lay in the consequent sector of the first-order Sugeno fuzzy model.
In this study, Takagi-Sugeno-Kang Type Fuzzy (TSK) and Tsukamoto (TS) fuzzy models were tested and Momentum, Levenberg-Marquardt and Conjugate Gradient learning rules used. For any of the algorithms, the Sigmoid Axon and Tanh Axon transfer model were used.
2.5. Land degradation assessment model
Land degradation research has been done in 93 countries. The number of publications in different countries show their contribution and impact in land degradation research. Researchers from 93 countries participated in the land degradation research between 1990 - 2019. In regard to total publication, Iran was the 21st nation (Xie, 2020).
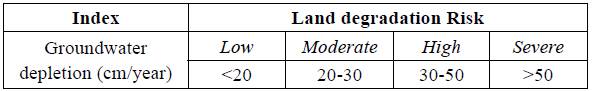
Land degradation in arid regions of the world is a complicated environmental puzzle (Thomas, 1997; Okin et al., 2009; Rasmy, 2010). It is accepted as one of the greatest environmental risks in Iran because of its natural conditions and human activities (Tahmoures et al., 2013). As previously mentioned, several models have been developed for the judgment of soil and water resource degradation in world scientific communities. To assess the potential of land degradation, Ahmadi (2008) presented The Iranian Model of Desertification Potential Assessment (IMDPA). This model involves nine classes of criteria that causing effective of land degradation. Groundwater depletion (cm/year) in watershed aquifer resources is one of the factors, which used to estimate degradation risk of water resources. Table 1 shows the land degradation potential of groundwater index.
2.6. Model evaluation and Prediction
The prediction performance of both the training and testing sets is evaluated by the coefficient of determination (R2) and Mean squared error (MSE) Esq. (8-9). The calculation formula according to Webster and Oliver (2001) is:
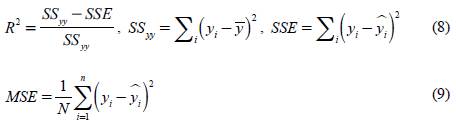
Where  is predicted and y¡ is observed data and N is the number of observations. MSE is the average squared difference between predicted values by the model and measured values. MSE is an indicator of model accuracy or precision. MSE should be as low, or close to zero, as possible. The coefficient of determination (R2) establishes a linear correlation between measured values and simulated ones by model. The value of 1 is optimal and shows the positive linear relationship. After model evaluation, the best model was selected using R2. The farming season and/or the heavy use of groundwater and water well do not start until around April, so we predicted the level of groundwater for April 2025. Looking at TWI index, the distance from river and latitude and longitude variables, they all have spatial information and only monthly precipitation has spatial-temporal characteristic. Using the linear regression relationship between monthly precipitation and elevation of synoptic station, the precipitation of 24 Piezometric wells was calculated for April 2025 and was also used in predictive model. After that, interpolation was carried out via the ordinary kriging method and groundwater level of April 2025 was also calculated, where the depletion maps were prepared by subtracting presents year map and the map from the previous year. After subtraction, the potential desertification map for years 2002, 2010, 2016 and 2025 (prediction year) was prepared. Figure 4 shows the procedures of calculation.
Receiver operating characteristic curve (ROC) is a classifier or diagnosis method. The efficiency of binary classifier can be evaluated with sensitivity and recall indices. In ROC graph, a combination of these two indices are presented as a curve. Researchers test efficiency of the cluster algorithms or raster data using ROC curve. This technique has been frequently used in supervised machine learning. ROC curve is value of true positive rate over the false positive rate in the confusion matrix. since the classes are based on continuous random variable, the curve is continuous function which can be estimated from data.
3. Results
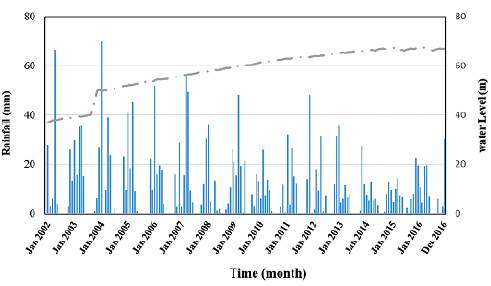
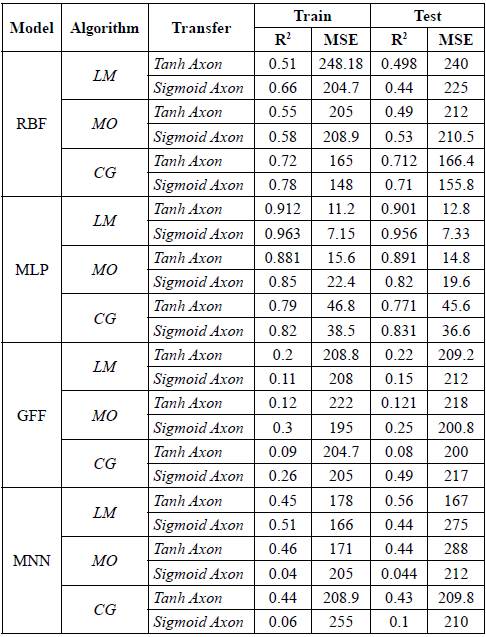
We predicted the level of groundwater of 24 Piezometric wells, with 5 inputs and 1 output using ANFIS, ANN, and PLSR between 2002 and 2016 in Sharif Abad watershed, Qom Province. Figure 5 shows the annual precipitation of 143mm at the Sharif Abad watershed and, usually, the level of groundwater and precipitation are different. Also, it shows the contradiction between precipitation and the level of groundwater. We applied ANN on 4 networks using trial and error and predetermined parameters and compared the results to find the optimum network. Table 2 shows the 4 networks of Piezometric wells during training and testing stages. Khaki et al (2016) mentioned that the Sigmoid Transfer Functions model works better than others, but we also used the TanhAxon method with 500 Epoch.
As Table 2 shows, the MLP method with Sigmoid Axon transfer model, which trained with Levenberg-Marquardt algorithm, was the best model based on R2 and MSE criteria.
To predict the level of groundwater with ANFIS method, two Fuzzy model networks, Takagi-Sugeno-Kang Type Fuzzy and T Tsukamoto, with similar algorithms of ANN are compared to find the best network. Table 3 shows the evaluation of networks for selected points in training and testing stages.
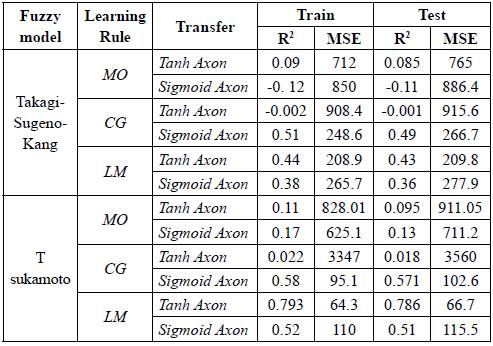
As table 3 shows, Tsukamoto method with Levenberg-Marquardt training algorithm was the best method. To predict the level of groundwater with the PLSR method, we evaluated 5 components, with the fifth one having the highest functionality (Table 4).
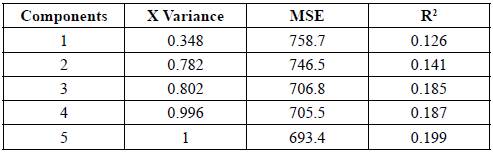
Table 5 shows the comparison of three methods where ANN had the highest functionality of predicting groundwater level in Sharif Abad Watershed. Figure 6 shows Scatter plots of the observed and estimated water levels at training period with selected of three evaluated models. Also, Figure 7 shows that ANN worked relatively better than ANFIS and PLSR. The PLSR model had the smallest AUC. The AUC evaluates a given classification model with no threshold assumption. ROC curves are suitable tools for comparing classifiers where there is no information about misclassification water level.
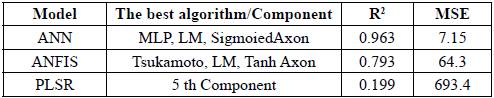
Figure 6 Scatter plots of the observed and estimated water levels at training period. ANN (a), ANFIS (b), PLSR(c)

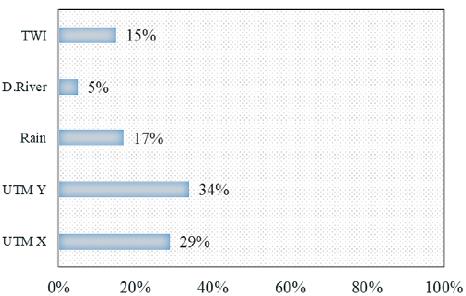
Here, we interpret the most important input parameters of this technique in groundwater level modeling. This diagram shows the importance of latitude and longitude in groundwater level modelling (Fig. 8).
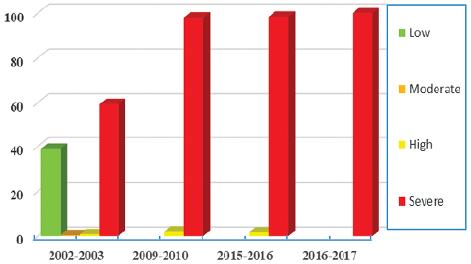
After finding the optimal model, the groundwater level of 24 Piezometric wells in 2025 was determined. Then, the groundwater level was mapped via Ordinary Kriging. Using the groundwater level map in 2025, and Table 1, we determined the degraded regions and depleted groundwater points. Figure 8 and Table 6 both show the land degradation of the study area using groundwater criterion.
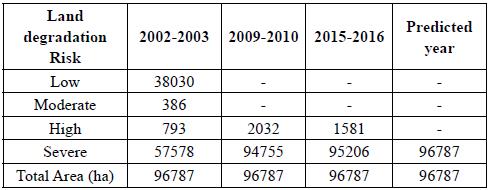
As it can be seen from Table 6 and Figure 9, between 2002 and 2003, around 59.4% of the area is in critical condition of desertification, around 39% and less than 1% has normal and moderate condition respectively. While in the predicted year, land with a potential desertification in the study area has increased by 100% (Table 6 and Fig. 8). After finding the optimal model, the groundwater level of 24 Piezometric wells in 2025 was determined. Then, using Ordinary Kriging, the groundwater level was mapped (Fig. 10).
4. Discussion and conclusion
Land degradation as a global issue deserves more attention. Research findings showed the major land degradation driving factors as altitude, slope, vegetation index, decline of vegetation index, bare land, mid-slope position, and depletion of ground water resources.
Spatial and temporal prediction of groundwater level changes provides useful information for wise management and sustainable development. In this research, the groundwater level was predicted using three models ANN, ANFIS, and PLSR, where the available parameters were used as model input. The coordinates of the wells being studied were used as two input variables. We had a different response variable in comparison to the research made by Jeihoni et al (2015), but our results also showed the usefulness of ANN like the authors stated. Looking at the statistical indices, we found that the ANN has the highest efficiency which agrees with other findings (Khaki et al., 2015; Alizamir et al., 2017; Alqadi et al. 2019; Sebghatiand Gholami, 2019; Meshram et al.2020). We combined the results of ANN with Ordinary Kriging to predict groundwater condition map. We also used latitude and longitude as input variables which improved the model. In addition to the target variable, latitude and longitude play important roles in Ordinary Kriging and decreased the total error of two combined models. The study area currently suffers from intensive farming such as pistachio orchard. Our results could help water resource and agricultural managers make the proper decisions as well as help decrease the chance of desertification and land degradation. Our findings agree with Mohanty et al., (2010), Lohani and Krishnan (2015), Porte et al. (2018), Chitsazan et al. (2013), Nair and Sindhu (2016), Suprayogi et al., (2020) and show the efficiency of ANN in monitoring the level of groundwater. There are only a few differences due to the selection of algorithms.
Our results did not agree with the findings of Gong et al. (2018), Almuhaylan et al. (2020) and Emamgholizadeh et al. (2014). This is because they mentioned that ANFIS has a higher efficiency than ANN. We also believe that the disagreement is due to time series difference in the Neuro fuzzy model structure and various other scenarios rather than the groundwater controlling factors. Unlike in previous studies, we considered the last year precipitation and distance from Qarachay River as recharging sources of groundwater.
Looking at the observed and estimated levels of groundwater, we found that the difference between levels in 2002-2010 is larger than the difference in 2010-2016. In early years, the level of groundwater was underestimated. According to the figures of the level of ground water and monthly precipitation (Figure 5), it's obvious that the difference in maximum and minimum monthly precipitation is significant as 60mm in the whole watershed area and through the time. In 2016, the difference decreased to 20mm and the difference between the observed and estimated levels of groundwater became smaller. According to farming history in the area, we found that by 2010, the study area was under intensive farming and eventually it converted to orchards due to water shortage in Qarachai. Also due to groundwater exploitation, the situation was aggravated and hasn't prevented the desertification. We therefore recommend the following:
The use of ANN in similar studies which monthly precipitation doesn't change drastically. Annual monitoring of groundwater, efficient water usage and selecting the proper farming practices in the study area. Our method is a useful tool for areas without Piezometric wells and saves the time and money for digging.

