


 English (pdf)
 Article in xml format
 Article references
 Send this article by e-mail
 Cited by SciELO
  Cited by Google
  Similars in
SciELO
Similars in
SciELO  Similars in Google
 Permalink
Introduction
The geomagnetic field protects the Earth from cosmic rays (high-energy particles coming from the galaxy) and the solar wind (ionized gas or plasma flowing out of the Sun), just like a barrier (Owens et al., 2013). Without this magnetic field barrier, the solar wind could blow away the atmosphere of the Earth over geological time, and the high-energy particles might damage the health of living beings and the proper functioning of technological systems (Fernberg et al., 2007). The study of geomagnetism is, therefore, directly linked to the survival of humans and other species on the Earth.
The Sun is emitting solar wind all the time. At the Earth's orbit, it has a density of about 5 particles cm-3, and speeds of 400 km/s on average. Both density and velocities are variable, and the speeds can exceed 1500 km/s (Owens et al, 2013).
The interaction of the solar wind with the geomagnetic field leads to the formation of the magnetosphere. Due to this interaction, the magnetic field on the dayside is compressed whereas on the nightside it is stretched in the form of a long tail. Periodically the Sun becomes highly active, causing on its surface eruptions of clouds of electrified magnetic gas, referred to as coronal mass ejections (CME), which are hurled into space from the solar corona, travelling at speeds of up to 1500 km/s, and reaching the Earth's magnetosphere. The solar wind-magnetosphere coupling is enhanced when these CMEs are accompanied by long intervals of southward interplanetary magnetic field. This situation, in general, leads to the occurrence of a geomagnetic storm characterized by a main phase during which the horizontal component of the Earth's magnetic field is significantly depressed over a time span of one to a few hours. This is followed by a recovery phase, which may extend for ~ 10 hours or more (González and Tsurutani, 1987; González et al., 1989; Tsurutani and González, 1997; Tsurutani et al, 1999).
The intensity of a geomagnetic storm is measured in terms of the disturbance storm time index (Dst). Magnetic storms with a Dst < -200 nT are considered intense and those with a Dst < -350 nT are super intense (Tsurutani et al., 1999). During a magnetic storm, a large amount of energy is dissipated in the polar regions, resulting in profound changes in the global morphology of the upper atmosphere (Prölss, 2011). The storm is generally accompanied by great auroral brightness; it occasionally moves equator-ward from its usual location (known as expansion of the auroral oval).
The intensity of the equatorial magnetic field, measured by the Dst index, is directly related to the total kinetic energy of the ring current particles (Rostoker et al., 1997), thus, the Dst index is also often used to determine whether or not a storm happened, to define the duration of a storm, and to distinguish between quiet and disturbed geomagnetic conditions. However, Dst does not identify all storms because, Dst is incomplete in describing storm evolution. The AE or the am indices may be much more appropriate for estimating storm intensity and for statistical studies (Borovsky and Shprits, 2017).
On the other hand, the Auroral Electrojet (AE) index is designed to provide a quantitative measure of auroral zone magnetic activity produced by ionospheric currents flowing below and within the auroral oval. Defined and developed by Davis and Sugiura (1966) and improved by Ahn and collaborators (2000), the AE index has been usefully employed both qualitatively and quantitatively in studies of the morphology of geomagnetic storms (Newell and Gjerloev, 2011), and their influence on the coupling between the interplanetary magnetic field and the Earth's magnetosphere (Akasofu, 1981 a, b; Akasofu, 1989).
The impact of the space weather on the Earth's infrastructures is caused by the combined effects of large variations in the geomagnetic field, the ground conductivity structure and the topology of the affected network (Yu et al., 2019). These impacts range from slow, cumulative and excessive corrosion of pipeline systems (Ingham and Rodgers, 2018) to a rapid collapse (in minutes) of electricity grids (Trichtchenko and Boteler, 2001).
Buried pipelines are coated with low-conductivity materials and are kept with a slightly negative potential difference with respect to the ground of 0.850 V (cathodic protection system) in order to reduce the flow of currents along them and to mitigate corrosion effects. However, corrosion may increase due to the electric currents spread through the soil during magnetic disturbances (Trichtchenko and Boteler, 2001). During periods of intense magnetic storms, telluric currents caused by these geomagnetic disturbances in geomagnetic storm periods may be large enough to keep a pipeline unprotected for a significantly long time, which may reduce its useful life increasing the possibility of corrosion. The influence of geomagnetic activity on PSP has been studied in many cases, e.g. Campbell (1979, 1980), Boteler (2000), Pulkkinen et al. (2001), and Hejda and BochnYcek (2005), Osella and Favetto (2000), in particular where a pipeline crosses a highly resistive intrusive rock.
It is a common practice to check pipes once a year to measure the voltage at test posts so as to track that pipe-to-soil potential (PSP) variations are within the safety range (from -0.850 to -1.350 volts) provided by cathodic protection systems (Yu et al., 2019).
PSP readings, however, are usually irregular and fall outside the recommended range. Their interpretation is difficult because several factors may influence the variation of PSPs measured locally at a given time:
Geomagnetic activity (magnitude and frequency of magnetic variations);
Profile of the soil conductivity below the pipe; and
Piping structure (presence of curves, rims and finishings, division or combination of one or two pipes, etc.) and geographic orientation.
In the framework of a series of control observations made by the Gas Pipeline Integrity Management of the Transportadora de Gas del Sur (TGS) company, between 2013 and 2018 PSP values outside the safety range were recorded, in a series of checkpoints along the NEUBA II gas pipeline, concentrated in a particular area of the province of Buenos Aires. In this work, based on the data provided by the company, the possible causes of these anomalous values in the potential readings at the checkpoints were analyzed, focusing the study on the aforementioned factors. In particular, periods of geomagnetic activity were analyzed, when these periods coincided with the dates of captured data. The influence of the pipeline section topology was also studied from the application of the distributed source theory model, DSTL (Boteler, 2000; 2013) and the soil conductivity profile.
Area of study
This paper analyzed the records of variations in the pipe-soil potential (from a Cu / CuS04 reference electrode placed at the control posts) of the Neuba II gas pipeline, in the district of Saavedra in the area of Goyena, province of Buenos Aires (Argentine), on a 200 km-long section, between 2013 and 2018 (Figure 1). The section of the pipe analyzed is located in the southwest of the province of Buenos Aires, going through the districts of Puan and Saavedra. It runs west of the Sierras de Ventania system, more specifically west of the stratigraphic group La Lola, which is the most extended group in the Curamalal series (Harrington, 1947). This examined section of the gas pipeline goes through Quaternary unconsolidated loessoid sand-clay silt sediments with levels of relatively thick and discontinuous hardpan of an epigenic origin, where the buried section from kilometer 699 to 730 runs largely through silts and calcareous clayey silts and sandy limolites, gravels and subordinate sands. In particular, the soils near the town of Goyena are identified as loessic plain soils, quartzites, quartzitic sandstones and scattered outcrops of granites and porphyries that are characterized by their low to zero conductivity (Pereyra et al., 2001).
Methodology
This paper uses periodic PSP records provided by the company that maintains and controls the proper functioning of the cathodic protection of the Neuba II gas pipeline.
PSP measurements were carried out by TGS, recording data at each of the test points, sequentially along the pipeline. We have the specific information of PSP (ON-OFF), time and date of registration of each test point along the gas pipeline, between the years 2013 to 2018. Surveys on the gas pipeline were carried out annually, in 2013 (8/26 to 9/2), in 2014 (8 /8 to 16), in 2015 (9/14 to 17), in 2016 (11/30 to 12/3), in 2017 (11/28 to 30) and 2018 (9/11 to 14) (Figure 1). In those days when bad weather did not allow measurements to be made, they were done the next day. The data were recorded in different campaigns, which explains the difference in their amplitude but the same trends, since they were certainly taken by different measuring equipment from one campaign to another. In all cases the measurement precision was 1 mV.
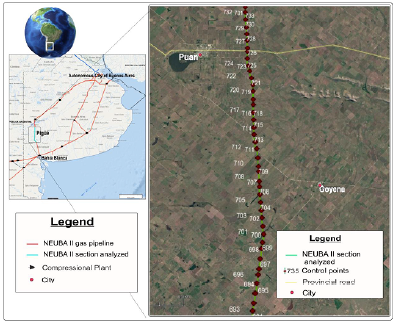
Figure 1 Map of the province of Buenos Aires showing the location of the Neuba II gas pipeline (green line) (source: https://www.enargas.gob.ar) and a detail showing a satelital image of Saavedra district in the area of Goyena and control posts (red dots) (source: Pipeline Integrity/Management, TGS).
Usually, the pipelines are protected by arrays of batteries with the negative terminal connected to the pipeline and the positive terminal to a supplementary anode (cathodic protection) with the purpose of diminishing the amount of current that circulates on the pipe. During the routine control surveys by personnel, the records were collected with the protection system both disconnected and connected (OFF/ON), (Osella and Favetto, 2000).
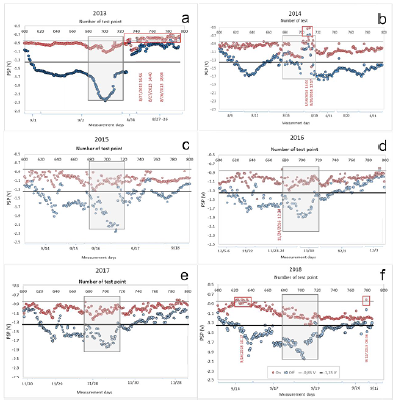
Figure 2 ON (red dots) and OFF (blue dots) potentials measured along the gas pipeline during the 2013 - 2018 period. Dates of disturbed days (in 2013 (8/27 to 9/2), in 2014 (8/18 to 8/22), in 2016 (11/22 to 11/27) and 2018 (9/11 to 9/14) and -0.85 V and -1.35 V protection limit (grey and black horizontal lines). They are spot measurements taken over several days. The grey boxes highlight the section between 680-720 and also highlight out of safe zone points.
On figure 2, it is possible to see that, along the 200 km of the gas pipeline analyzed, there are off-range records in the various measurements repeated from 2013 to 2018, accounting for anomalies relative to the geological contrast of the soil or changes in the pipeline structure. Earth conductivity contrasts can create amplitude variations of surface geoelectric fields resulting in important PSP variations (Osella and Favetto, 2000), principally where a pipe crosses a highly resistive intrusive rock. This is mainly observed in the measurements of the PSP OFF that become more negative in the range between 680-720 km, a result observed in all the records in figure 2.
In parallel, the periods of geomagnetic storms occurring during that length of time were analyzed based on the records of the Dst and AE indices (Campbell, 1979); since the study area is in mid-latitudes, a comparison was made with both indices to get an idea of the global geomagnetic activity. In addition, data was collected from two geomagnetic observatories located in the vicinity of the study area. These observatories of the Intermagnet network are Trelew and Pilar, not more than 300 km from the study area. As the data recorded in these observatories are not continuous, it was alternated between one and the other to observe variations in the components of the magnetic field parallel (By) and perpendicular (Bx) to the pipeline on the days chosen as disturbed and that there was a PSP record. The geomagnetic indices data used in this paper were provided by the WDC, Kyoto (http://wdc.kugi.kyoto-u.ac.jp/wdc/Sec3.html).
To identify periods of intense geomagnetic storms, figure 3 shows the values of geomagnetic indices Dst and AE for the years from 2013 to 2018. We examined geomagnetic activity during the time the measurements were recorded, and selected disturbed periods, as highlighted in Figure 3 and listed in Table 1. The storm times were identified according to Loewe & Prolss (1997) a weak storm has -30 nT > Dst > -50 nT, a moderate storm has -50 nT > Dst > -100 nT, a strong storm has -100 nT > Dst > -200 nT, a severe storm has -200 nT > Dst > -350 nT, and a great storm has Dst < -350 nT, and confirmed with AE index up to 500 nT. The storm periods are defined when Dst index significantly depressed and then it is followed by a recovery phase to return to initial level (see Figure 3, gray shaded rectangle). Figure 2 shows PSP voltages On that go outside the safe range in periods coinciding with geomagnetic storms (disturbed days). Table 1 remarks the test point measured during the storm periods to see both when data do and don't go over the safety range to discuss the relationship between PSP and geomagnetic storms.
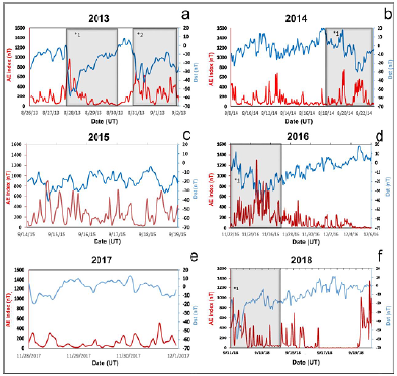
Figure 3 Time data of the AE (in red line) and Dst (in blue line) indices for the 2013-2018 period coinciding with the days of PSP observation. Geomagnetic storms periods where identified by asterisks and gray shaded rectangle.
Table 1 Selected periods by their geomagnetic activity. Storm type according to Loewe & Prolss (1997) a weak storm has -30 nT > Dst > -50 nT, a moderate storm has -50 nT > Dst > -100 nT, a strong storm has -100 nT > Dst > -200 nT, a severe storm has -200 nT > Dst > -350 nT, and a great storm has Dst < -350 nT.
| Date | 27 to 30-ago-13 | 31-aug to 2-sep-13 | 20 to 22-aug-14 | 22 to 27-nov-16 | 11 to 14-sep-18 |
|---|---|---|---|---|---|
| DST INDEX (nT) | -60 | -40 | -30 | -30 | -60 |
| Storm type | Moderate (*1) | Weak (*2) | Weak (*1) | Weak (*1) | Moderate (*1) |
| AE INDEX (nT) | 1000 | 700 | 800 | 1300 | 1000 |
| Number of psp test points meassured | 740-800 | 600-730 | 710-800 | 620-690 | 780-800, 600-640 |
To observe the local incidence of storm periods, the geomagnetic field values were recorded in geomagnetic observatories belonging to the Intermagnet network near the study area. These observatories are Trelew (colatitude 133.3 °, longitude 294.7 °) and Pilar (colatitude 121.4 °, longitude 296.12 °) both within 300km of the pipeline route. We used the horizontal components of the field (BX and BY) and their time derivative (dBX/dt and dBy/dt), at a 1 minute sampling rate. As the induced PSP voltage depends not only on the magnitude of the geomagnetic field but also on its direction with respect to the pipeline, we computed both directions to observe the important correspondance with the PSP voltage (Trichtchenko and Boteler, 2001). Figure 4 shows PSP voltages On that go outside the safe range in periods coinciding with geomagnetic storms for example, it is noted that the peak in dB/dt in fig 4a coincides with the PSPs going out of range. But there are other times when the PSPs go out of range when the dB/dt is quiet, for example on 08/27/13, and 08/21 in 4b. In 2016 and 2018 the dB/dt is very small and gappy so its really hard to actually see any activity.
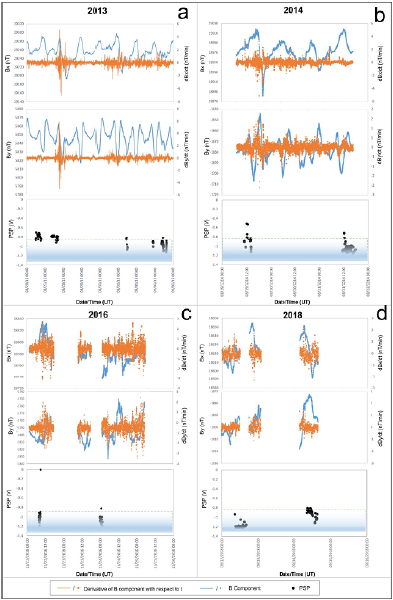
Figure 4 North, BX, and east, BY, components of the geomagnetic field (blue lines) registered using data from the Observatories Trelew (2013) and Pilar (2014, 2016, 2018) and corresponding time derivatives, dBx/dt and dBy/dt, of the geomagnetic field (orange lines). The sampling rate is 1 min. Scatter graphs of the PSP voltage (V) computed for the whole periods selected.
Finally,the pipeline was modeled using the DSTL theory representing the pipeline as an electrical transmission line, modeled by proposing multiple segments with various lengths and orientations to represent the pipeline path along its route (Boteler, 2000; 2013). The electric field is represented by voltage sources distributed along the transmission line (Northward), see Figure 5. The pipeline electric properties are series impedance per unit of length, given by the resistivity of the pipeline steel and the pipeline cross section, and parallel admittance per unit of length, given by the conductance through its coating. These parameters determine the propagation constant.
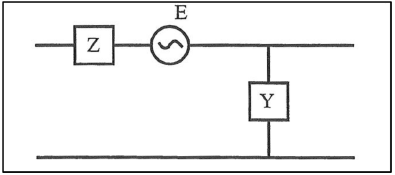
Figure 5 Distributed source transmission line model of a pipe section, schematic representation. (modified Boteler, 2000)
Along most of the route, there are two parallel buried pipelines. For individual pipelines with impedance Z and parallel admittance Y, the impedance of both parallel pipelines is Z/2 and their effective parallel admittance is 2Y, according to Boteler (2000). This results in a decreased characteristic impedance; however, the propagation constant remains unchanged. The following were considered as dielectric constants: the magnetic permittivity of the surrounding medium and the coating coinciding with those of a vacuum and that of steel 1000 times that of a vacuum and the same permittivity in all the mediums coinciding with that of a vacuum (Favetto and Osella,1999).
Results
In figure 2 we can see that in the different years where the PSP was registered in the area comprised by km 680-720, the PSP oFF values fall outside the safety range, becoming more negative than -1.35 V. This is corrected with cathodic protection system ON. Since this effect is repeated in all the series of measurements carried out, it can be assumed that it would be linked to the geological characteristics of the site.
In addition, PSP On voltages that go out of safe range at non-fixed checkpoints based on the time they are measured. Therefore, the anomalous potentials were compared with the values of the DST and AE indices to see if they coincided with periods of geomagnetic storms.
Contrasting figures 2a and 3a, the large potential variations may be associated with the geomagnetic storm period from 8/27/2013 to 8/30/2013. On this period, there were moderate geomagnetic storms. There is an interesting correspondance at 8/27 (Fig. 2a) that is still replicated in the On potential going outside the safety range. There's some correspondance between the magnetic activity and the PSP On voltages, particularly when the Dst index does become strongly negative ( Fig.3a 1*).
When comparing figures 2b and 3b, a coincidence can be found again with the storms recorded from 8/19/2014 (Fig. 3b, *1) at km 710. The period evaluated in 2014 only includes one moderate storm (8/19), during which some of the PSP ON measurements went out of range.
The comparisons between figures 2c and 3c and figures 2e and 3e show that those observations of potentials were made in calm periods, with very weak storms. We can see some correspondence between disturbed days and abnormal record on 11/22/16. Finally, the effect is seen on figures 2f and 3f for the 2018 period, when, again, a moderate geomagnetic storm occurred in the observation period increasing the potential levels around the area of kilometers 620640 and 780, although not exceeding a lot the protection levels.
Figure 4 represents the north and east components of the magnetic field and their temporal derivatives recorded in the vicinity of the study area. It can be seen in figure 4a that the record of maximum variation of the dBy / dt component coincides with the period in which the PSP records go outside the security range at checkpoints 740 to 790. The same is observed for the dBx / dt component in Figure 4b at positions 710 to 720. This is repeated in figure 4c (km 790) and figure 4 d (km 620-640). But there are other times when the PSPs go out of range when the dB/dt is quiet, for example on 08/27/13, and 08/21 in 4b. In 2016 and 2018 the dB/dt is very small and gappy so its really hard to actually see any activity.
Focusing on the soil study at control points 680 and 720, as can be seen on the maps of figure 6, point 700 is located in alluvial plain and terrace soils, formed by unconsolidated sediments of clayey silts, silty clays and sands, and sandy gravels, with moderate water erosion and high risk of flooding; while control post 730 is located in loessic plain soils with hardpan, formed by sediments similar to those of post 700, with moderate water erosion but a low to null risk of flooding (Pereyra et al., 2001). Regarding the electrical conductivity of the study area, it has been observed, during the campaigns of the Argentine Mining Geological Service (SEGEMAR), that it increases in the direction of the flow network from the mountain recharge area to the discharge areas (Pereyra et al., 2001). However at checkpoint 712, where there are the changes in the PSP voltages, the continuity is uniform.
The relative size of the PSP variations was compared to determine whether there was lateral PSP variability along the oil pipeline route and whether this is correlated with a characteristic of the pipeline. To this end, the records of 2013 were taken as a case study because it is the year where the greatest amplitudes in potential differences were recorded. We know that the year also coincides with the most geomagnetically disturbed year when measurements were made; however, the measurements made during the storm are outside of the main section of pipeline that shows the negative values of interest here. Figure 7 shows the PSP relative amplitude coefficients as a function of the distance along the pipeline, observing that it changes in the section around control post 712, going from a dual to a single buried pipeline, and subsequently becoming a dual one again (Figure 8). They allow us to know how sensitive the PSP variable is to change with respect to position variable (the rate of change of PSP(mV) per kilometer.
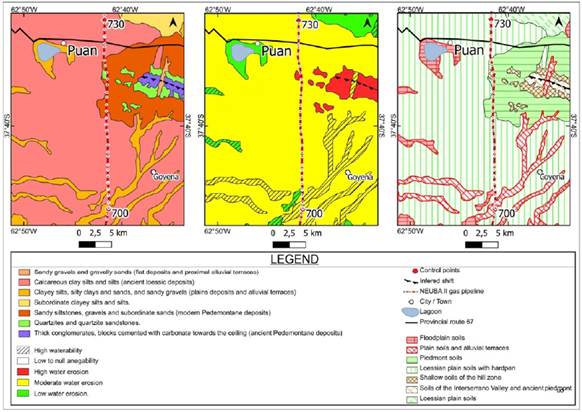
Figure 6 Lithological (left), floodability (centre), and edaphological (right) maps. Control points from 700 to 730 (red dots).
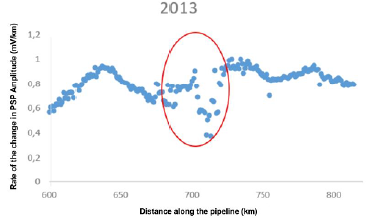
Figure 7 Relative size of the PSP variations recorded for 2013 along the pipeline route. Detail of control points from 700 to 730 (red oval).
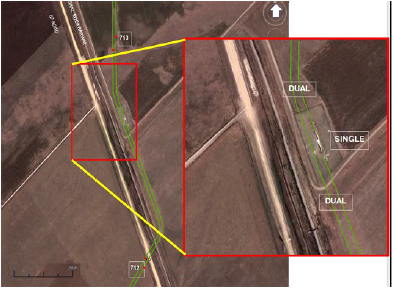
Figure 8 Detail image of the gas pipeline (green lines) that crosses provincial route 67 and Gral. Roca railway. It's on the right a zoom of the characteristics of the pipeline structure along its route. (Image source: Google Earth); checkpoints on the gas pipeline (red dots); control point numbering (white rectangle).
For this study, a DSTL model was defined, considering a northward electric field of 10 mV/km. By the pipeline route there are two pipes in parallel. But, the pipeline is reduced to a single buried pipe for sections immediately before a compressor station. Designs were made for a steel pipeline with a 762 mm outer diameter, and a 50 km propagation constant, for the 200 km of the pipeline between General Cerri (compression plant at km 592) and Saturno (compression plant at km 794). Figure 9 shows the PSP amplitude variations along the pipeline route, accounting for an anomalous area of great amplitude at the testing post extending from km 670 to km 720 of the distance along the pipeline. The maximum amplitude relationships have been recorded at the testing post located at km 700 of the pipeline route, and they decrease in both directions from this location, where the pipeline structure changes from dual to single. A change from 2 to 1 pipes also represents a change in the pipeline characteristics seen by telluric currents.
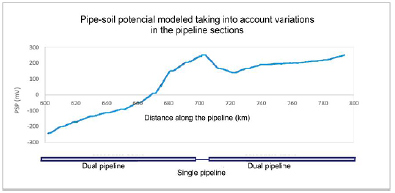
Figure 9 Pipe-soil potential modeled considering variations in the pipeline sections. Above the model is shown as double-single-double (single pipe between km 712 and km 713) (see Figure 8).
Conclusions
We analyse a series of annual measurements from control points along a pipeline in Argentina over 6 years to analyse the local influence from geomagnetically induced currents from space weather activity and local influence from geology or soils.
We were able to observe that anomalies increase in periods of greater geomagnetic activity, as most notably seen in the 2013 observations coinciding with the period of maximum solar activity (activity peak of solar cycle 24). The PSP values showed fluctuations in various parts of the pipeline, from 0.1 V to 0.15 V, compared with the records of the same location in calm periods.
The results obtained can be compared with those shown by Yu et al. (2019) and Ingham et al. (2018) who also accounted for the effects of geomagnetic storms in pipelines buried in mid-latitudes. In Ingham's study focused more on observing variations in cathodic protection potential on a natural gas pipeline in New Zealand where that variations occur in the electric field across the pipeline affecting it more than those parallel to the pipeline obtaining variations between -0.5 mV and about +0.8 mV, they concluded that observed variations in the CP potential arise because of changes in the local potential of the ground. What's more, Yu et al. (2019) observed that during the geomagnetic storm, the PSP positive offset of the pipelines can exceed the limit of the technical standard for currents interference mitigation of buried pipeline, even when the effects of geomagnetic storms are less in low and mid latitudes, they observed the PSP values of the pipeline in Changyi Station.
The anomalies recorded in the pipeline section from km 699 to 730 observed repeatedly from 2013 to 2018 could be related to the peri-hill gravel, sand and silt deposits, with piedmont levels, as the remaining route runs through relatively thick and discontinuous loessial sand-clayey silts with hardpan levels of an epigenic origin (SEGEMAR, geological and mining map of the province of Buenos Aires), accounting for a geological boundary in the area of the anomalies observed.
The great PSP variations observed along the pipeline in the area under study could be related to the local geology traversed by the gas pipeline and to discontinuities of the pipeline structure along its route. The PSP modelled using the DSTL method showed a good consistency between the observed and modeled PSPs mainly in the increases of potential due to changes in the topology of the pipeline.
It would be interesting to perform some surface impedance calculations based on magnetotelluric data in the area to corroborate this assumption and to determine the magnitude of this contribution.
On the other hand, the present results did not enable any deeper insight into the problem. This is why we hope to obtain more data from a greater number of measuring stations and apply quantitative models of geomagnetically induced currents and voltages in the pipeline networks.

