


 English (pdf)
 Article in xml format
 Article references
 Send this article by e-mail
 Cited by SciELO
  Cited by Google
  Similars in
SciELO
Similars in
SciELO  Similars in Google
 Permalink
Introduction
With the help of global navigation satellite system (GNSS) stations that continuously collect data, it is possible to examine changes using positional information as a function of time. These data are generally used to observe the slip movements of the Earth's crust and to estimate the slip velocity of the ground (Langbein & Johnson, 1997; Williams et al., 2004; Uzel et al., 2013; Tiryakioglu et al., 2017; Gezgin et al., 2020; Yalvaç, 2020). It is assumed that GNSS signals fit a model consisting of components, such as linear slip, semi-annual and annual oscillations, post-earthquake logarithmic oscillation, a starting point, and a noise component. The correct estimation of the model parameters depends on the appropriate modeling of the data (Baykut, 2012; Gülal et al., 2015; Oktar & Erdogan, 2018; Õzkaymak et al., 2019; Tiryakioglu et al., 2019).
There are also other parameters that affect the position accuracy of GNSS stations. Some of these parameters, such as device selection, measurement method, measurement time, software selection, and process of measurements can be eliminated in stages. The selection of station locations is another important factor affecting position accuracy. Since certain areas where GNSS stations are used require very high accuracy, stations should be located in areas that are tectonically stable, they should be built on solid rock or hard ground, and the ground point should be monument (Calais, 1999).
Due to withdrawal of groundwater, the compression in aquifer systems can create a vertical deformation on the ground of these systems (Üstün et al., 2015; Calo et al., 2017; Õzkaymak et al., 2017; Orhan et al., 2020; Tiryakioglu & Bozkuç, 2020). Some partial land subsidence events in the Earth's crust are being monitored and some are studied with geodetic methods. Üstün et al. (2007) observed the GNSS stations in the Konya Closed Basin (KCB) located in the Central Anatolia region in Turkey to determine groundwater withdrawal rates and identified changes in the height component between -8 and 18 mm in five months. Üstün et al. (2010) carried out a study in the KBC and detected the vertical displacements between -12 and -52 mm/year based on the GNSS observations processed between 2006 and 2009. Üstün et al. (2015) performed a deformation analysis in the same basin using the GNSS stations between 20062012 and InSAR observations from 2002 to 2009 and obtain land subsidence resulting in the rate of 1^4 cm/year in KCB. Another land subsidence study was conducted in Konya city center and its vicinity by Orhan (2021). It was revealed that there were land subsidence rates reaching -75 mm/yr in the period between 2014 and 2018 using the Sentinel-1A SAR data.
In this study, the daily position information (north, east and up) of 16 Continuously Operating Reference Stations-Turkey (CORS-TR) stations in and around the Konya Closed Basin were used. For 15 stations, the data covered between 2008 and 2014 and for KNY1 station 560-day data (2014-2015) were used. The time series of all stations were created to demonstrate the behavior of the stations under various effects at global, regional, environmental and seasonal level, different environmental and climatic conditions, such as crustal movement, movement of groundwater resources, precipitation, and sunspot change, and other factors related to reference system errors (e.g., linear and periodic movements, signal exchange and drifts).
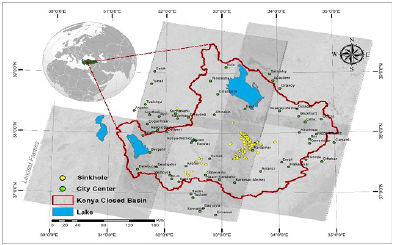
In the last decade, it has been seen that there is a decrease in groundwater due to the drought resulting from global climate change and excessive water use (Orhan et al., 2014, Calo et al., 2018). In Turkey, KCB has been affected by land subsidence and sinkhole formation (Figure 1). This site is an important agricultural basin of the country. Over the years, agricultural activity in the basin was conducted by non-irrigated farming. However, since the 2000s, irrigated farming areas have increasingly become dependent on groundwater usage in KCB (Orhan et al., 2021). The increased usage of groundwater in the basin, increased land subsidence and sinkhole formations in the region over the past decade (Ahmed et al., 2020; Orhan, 2021). This negative variation is considered to affect the movement of GNSS stations in the vertical direction. Therefore, in this study, the changes in groundwater levels were also examined.
Study Area
The Konya Closed Basin is located in the central and southern part of the Central Anatolia Region in Turkey. The field is surrounded by Bozdag and Obruk Plateau in the north and northwest; the inner slopes of Toros mountains arc from Sultan Mountains to the south of the Karaman Province in the south; Eregli Plain in the east; and Takkeli Mountain, Gevele Mountain, and Loras Mountain in the west. The boundaries of the Konya Closed Basin include Konya, Nigde, Isparta, Aksaray, Ankara, Karaman and Nevçehir (Fig. 1).
Konya Closed Basin covers 800 km2 of Hotaş Plain (including marsh), 700 km2 of Karapinar Plain, 500 km of Karaman Plain, and 2500 kirf of Eregli Plain (including Ayranci Plain) (inan et al. 2006). The formation of sinkholes has increased in recent years in and around the Konya Closed Basin. This is presumed to be due to the decrease in groundwater levels, which has been reported in Akgõl (Eregli), Acigõl (Karapinar) and Timraç lakes, and Meke salt pan (Karapinar) (Gõçmez et al., 2004).
Climate: According to the data analysis of the meteorological stations selected from the Konya Closed Basin the average annual temperature varied between 11 °C and 11.8 °C, and the average annual precipitation ranged from 281.4 mm to 329.2 mm. The difference in the precipitation values is related to the geographical formations and the effects of air masses. At 310.3 mm, the average annual precipitation in the Konya Closed Basin is the lowest in Turkey.
Methodology
Time Series Analysis
The behaviors of continuously operating GNSS stations under different effects described above can be explained by the analysis of time series.
Excluding artificial or co-seismic and post-seismic slip, the time series Y(t) obtained from the GNSS measurements at t. (i=1, 2, 3, N) can be generally divided into the following three components (Gülal et al., 2013):

In the analysis of time series, firstly, the time-axis graph of the series is drawn and the unusual measurements (e.g., gross errors) are excluded to obtain a general interpretation of the series. A suitable low-pass filtering operation (e.g., five-order floating weighted average) is applied to the series to eliminate the noise effect in the series and reveal trend and periodic components more clearly (Erdogan et al., 2007; Gülal et al., 2013). Then, it is determined whether the series has a trend component, which represents long-term changes that can modeled by the polynomial function in the time domain as:

where C k (k=1,2,...,m) are the parameters depending on the order of the polynomial function. Linear changes (velocities) in the increasing or decreasing direction of GNSS stations are defined by taking m=2. However, the magnitude of linear variation in GNSS stations is significantly affected by periodic movements. The effects of atmospheric, tidal and earth rotation parameters are modeled in the processing step of GNSS observations using academic software. However, behaviors resulting from periodic effects that are not modeled at GNSS stations can also be determined by time series analysis. For this reason, the periodic component must be absolutely determined in the time series analysis of GNSS stations.
The periodic component in the series can be modeled by a trigonometric function with Equation 3 based on f s (s=1,2,...,p) frequencies and P(t i ) measurements.

where unknown parameters c k ,, as, b s and standard deviations of these parameters m ck , m as and m bs are estimated by the least square method (LSM). The test size determined for each parameter is compared to ±t f,1-a/2 confidence limits of t-distribution for 1-a confidence limit and f degrees of freedom. The parameters that are found insignificant in the test are removed from the function, and the process is continued until only significant parameters are left. In Equation 3, the frequencies of movements must be known to calculate the periodic movement. For this purpose, firstly, it is necessary to determine the trend component(s) of the series using Equation 2 and remove them if they are significant. Otherwise, these components affect the results of spectral analysis on the series and produce a peak at zero frequency.
After the elimination of the trend components from the series, transformation from the time domain to the frequency domain of the series is performed using the Fast Fourier Transform (FFT), which is defined by Equation 4.
wherefis the frequency, and e 2пjt is the complex and exponential function. Since the values obtained using FFT are complex numbers, they are still not sufficient to determine the frequency of the series. Therefore, the module square of X(f) is calculated and called the Fourier spectrum P xx (f).

Thus, the frequencies of the periodic movements in the series are determined by detecting at which frequencies there is more energy from the signal. The parameters of frequencies were tested by substituting these frequencies in Equation 3.
Research findings and discussion
This study investigated the linear movements (velocities) and periodic movements of continuously operating GNSS stations in the Konya Closed Basin and the changes in groundwater level. The stochastic components of time series analysis were not analyzed in this study.
GNSS Stations
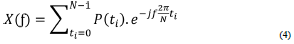
The daily position data (north, east and up) of 16 GNSS (CORS-TR) stations in and around the Konya Closed Basin were used. The data from 15 stations belonged to 2008 to 2014 and that of KNY1 station was obtained from 2014 to 2015 (560 days in total). Due to the slip seen in the KNYA station time series, which was previously installed in the region, KNY1 station was later established instead of this station in 2014. Therefore, KNY1 station has 560-day data. The time series of the 16 stations were created (Fig. 2). The data obtained from the General Command of Mapping and the ITRF08-fixed frame were used in the data analysis process. The time series in the north and east directions of the KAMN, KAPN, KNYA and KNY1 stations from 48 (16.3 = 48) time series obtained for 16 stations are given in Figures 3 and 4. Moreover, Figure 3 shows the linear movements and equations of the series.
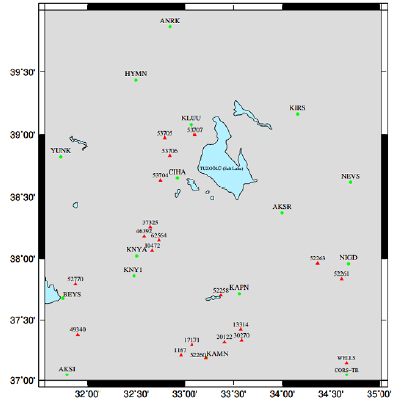
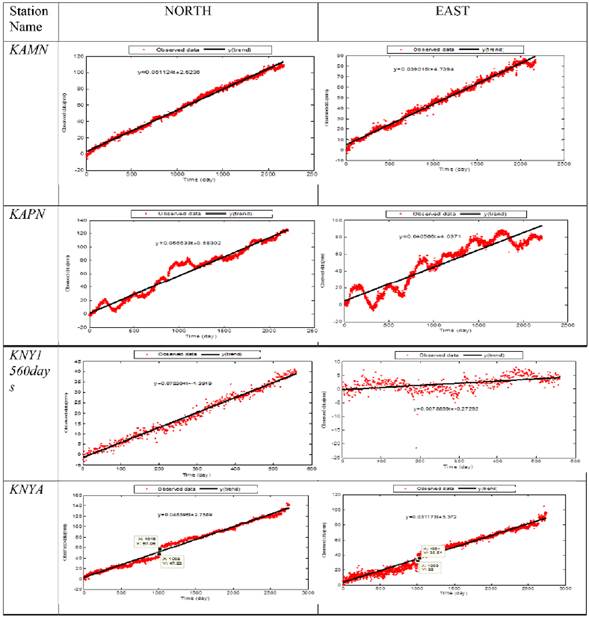
Figure 3 Coordinate time series, linear movements, and linear functions of KAMN, KAPN, KNYA, and KNY1 stations in the north and east directions.
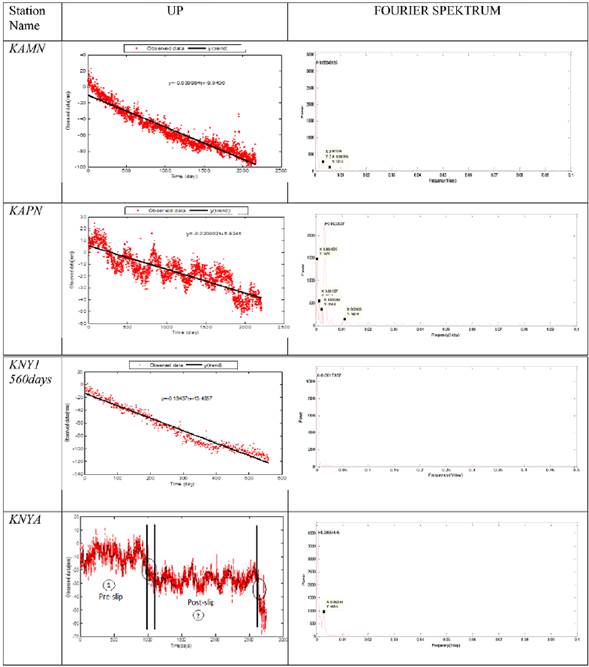
Figure 4 Coordinate time series, linear movements, and frequency spectrums of stations in the up direction.
Figure 4 also shows the up time series, linear changes, function of linear change, and frequency spectrum of the same stations. Due to the high number of stations, the time series graphs of other stations are not given in this paper. However, linear functions and station velocities (annual) are given in Tables 1 and 2. The time series plots in Figures 3 and 4 were obtained by subtracting the first coordinate value of the time series of each station from the other coordinate values. In this case, the signal change at any time point in the time series is at the start time of the signal. It can be seen that the time series in the north and east directions of the stations show a linear increase in the same directions (Fig. 3). The same results were obtained in the time series of the other stations, but these are not presented in a figure. In addition, pulse movement was seen at marked points in the north and east time series and the last part of the series in KNYA. This was even more prominent for the up coordinate values (Fig. 4). For this reason, before and after the first pulse were taken into account separately in the calculation of the velocities at the KNYA station for north, east and up coordinate time series. Due to the insufficient amount of data after the second pulse, the remaining days were not taken into account. This situation is shown in the Figure 4. The linear movements (velocities) and periodic movements of the stations given in Figures 3 and 4, as well as those that are not presented in this paper were determined by performing time series analysis.
Trend component analysis
It was determined whether the time series in the north, east and up directions of GNSS stations indicated any linear movement using the proposed function in Equation 2. The c 1 and c 2 parameters of the linear function generated by taking m=2 and standard deviations of these parameters were estimated by LSM. The significance of the deviations of the calculated parameters from the "0" value was determined based on a=0.05 error possibility according to t-distribution (for f>2000, =2 and for f>500, ). As a result of the trend component analysis of GNSS stations, the time series of the north and east coordinates of all stations showed a statistically significant linear movement in the positive (increasing) direction. The linear movements and linear functions are given in Figure 3. Table 1 shows statistically significant linear movements (linear models) and annual linear changes (velocities) for all stations. The "c2" parameter in the trend function indicates the daily (+) increasing or (-) decreasing direction of the linear change. Using this parameter, it is possible to identify linear changes or movements of the stations any time.
Table 1 Linear functions and annual velocities of GNSS stations (north and east).
| Station | North Linear Functions (Y=c2t+c1) | Linear Changes (mm/year) | East Linear Functions (Y=c2t+c1) | Linear Changes (mm/year) | Resultant Changes (mm/ yil)/ Directions |
|---|---|---|---|---|---|
| AKHR\ | Y(trend)=0.0245t+1.7226 | 8.94 | Y(trend)=0.0113t+1.6671 | 4.12 | 9.84/northeast |
| AKSI | Y(trend)=0.0302t+14.0774 | 11.02 | Y(trend)=0.0406t+0.0612 | 14.82 | 18.47/northeast |
| AKSR | Y(trend)=0.0513t-0.7534 | 18.72 | Y(trend)=0.0229t+1.3993 | 8.36 | 20.50/northeast |
| ANRK | Y(trend)=0.0427t+1.2507 | 15.59 | Y(trend)=0.0115t+1.6134 | 4.20 | 16.15/northeast |
| BEYS | Y(trend)=0.0313t+1.5188 | 11.42 | Y(trend)=0.0283t+3.0769 | 10.33 | 15.40/northeast |
| CIHA | Y(trend)=0.0418t-2.7231 | 15.26 | Y(trend)=0.0191t-2.8808 | 6.97 | 16.78/northeast |
| HYMN | Y(trend)=0.0361t+4.5038 | 13.18 | Y(trend)=0.0148t-0.9256 | 5.40 | 14.24/northeast |
| KAMN | Y(trend)=0.0511t+2.5236 | 18.65 | Y(trend)=0.0390t+4.7394 | 14.24 | 23.46/northeast |
| KAPN | Y(trend)=0.0566t+0.6830 | 20.66 | Y(trend)=0.0406t+4.0371 | 14.82 | 25.43/northeast |
| KIRS | Y(trend)=0.0490t+7.9869 | 17.89 | Y(trend)=0.0192t-1.0199 | 7.01 | 19.21/northeast |
| KLUU | Y(trend)=0.0435t+5.2655 | 15.88 | Y(trend)=0.0196t+1.2331 | 7.15 | 17.42/northeast |
| NEVS | Y(trend)=0.0535t+1.2779 | 19.53 | Y(trend)=0.0256t+1.7963 | 9.34 | 21.65/northeast |
| NIGD | Y(trend)=0.0550t-0.6508 | 20.08 | Y(trend)=0.0334t+1.1063 | 12.19 | 23.49/northeast |
| YUNK | Y(trend)=0.0314t+0.6469 | 11.46 | Y(trend)=0.0135t-2.7270 | 4.93 | 12.48/northeast |
| KNY1 | Y(trend)=0.0723t-1.3919 | 26.39 | Y(trend)=0.0079t-0.2729 | 2.88 | 26.55/northeast |
| KNYA | Y(trend)=0.0484t+2.7589 | 17.67 | Y(trend)=0.0312t+3.3720 | 11.39 | 21.02/northeast |
| KNYA* | Y(trend)=0.0365t+5.952 | 13.33 | Y(trend)=0.0200t+6.6192 | 7.30 | 15.20/northeast |
| KNYA** | Y(trend)=0.0409t-1.5028 | 14.92 | Y(trend)=0.0256t-1.0583 | 9.35 | 17.61/northeast |
| * | Before slip | ||||
| ** | After slip | Mean = 18.74mm/year |
As shown in Table 1, GNSS stations in the study area had linear movements in the northeast direction (ITRF08 fixed frame). After the removal of the stations KNYA, KNYA* and KNYA**, annual mean movement or velocities of the stations calculated as 18.74 mm/yr. As it can be seen in Figure 3 and Table 1, the pre-slip (KNYA*) velocity of the KNYA station is 15.20 mm/yr in the northeast direction, and the post-slip (KNYA**) velocity is 17.61 mm/yr in the same direction. The velocity calculated for all data belonging to the KNYA station is also obtained as 21.02 mm/yr in the northeast direction. The results obtained show that the slips change the velocity value and therefore slips should be taken into account before time series analyzes. The stations having an annual velocity greater than 2 cm were; AKSR, KAMN, KAPN, NEVS, NIGD, KNY1. The maximum velocity was 26.55 mm/year, which was obtained from the KNY1 station. The minimum velocity was found in AKHR at 9.84 mm/year.
The linear movements and functions of the up coordinate time series of the GNSS stations (KAMN, KAPN, KNYA and KNY1) are shown in Figure 4. In addition, Table 2 presents the statistically significant linear movements (linear models) and annual linear changes (velocities) of these stations.
Table 2 Linear functions and annual velocities of GNSS stations (up).
| Station | Up Linear Functions (Y=c2t+c1) | Linear Changes (Velocities) (mm/year) |
|---|---|---|
| AKHR | Y(trend)=-0.0143t+14.3868 | -5.22 |
| AKSI | Y(trend)=-0.0063t+22.6557 | -2.30 |
| AKSR | Y(trend)=-0.0102t-1.5357 | -3.72 |
| ANRK | Y(trend)=0.0023t-8.4197 | 0.84 |
| BEYS | Y(trend)=-0.0025t+5.2138 | -0.91 |
| CIHA | Y(trend)=-0.0035t+3.5352 | -1.28 |
| HYMN | Y(trend)=-0.0037t-0.1510 | -1.35 |
| KAMN | Y(trend)=-0.0400t-9.8436 | -14.60 |
| KAPN | Y(trend)=-0.0200t+5.8245 | -7.30 |
| KIRS | Y(trend)=-0.0023t-8.6258 | -0.84 |
| KLUU | Y(trend)=0.0018t-5.7144 | 0.66 |
| NEVS | Y(trend)=-0.0007t+5.2945 | -0.26 |
| NIGD | Y(trend)=0.0005t+10.1856 | 0.18 |
| YUNK | Y(trend)=-0.0026t+2.009 | -0.95 |
| KNY1 | Y(trend)=-0.1944t-13.4857 | -70.96 |
| KNYA | Y(trend)=-0.0106t-6.9657 | -3.87 |
| KNYA* | Y(trend)=0.00026t-9.3247 | 0.095 |
| KNYA** | Y(trend)=0.00084t-0.6248 | 0.31 |
The up-coordinate time series of all stations had statistically significant linear movements in the positive and negative directions. As with the north and east components, up values of the KNYA station were analyzed in two parts as pre-slip (KNYA*) and post-slip (KNYA**) (Fig. 4 and Table 2). Velocities were found to be 0.095 mm/yr for KNYA* and 0.31 mm/yr for KNYA**, respectively, and both velocities were in the positive direction. When the time series of the station is examined as a whole, it is seen that the velocity is negative and greater. Accordingly, the slip must be considered as it affects the direction and magnitude of motion at this station. If it is not considered, it causes miscalculation and misinterpretation of the movement. Including the KNY1 station velocity, the mean value of linear movements in the negative direction for the up coordinates was -9.14 mm/year except for KNYA, KNYA* and KNYA** (Table 2). The annual vertical movement of the KNY1 station with 560-day data was 70.96 mm in the down (-) direction, which was also the highest value of the vertical movements of all stations in the study area. KNY1 is the new GNSS station set up in 2014 since there was a peak (Fig. 3 and Fig. 4) in the KNYA station time series. Regarding the significant increases in both agricultural and residential areas in Konya city and its surroundings, it can be concluded that the rise in the groundwater depletion in the district was inevitable (Orhan, 2021). Therefore, the reason for the maximum land subsidence rate in KNY1 station was the acceleration in the land subsidence rate in recent years related to the increasing extraction of groundwater in the Konya plain (Õzdemir, 2016; Calo et al., 2018).
Excluding the annual velocity of the KNY1 station, the mean value of vertical changes in the negative direction was -3.52 mm/year. The vertical movements of the ANRK, KLUU, and NIGD stations were in the up direction, and their mean annual movement was 0.56 mm (Table 2). Except for KNY1 station, the annual velocities of the stations for the up coordinates were relatively small values. At -1.5 cm/year velocity, KAMN had the second highest velocity among all the stations investigated in the study area (Table 2).
Periodic component analysis
The periodic component analysis, which was the second component of the time series, was performed after removing the trend components from the time series of the GNSS stations. With the help of the function given in Equation 3, significant periodic movements existing in the series were detected. However, in Equation 3, the f frequencies had to be known. In order to determine the frequencies in the equation, FFT was applied to the series without the trend components. Thus, the series were transformed from the time domain to the frequency domain, and all existing frequencies in the time series of the GNSS stations were determined. The frequency spectrums of KAMN, KAPN and KNY1 are given in Figures 4 and 5. These GNSS stations had daily, monthly, seasonal, semi-annual, annual, and even biennial periodic movements. The results for the other stations were similar. Moreover, periodic movements obtained for this region supported those reported for other GNSS stations around the world. Many researchers have previously shown that GNSS stations have annual periodic movements (Herring & Springer, 2002; Mao et al., 1999; Wdowinski et al., 1997). It was considered that this annual periodic effect in the time series was due to atmospheric and hydrological loading. Calais (1999) reported a long-term periodic signal with a large amplitude over approximately 450 days.
It was deduced that the periodic movement not being seasonal and the signal being larger in the east and west components resulted from the faults in the reference system or satellite orbit or ground routing parameters. Furthermore, concerning the signal, snow and ice accumulation on the antenna and antenna protectors, as well as climatic factors had an effect on annual, half-annual, four-monthly and three-monthly periodical movements found by Scherneck et al. (2002) and Scherneck et al. (1998).
Groundwater Level Changes
In this study, 19 wells were measured monthly in order to determine the groundwater level changes in the Konya Closed Basin. For the wells in this area, minimum 11-year and maximum 49-year data were available (from 19 stations) (Fig. 2). The time-dependent changes (monthly) of the two wells used to determine the groundwater level changes are given in Figure 6.
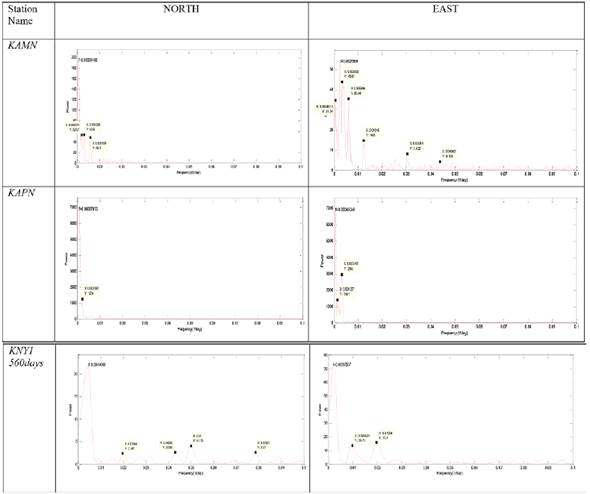
Figure 5 Fourier spectrums of the KAMN, KAPN and KNY1 stations for the north and east coordinate time series.
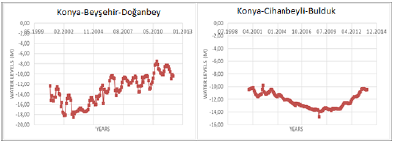
As in the trend analysis of GNSS stations, a trend analysis was performed for 19 wells. The linear functions and annual changes are given in Figure 7 and Table 4. The results showed linear changes in the decreasing direction with a mean of -39.22 cm/year for 19 wells; for example, -15.56 cm/year for three wells in Konya-Cihanbeyli, -63.48 cm/year for four wells in Konya-Selçuklu, -68 cm/year for six wells in Karaman, and -19.50 cm/year for two wells in Nigde. The annual change in the Konya-Selçuklu-Meydan, Karaman-Ayranci-Huyukburun, and Karaman-Merkez-Suduragi wells was over 1 m (Table 4). However, the linear function of the Konya-Kulu and Konya-Seydiçehir wells showed an insignificant linear change at 95% confidence level. In addition, a linear increase (69.72 cm/ year) was detected in the Konya-Beyçehir-Doganbey well. The majority of the water level of the wells in the study area had a statistically significant decrease, and this change was at meter level for some wells.
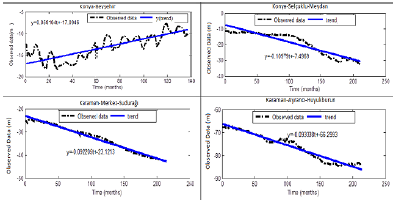
Figure 7 Linear functions of well data in Konya and Karaman. The linear analysis of well data in the Konya Closed Basin revealed that in the last decade, there was a decrease in the groundwater level, especially due to the drought that resulted from the global climate change and excess water use.
From past to present, climatic, geological and geomorphological factors have influenced the changes in the level of groundwater in the Konya Closed Basin. Changes in groundwater level occur both within a year and between years. There is a decrease in the June-September period, which characterizes the dry season within the year, and an increase in the rainy season in January-May. It is observed that there is a significant decrease of up to 1 m in groundwater levels in 30-40-year water wells distributed in the region (Gõçmez & iççioglu, 2004; Dogdu et al., 2007; Üstün et al., 2007). At some stations, the monthly water level data have been recorded since 1960. Üstün et al. (2007) reported a decrease in the groundwater level of 24 wells from the same area. As a result of examining the time series of the wells, it was determined that the decrease in most of these wells was not linear; The groundwater level of the wells around Karapinar was found as 16.9 m in September 1970 and 31.2 m in September 2003. Gõçmez et al. (2004) reported a decrease of 14.3 m in the level of groundwater in a 33-year period. As a result, these reduced levels in the aquifers of the Konya Closed Basin and surrounding areas are caused by the use of water in the existing reservoir in the basin. In addition, it was observed that the decrease in water levels compared to previous years was caused by the unconscious consumption of water (Gõçmez et al., 2004).
According to the comparison of well measurements between 2003 and 2008, the level of Meram-Alakova was 12.5 m lower, Meram-Hataf 18.5 m lower, Çumra-Fethiye lower, and Çumra-Batum 18.9 m lower in 2008. Narrowing/constriction (press) in the aquifer systems due to groundwater drawdown can create a vertical deformation (downfall) in the floor over these systems. Given similar examples elsewhere in the world, it is likely to encounter such a situation for the Konya Closed Basin. Some examples of partial downfall events of the Earth's crust and more detailed information on the geodetic monitoring of these components can be found in the following studies: Phienwej et al. (2006), Abidin et al. (2007), Galloway & Hoffman (2007) and Üstün et al. (2007). Similarly, in the current study, the -70.96 mm/year linear decrease observed in the up coordinate of the KNY1 station calculated from the 560-day time series can be attributed to the decrease in the groundwater level in this region.
Conclusion
In this study, the following results were obtained from the analysis of time series of the north, east and up coordinates and groundwater levels of stationary GNSS stations in the Konya Closed Basin.
Table 4 Linear functions and annual changes of 19 wells in the study area.
| Name of Well | Well Number | Linear Functions y(trend)=c 2 t+c 1 | Linear Changes (cm/year) | Results |
|---|---|---|---|---|
| KONYA-BEYSEHÍR-DOGANBEY | 52770 | y(trend)=0.0581t-17.0946 | 69.72 | significant |
| KONYA ClHANBEYLl BULDUK | 53705 | y(trend)=-0.0109t-11.2754 | -13.08 | significant |
| KONYA-ClHANBEYLl-KARTAL | 53706 | y(trend)=0.0046t-24.4201 | 5.52 | significant |
| KONYA-ClHANBEYLl-SIGIRCIK | 53704 | y(trend)=-0.0326t-22.3711 | -39.12 | significant |
| KONYA-KARAPINAR-GULFET-YAYLA | 52258 | y(trend)=-0.0520t-10.6263 | -62.40 | significant |
| KONYA-KULU | 53707 | y(trend)=-0.0039t-11.3281 | -4.68 | insignificant |
| KONYA-SELÇUKLU | 37325 | y(trend)=-0.0363t-5.4342 | -43.56 | significant |
| KONYA-SELÇUKLU-MEYDAN | 46392 | y(trend)=-0.1098t-7.4969 | -131.76 | significant |
| KONYA SELÇUKLU-SARICALAR | 10472 | y(trend)=-0.0257t+0.1759 | -30.84 | significant |
| KONYA SELÇUKLU-TUTUP | 62564 | y(trend)=-0.0398t+2.1481 | -47.76 | significant |
| KONYA-SEYDÍSEHIR | 49340 | y(trend)=-0.0003t-2.2111 | 0.36 | insignificant |
| KARAMAN- AYRANCI -HUYUKBURUN | 30270 | y(trend)=-0.0933t-66.2993 | -111.96 | significant |
| KARAMAN- KAZIMKARABEKlR-MERKEZ | 1167 | y(trend)=0.0024t-7.8545 | 2.88 | significant |
| KARAMAN -CENTER -AKCASEHIR | 13314 | y(trend)=-0.0585t-33.6459 | -70.20 | significant |
| KARAMAN -CENTER -EMlNLER | 17171 | y(trend)=-0.0379t-2.9531 | -45.48 | significant |
| KARAMAN -CENTER -KOCAHOYUK | 52260 | y(trend)=-0.0610t-0.9697 | -73.20 | significant |
| KARAMAN- CENTER -SUDURAGI | 20122 | y(trend)=-0.0922t-23.1213 | -110.64 | significant |
| NIGDE- ALTINHISAR- CENTER | 52263 | y(trend)=-0.0256t-7.9697 | -30.72 | significant |
| NIGDE -BOR -BAHCELl | 52261 | y(trend)=-0.0069t-1.8532 | -8.28 | significant |
With the time series analysis, important results were obtained concerning the changes in the behavior of GNSS stations, the reasons for these changes, the effect of groundwater level (linear, periodical, etc.), mathematical models and the state of recently installed stations.
The time series of the KONYA station was analyzed in two parts, before and after the slip and data after the second slip was not analyzed because it was scarce. As a result of the analysis, it was observed that the direction and magnitude of the velocities changed if the slip was not taken into account in the time series.
Horizontally, the GNSS stations in the Konya Closed Basin had linear movements in the northeast direction (ITRF08 fixed) with an annual mean movement or velocity of 18.74 mm/yr except KNYA, KNYA* and KNYA** stations. Moreover, while the vertical movements of ANRK, KLUU, and NIGD stations were in the positive direction with a mean annual movement of 0.56 mm, other stations moved in the negative direction except KNYA, KNYA* and KNYA** stations.
The annual vertical movement of the KNY1 station with 560-day data was 70.96 mm in the negative (-) direction, which was the highest value of vertical movements among all stations in this region.
In the periodic component analysis, the signals of the stations contained periodic movements with time varying from day to year. The reason for these movements was considered to be atmospheric and hydrological loading, and climatic effects similar to previous reports on global GNSS stations.
The trend analysis performed for 19 wells showed that they had linear movements in the down direction with a mean of -39.22 cm/ year.
The annual change in the Konya-Selçuklu-Square, Karaman-Ayranci-Huyukburun, and Karaman-Center-Suduragi wells was over 1 m. However, the linear function of the Konya-Kulu and Konya-Seydiçehir wells showed an insignificant linear change at 95% confidence level.
A linear increase (69.72 cm/year) was detected in the Konya-Beysehir-Doganbey well.
The water level of the majority of the wells in the region statistically significantly decreased, and this was at meter level for some wells. The linear decrease of -70.96 mm/year in the up coordinates of the KNY1 GNSS station with 560-day data was considered to be mostly caused by this decrease in the groundwater level.
In the last decade, there has been a decrease in the groundwater level in the Konya Closed Basin due to the drought resulting from global climate change and excess water use.

