


 Inglês (pdf)
 Artigo em XML
 Referências do artigo
 Enviar este artigo por email
 Citado por SciELO
  Citado por Google
  Similares em
SciELO
Similares em
SciELO  Similares em Google
 Permalink
1. Introduction
Forests currently cover one-third of the global land area (Michez et al., 2016), and contain 70% - 90% of terrestrial biomass, making them a key global carbon sink (Drauschke et al., 2014; Dandois et al., 2015). Tropical forests play a crucial role in global cycles (e.g., hydrological or biochemical cycles), contribute to global economy and welfare (Pan et al., 2011; Sasaki et al., 2011), and harbor around two-thirds of all known species (Paneque-Gálvez et al., 2014). Forests in tropical countries have been recognized for their role in carbon storage by the United Nations Collaborative Programme on Reducing Emissions from Deforestation and Forest Degradation (UN-REDD+) and their high biodiversity by the Convention on Biological Diversity (CBD). Detecting forest degradation is a particularly difficult challenge because of the high level of detail required to identify subtle or gradual changes caused by wood extraction, selective logging, or loss of species richness (GOFC-GOLD, 2017). This has resulted in a greater need for monitoring and capturing information on tropical forests. Describing structural characteristics of forests has become an essential prerequisite for management and monitoring (Bonnet et al., 2013), especially in tropical countries to achieve effective REDD+ implementation. In addition, there are potential co-benefits for biodiversity conservation, climate change mitigation, and livelihood support (Paneque-Gálvez et al., 2014).
Natural resource managers who characterize forest structure exploit the dendrological and dendrometric characteristics of forests, including height, basal area, and volume (White et al., 2013). Canopy height (CH) is undoubtedly one of the most important structural characteristics for forest planning. CH provides the basis for determining the attributes of trees and stands (Bonnet et al., 2017) because it correlates strongly with volume, biomass, carbon stock, and productivity (White et al., 2013; Dandois and Ellis, 2013; Steinmann et al., 2013; Lisein et al., 2013). Vegetation height also provides essential information related to ecological, hydrological, biophysical, and micro-meteorological processes (Zarco-Tejada et al., 2014), and has also been used to monitor biodiversity and analyze land cover and habitat landscape (Bergen et al., 2009). In addition, vegetation height serves as an input for several models for estimating biomass (Sierra et al., 2007; Rutishauser et al., 2013), which facilitates estimation of carbon stocks in forest ecosystems and improves our understanding of the global carbon cycle. Simultaneously, the amount of carbon stored by vegetation is a key parameter of biomass burning models for quantifying greenhouse gas emissions (Anaya, 2015). In the tropics, biomass burning is the main cause of greenhouse gas emissions (van der Werf et al., 2017).
Tree height is the most common remotely sensed three-dimensional (3D) estimate, generally captured in the form of a canopy height model (CHM). Several platforms and techniques are available to derive these models. An example at a global scale is the GEDI program (https://gedi.umd.edu/) using a laser altimeter. Tree height can also be obtained at a local scale by applying stereo-pair and multiple-stereo photogrammetry to a series of images acquired from aircraft and from airborne Light Detection And Ranging (LiDAR) (Dandois and Ellis, 2013). The small footprint, along- and across-track density and laser pulses emitted by a LiDAR system means that it can penetrate the canopy and reach the forest floor. This allows recording of multiple returns and enables derivation of vertical forest profiles (Lisein et al., 2013), as well as generation of three-dimensional, georeferenced point clouds. Models of understory terrain elevations (Digital Terrain Models: DTM) and top-of-canopy surface heights (Digital Surface Models: DSM) can be generated by filtering the above-mentioned point cloud (Dandois and Ellis, 2013). In addition, surface heights can be derived by the subtraction of the DSM from the DTM, resulting in normalized aboveground object heights (i.e., tree heights, CHM) (White et al., 2013). Tree height can also be derived from active synthetic aperture radar (SAR) sensors using interferometric and polarimetric observations where data from different sensors have been used, for instance: digital surface model from Shuttle Radar Topography Mission (Kellndorfer et al., 2004), L-band backscatter from ALOS-PALSAR (Joshi et al., 2015), PolInSAR coherence models using Radarsat-2 (Kumar et al., 2017), Interferometric coherence from TanDEM-X (Bispo et al., 2019), Random Volume over Ground models using TanDEM-X data (Kugler et al., 2014; Lee and Fatoyimbo, 2015), and UAVSAR data (Lavalle and Hensley, 2015).
An emerging alternative is aerial remote sensing, which enables regular aerial 3D measurements of canopy structure and spectral attributes at a considerably lower cost, with properties like those of LiDAR, but with red-green-blue (RGB) spectral attributes for each point (Dandois and Ellis, 2013). Unmanned aircraft systems (UAS's), also known as 'drones' are emerging as viable alternatives and are available in numerous forms offering flexible platforms. In many cases, UAS's have the potential to supplement and complement remote-sensing measurements acquired from satellites or manned aircraft systems (Whitehead and Hugenholtz, 2014). Furthermore, UAS imagery can provide, a rapid and low-cost alternative to multi-temporal RS data acquisitions for meaningful estimates of forest canopy attributes (Chianucci et al., 2016), especially in developing countries where Airborne Laser Scanning (ALS) acquisitions are less frequent (Giannetti et al., 2018).
UAS imagery can be acquired with user-grade cameras and low-cost global navigation satellite systems (GNSS), while 3D geometry is generated a posteriori with software that combines structure-from-motion (SfM) algorithms and photogrammetric principles (Puliti et al., 2015). This technique depends on the high image overlap and information redundancy from UAS imagery. The results meet the standards for forest inventories with very high spatial and temporal resolution (Lisein et al., 2013; Giannetti et al., 2018).
Remote-sensing approaches such as optical systems (i.e., UAS's) that use high-density point-cloud such as LiDAR sensors, also enable the detection of forest structural attributes (i.e. dominant tree height and crown diameter), while providing low-cost alternatives to field-based assessment. This may be done by using a technique known as segmentation, which was designed for identifying the edges of a finite set of non-overlapping objects that subdivide an image into tessellated regions, in this case, tree crowns. During this process, adjacent objects can be merged or divided based on specified criteria of homogeneity. Tree crown dimensions are a fundamental structural parameter of forests, which can be used to model different tree structural variables such as stem diameter, height, and biomass. This is useful in forest inventory, regeneration assessment (Pouliot et al., 2002; Barnes et al., 2017) and forest degradation.
Several approaches have been proposed for tree crown delineation from aerial imagery, such as watershed transformation (Ene et al., 2012; Panagiotidis et al., 2016; Barnes et al., 2017), region growing (Solberg et al., 2006; Novotny et al., 2011), valley following (Gougeon, 1995; Leckie et al., 2003), mean-shift segmentation (Huang and Zhang, 2008; He et al., 2016), energy balance (Gleason and Jungho, 2012), and hill climbing (Ke and Quackenbush, 2011).
The goal of this study was to evaluate the strengths and shortcomings in determining structural tree parameters (CH and crown dimensions) in a cloudy tropical environment using photogrammetric methods applied to UAS imagery. The field plot is a fragment of tropical forest located in a matrix dominated by industrial crops and pastures with varied topographical relief.
We aim to evaluate SfM technology in a tropical environment within a forest fragment with high cloud content, where trees can reach more than 40 meters with closed canopy, but at the same time, where degradation and fragmentation allows for ground detection. Under these circumstances, we expect SfM to have higher accuracy when estimating the ground class.
2. Materials and Methods
2.1. Study Site
The study site is a forest fragment of 60 ha that faces enormous pressure in terms of land use change. It is located in the floodplain of the León River (7° 54' N; 76° 36' W) with an elevation varying from 17 m to 60 m above sea level. Rainfall exceeds 2500 mm/year, and the average temperature is above 25 °C (Figure 1). The forest fragment is located in the northwestern part of South America, known as the bio-geographic Chocó, in the municipality of Urabá, Colombia. The Northwest area of South America is a region with unique characteristics that make it one of the most biodiverse regions in the world (Galeano et al., 1998; Gentry, 1986; Myers et al., 2000). This region includes the western slope of the Andes Mountain range from Ecuador, Colombia and includes some regions in southern Panama. The region encompasses an important altitudinal gradient from sea level to the high peaks of the Andes Mountain above 4000 meters above sea level. This condition represents an important variety of eco-regions, which includes páramos in the upper part of the Andes, montane forests of the Andes in the intermediate regions of the western slope, humid forests and flooded humid grasslands in the lower part, mangroves in the coastal zones and dry forests towards the southwestern zone of Ecuador (Olson et al., 2001). This area represents one of the most diverse cultural mosaics in South America and the Caribbean, with origins dating back to pre-Hispanic times when it was inhabited by more than thirty different human groups. Presently, different indigenous communities, numerous Afro-descendant communities and mestizo communities descended from immigrants from various regions inhabit the region (WWF Colombia, 2008). These communities depend directly on the ecosystem's goods and services (MADS and PNUD, 2014).
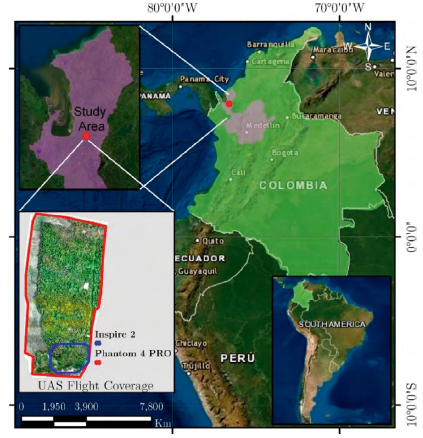
Source: Basemap from Esri, HERE, Garmin, © OpenStreetMap contributors, and the GIS user community.
Figure 1 The study area's forest fragment is located in the northwestern part of South America, known as the bio-geographic Chocó, in the municipality of Urabá, Colombia.
Despite its biological and cultural importance, the region faces great threats associated with the transformation of natural landscapes, which have been intensified mainly by the replacement of forest ecosystems by pastures for livestock, industrial banana and oil palm plantations and other uses (Fagua and Ramsey, 2019). Industrial plantations and livestock are normally related to the construction of channels that drain excess surface water, thus altering the region's hydrology (Anaya-Acevedo et al., 2017). The expansion of the agricultural frontier, livestock, illicit crops, and illegal mining in the region has resulted in a significant degradation of ecosystems in recent years (Anaya et al., 2020; Fagua and Ramsey, 2019), with estimations of deforestation rates close to 135 km2/year (Fagua and Ramsey, 2019; Hansen et al., 2013). Additionally, illegal gold and gravel mining activities in numerous water currents alter natural water flows and their quality, putting the stability of ecosystems and the services they provide at risk (Meyer et al., 2019; Patino and Estupinan-Suarez, 2016; UNODC, 2017). The difficulty accessing the region, which is mainly due to scarce infrastructure, characteristics of the terrain, rapidly changing threats to natural ecosystems and regional social conditions, represents a challenge for forest monitoring, and implies an urgent need to develop monitoring strategies.
2.2. Unmanned Aircraft Systems (UAS) datasets
A flight was designed using Pix4D capture over the forest fragment (PIX4D, Lausanne, Switzerland). The field campaign was carried out at the end of the dry season over a period of two days, April 28th and 29th of 2018. This time was required to set up all the equipment including a sub metric GNSS base station, GNSS rover, and two UAS platforms. Two image datasets were acquired in the study area using these platforms. The primary UAS imagery was acquired by using a DJI Phantom 4 PRO (DJI, Shenzhen, China), a single, multi-rotor quadcopter Unmanned Aircraft Vehicle (UAV) equipped with a 20-megapixel RGB camera (1" CMOS sensor). This UAV was also equipped with an inertial measurement unit and consumer-grade GNSS. These sensors determine the position and altitude of the aircraft during flight. The main objective of this survey was to generate the CHM with an effective ground separation distance less than 0.05 m.
For comparison, a second UAS image dataset was acquired by using a DJI INSPIRE 2 drone equipped with a Parrot SEQUOIA multispectral RGB camera with a RGB sensor and individual red, green, red-edge, and near-infrared sensors (Parrot, Paris, France). This camera had an inertial measurement unit and magnetometer, with built-in GNSS to determine the location and orientation of each UAS image. This device was used to perform an aerial survey with the spatial extent encompassing a smaller region to the southeast part of the study site.
The UAS flights have a flying altitude of 93.1 m which fulfill the aeronautic regulation of the country. The ground resolution considers a GSD of 2.18 cm/pix (RGB camera) and 8.17 cm/pix (Multispectral RGB camera).
2.3. Data processing
2.3.1. Generation of the ortomosaic and the Canopy Height Model
To extract 3D models from multiple UAS overlapping photographs, we used a SfM photogrammetric technique, which involved using image-matching methods to process a set of non-oriented images acquired from multiple views to extract the 3D point cloud and generate the 3D model. According to Chiabrando et al., (2015), three steps compose the SfM process.
In the first step, multiple views of an object captured from a range of different positions are aligned by automated identification of matching features within all images. This process is iteratively refined by using nonlinear least-squares minimization (Chiabrando et al., 2015), enabling initial estimates of camera positions and object coordinates. The detection and extraction of the tie points (features that can be clearly identified in two or more images and that can be selected as a reference point to improve relative accuracy of photogrammetry projects) are based on geometrical similarities, such as object edges, and can be performed using algorithms such as scale-invariant feature transform (SIFT) (Lowe, 2004), and speed-up robust feature (Bay et al., 2006). Currently, the main software for the initial stage of the digital photogrammetric workflow is based on SIFT, or on the modified version of SIFT.
The position of feature points is monitored throughout the sequence of images, and a local descriptor is assigned to each point according to its local neighborhood. This is useful for detecting point correspondences between all images in the set. Thus, after this phase, the camera interior and exterior parameters and its positions and assets are defined in a local reference system, which aims to create a sparse 3D point cloud of features corresponding to the locations of the estimated feature points.
In a second step, a dense multi-view stereo reconstruction of the aligned images generates a dense 3D representation of the object's surface geometry. In this phase, the dense reconstruction algorithm considers how the individual depth maps are merged into the final digital model and generates detailed 3D meshed models from the pixel values.
The final step involves the numerical representation of the morphology and surface objects, which is equivalent to a DSM. This is essential for generating true orthophotos because they are vital for texturing the computed mesh.
All images were first treated as different image blocks for computing image orientation by aero triangulation, after that, they were merged into a unique image block. The workflow is summarized in Figure 2.
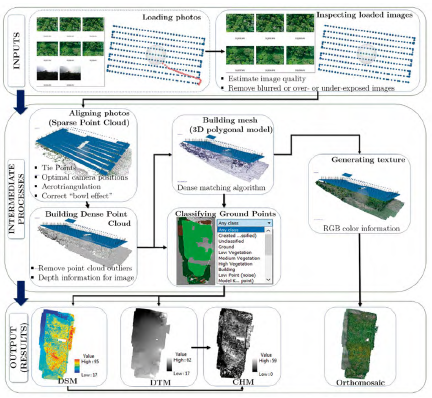
Figure 2 Schematic diagram describing the photogrammetric process for Digital Surface Model, Digital Terrain Model and Orthomosaic generation.
A dense surface reconstruction known as a mesh was generated by using a dense matching algorithm (Pineux et al., 2017). Taking into account that the generated 3D point clouds contain RGB color information extracted from the input images, they were used to generate final surface products (Kaiser et al., 2014) and the model texture (Nikolakopoulos et al., 2017). In this sense, an interpolation process following the Agisoft Photoscan Pro version 1.3.1 (Agisoft LLC, St. Petersburg, Russia) workflow generated a DSM surface.
The absolute heights in the DSM were normalized to obtain relative heights by subtracting the terrain height from the DTM generated from the height of each point of the dense point cloud in the 'ground' category. The DTM was built by visually identifying ground points inside and outside the forest fragment and the points were interpolated using an Inverse Distance Weighted algorithm. The CHM is calculated as the difference between DSM and DTM heights, which represent the tree heights; that is, the distance between the ground and the treetops.
Finally, authors exported the model to a grid-based format and generated an orthomosaic after a quality check of the individual images, which were merged and projected onto a local coordinate system (i.e., the Magna-Colombia projection system). For this projecting purpose, the markers (reference points) projections were used.
Table 1 shows all parameter values used in the Agisoft Photoscan Pro workflow and that were applied to all image blocks of the primary UAS image dataset acquired by using a DJI Phantom 4 PRO (RGB camera). Table 2 summarizes the statistics describing the alignment of the image block from the survey.
Table 1 Settings of Agisoft Photoscan Pro workflow parameters.
| Process | Reconstruction parameter: Value |
|---|---|
| Align photos |
|
| Optimize alignment | Self-calibration of the camera: Yes Camera accuracy (m): 10 Camera accuracy (deg): 2 Marker accuracy (m): 0.005 Projection accuracy (pix): 0.1 Tie point accuracy (pix): 4 Fit all except for k4 & rolling shutter |
| Build dense cloud | Quality: High Depth filtering: Mild |
| Build mesh | Surface type: Height field Source data: Dense point cloud Face count: High (57.513.694) Interpolation: Enabled Point classes: All |
| Build DEM | Source data: Dense point cloud Interpolation: Enabled |
| Build Orthomosaic | Blending mode: Mosaic Surface: DEM Enable color correction: No Enable hole filling: Yes |
2.3.2.Tree-crown delineation or segmentation.
For image segmentation, we used the object-oriented classification method based on the mean-shift algorithm provided in the open-source software Orfeo Toolbox/Monteverdi (OTB, 2018). OTB is used worldwide because it extracts spatial features, segments, and classifies high-resolution imagery (Huang and Zhang, 2008). This software is efficient, and free for research, teaching, and even commercial use (Zou and Lin, 2013).
Mean-shift segmentation is an approach for tree crown delineation from imagery using object-based image analysis (OBIA), which tends to provide better results than the traditional pixel-based approach when VHR data is used (Komárek et al., 2018).
This type of analysis begins with an image segmentation into closed objects taking into consideration certain criteria of homogeneity regarding shape, texture and context information associated with the objects (Marpu et al., 2010). The resulting objects can be classified until the object shapes (i.e., tree crown boundaries) are fully delineated. In this research, the OBIA technique was used to delineate tree crowns using the UAS imagery datasets because of its ability to successfully delineate tree crowns using VHR imagery (Singh et al., 2015).
The mean-shift algorithm, with its nonparametric nature, is an efficient spatial-feature-extraction method for delineating arbitrarily shaped clusters. It exploits contextual homogeneity and reduces spectral variation in local areas and, at the same time, preserves edge and detail information. Thus, it identifies geographical features by using scale and homogeneity parameters obtained from reflectance in RGB and from elevation (Huang and Zhang, 2008). In addition, mean-shift segmentation also helps to open the original image into a multi-scale space to allow scale to be incorporated into classification (Zou and Lin, 2013).
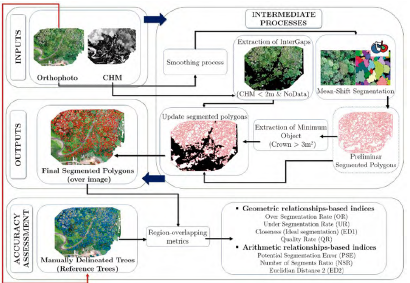
In this study, OTB is used for mean-shift segmentation of 20 ha, which is approximately 33% of the study area. The input-parameter settings for the segmentation are (in pixels): spatial radius of 20, minimum object of 12, and minimum region size of 100. Both 5-cm-pixel CHM model and RGB orthorectified images were used to improve the quality of the tree-crown delineation by using the spectral information from the RGB bands and the tree-crown edge information from the CHM. Figure 3 shows the method used for segmentation using the secondary UAS image dataset acquired by using a DJI INSPIRE 2 drone (Multispectral RGB camera).
2.4. Validation process
2.4.1. Model comparison
As mentioned previously, a second UAS flight was executed for comparison in the southeast zone of the study area, which covered 20 ha over the study site (see Figure 1 for UAS flight coverages). This aerial survey used a different sensor for the optical camera. Specifically, a multispectral camera equipped with individual red, green, red-edge, and near-infrared sensors, and the 3D point cloud from this device was processed by using a Pix4D mapper Pro.
A subset of the original DSM was obtained with the same extension as the multispectral camera survey, with the aim being to compare quality and correlation between both models.
2.4.2. Segmentation accuracy assessment
Some object metrics have been proposed to evaluate a segmentation considering the data quality as well as the optimal customization of parameter settings, which enable the adaptation of segmentation results on target objects as manually delineated trees. The inaccuracies (anomalies) of segmentation refer to over-segmentation and under-segmentation; it means 'too many' or 'too few' segments respectively (Möller et al., 2007).
As recommended by Montaghi et al., (2013), we applied a threshold method before calculating the metrics to reduce false delineation caused by small overlapped regions between the reference and segmented trees. An intergap zone was defined by selecting cells in the CHM shorter than 2 m. In addition, referenced and segmented trees with areas less than 3 m2 were removed from the analysis. An exhaustive reference polygon dataset was used, where 857 reference objects were manually digitized from UAS images, and then superimposed on the automatically estimated tree crowns to assess accuracy.
This work used vector-based measures to compare the results of object-based image segmentation with a set of manually delineated objects extracted from the UAS image (orthophoto mosaic), as adopted by Gougeon and Leckie (2003). Fortius purpose, we used the most common indices used in the literature: quality rate (QR), over-segmentation rate (OR), under-segmentation rate (UR), and Euclidean distance (EDI) (Weidner, 2008; Clinton et al., 2010; Liu et al., 2012). However, because these indices focus only on geometric relationships, they may not be sufficient to describe the diverse types of discrepancies. Therefore, we used arithmetic relationship indices, as a complement to the aforementioned geometric indices. The arithmetic indices used in this validation were proposed and defined by Liu et al., (2012): potential segmentation error (PSE), number of segments ratio (NSR), and Euclidean distance 2 (ED2).
The indices based on geometric relationships are calculated as follows (Weidner, 2008; Clinton et al, 2010; Liu et al, 2012):
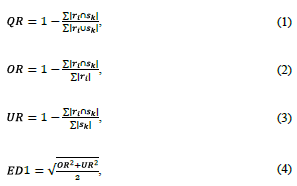
where r i is a reference polygon in a reference dátasete, R i = 1, 2, ... ; and s K are the corresponding segments in a corresponding segmented-object dataset S,with/t=l,2, ....
The indices based on arithmetic relationships are calculated as follows (Liu et al, 2012):
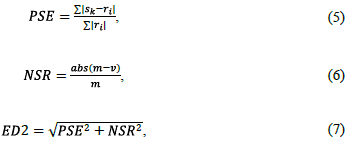
where s k , and ri are defined as above, m is the number of reference polygons, and V is the number of corresponding segments.
2.4.3. CHM accuracy assessment
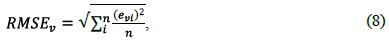
The heights of 59 individual trees (objects) identified in the orthophotos were measured using a Leica DISTOTM E7500Ì Laser Distance, which has 14 measurement modes and a 360° tilt sensor with an accuracy to 0.16 cm. The sample (n = 59) was defined in order to have as many measured trees as hectares of the plot, measurements were distributed systematically considering topographic and vegetation differences (see Figure 4). Orthophotos with a 10 m grid of a WGS-84 UTM18 North proj ection were used in the field to identify the 59 trees with the help of a compass and the GPS. We found a straight line of view from the forest floor to the treetop for each tree and made several measurements to determine the maximum value vr i (Equation 9). Accordingly, the crown delineation was made by visual interpretation and the maximum value was selected for each crown in the CHM vm i . (Equation 9). The vertical accuracy was calculated as the mean vertical error uv i of the sample errors ev i ., which was estimated as the vertical root-mean-square error (RMSEv):
with:

where vr i is the reference height of tree i measured in the field, vm i is the maximum CHM height at the crown level derived from optical images, n is the number of sampled trees, and the standard deviation S v of the vertical error is estimated by:
The standard error in the estimates oí RMSEv is estimated by:

Finally, the estimated error interval at a 95% probability level is: RMSEv ± 1.96 S RMSE
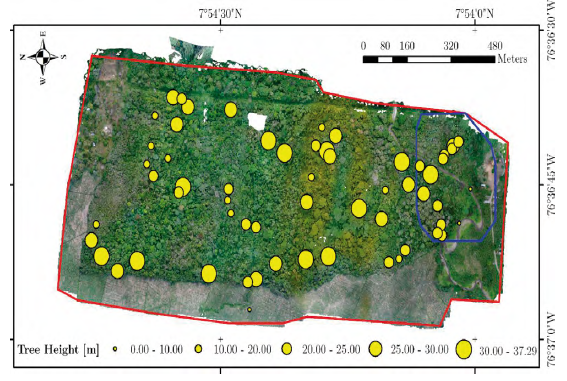
Figure 4 Distribution of tree height (reference data) used to measure the accuracy of CHM. In color polygons UAS flights coverage is shown: Red polygon (Phantom 4 PRO - RGB camera), blue polygon (Inspire 2 - Multispectral camera).
Three classes were used to determine the bias per class: 10 - 20 m, 20 - 30 m, and 30 - 40 m and the mean value of ev i . was calculated for each class. This bias is a measure of the difference between the expected value of the reference height of tree i with respect to the model vm i .
3. Results
3.1. Model generation
A total of 2671 images were acquired with the optical RGB camera, covering 60 ha of the forest fragment (Figure 4). Only 2135 images were correctly aligned, obtaining a ground resolution of 2.18 cm/pixel. A total of 1'558 358 tie point positions were adjusted, with a mean residual of 0.841 pixels (reprojection error). We acquired 1632 with the multispectral RGB camera, considering the four sensors covering an area of 20 ha in the southeast zone of the study area. A total of 1460 photographs were correctly calibrated, which yielded a ground resolution of 8.16 cm/pixel. A total of 1' 657 685 tie point positions were adjusted, with a mean residual of0.276 pixels (reprojection error). Having two consecutive flights allowed us to determine whether the SfM method produces consistent results, and we found a correlation of R2 of 0.99 between both DSMs. The extent of NoData was determined in those areas where photographs did not match or photographs did not sufficiently overlap, and the required tie points could not be obtained to densify the point cloud. NoData was propagated from the DSM to the DTM and CHM. The DSM was not estimated over a total of 2% of the area.
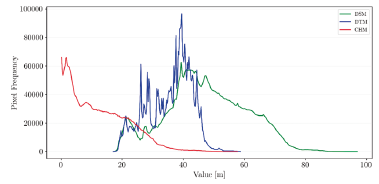
All classes of the dense 3D point cloud were used to reconstruct a dense surface via a dense matching algorithm. The resulting DSM has a range between 17.12 and 96.96 m, a mean of47.50 m, and a standard deviation (SD) of13.16 m. In the case of the DTM, a similar dense surface was reconstructed, but only by considering the height of those pixels in the ground category in the DSM. The resulting DTM ranges from 17.12 to 58.71 m, with a mean of 35.78 m and a SD of 7.19 m above the ground.
The tree heights corresponded to the difference between the DSM and DTM, which is known as the CHM. This model ranged from 0 to 57.76 m, and had a mean of 11.72 m and a SD of 9.71 m above ground. The pixel frequencies and values are given in Figure 5.
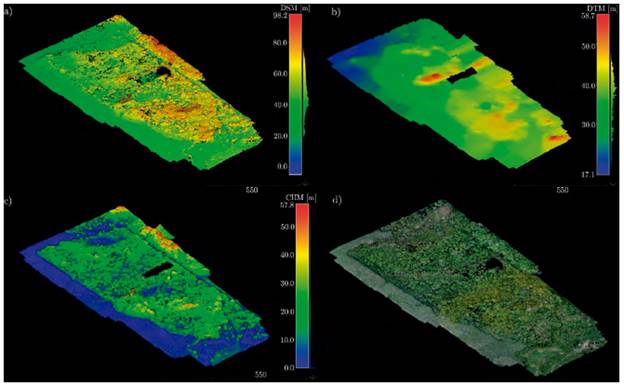
Considering the RGB color information extracted from the input images and the dense 3D point cloud, we generated an orthomosaic of the study area, which has a ground spatial resolution of 0.50 m. The respective DSM, DTM, and CHM were also exported with a 0.50 m pixel size (Figure 6).
3.2. Vertical accuracy of canopy height model (CHM)
The GPS and the orthophoto maps allowed us to identify each of the 59 trees in the field (Table 3). The average tree height measured in the field with the DISTOTM E7500i Laser was 24.5 m with a maximum of 37.3 m. The estimated RMSE of the vertical errors (Equation 8) was 3.6 m with a 95% confidence interval of 0.53 m. meaning that there is a 95% proven reliability that the unknown population average error is between 3.05 and 4.12 m.
Table 3 Differences in tree height ev t between field measurements (reference data) at individual tree scale (vr i ) and estimated by the CHM (vm i ) as the maximum height for each crown.
| ID | vri | vm. | evi | ID | vri | vmi | evi | |
|---|---|---|---|---|---|---|---|---|
| 001 | 31.2 | 28.6 | 2.6 | 030 | 34.7 | 32.5 | 2.2 | |
| 002 | 27.1 | 25.6 | 1.5 | 031 | 27.9 | 25.3 | 2.6 | |
| 003 | 24.3 | 27.1 | -2.8 | 032 | 3.8 | 5.1 | -1.3 | |
| 004 | 23.6 | 25.8 | -2.2 | 033 | 26.2 | 31.1 | -4.9 | |
| 005 | 21.0 | 19.9 | 1.1 | 034 | 17.2 | 15.9 | 1.3 | |
| 006 | 24.2 | 31.1 | -6.9 | 035 | 30.6 | 24.9 | 5.7 | |
| 007 | 6.2 | 3.6 | 2.6 | 036 | 26.0 | 25.6 | 0.4 | |
| 008 | 23.3 | 26.5 | -3.2 | 037 | 31.2 | 32.2 | -1.0 | |
| 009 | 23.6 | 26.9 | -3.3 | 038 | 30.5 | 28.0 | 2.5 | |
| 010 | 24.9 | 26.0 | -1.1 | 039 | 21.0 | 22.1 | -1.1 | |
| 011 | 28.3 | 22.8 | 5.5 | 040 | 25.4 | 24.9 | 0.5 | |
| 012 | 24.9 | 20.3 | 4.6 | 041 | 23.0 | 27.6 | -4.6 | |
| 013 | 19.0 | 17.5 | 1.5 | 042 | 22.9 | 17.8 | 5.1 | |
| 014 | 23.7 | 20.5 | 3.2 | 043 | 19.7 | 22.9 | -3.2 | |
| 015 | 28.4 | 24.5 | 3.9 | 044 | 16.3 | 17.2 | -0.9 | |
| 016 | 23.0 | 24.5 | -1.5 | 045 | 20.3 | 13.4 | 6.9 | |
| 017 | 28.0 | 23.2 | 4.8 | 046 | 32.1 | 30.3 | 1.8 | |
| 018 | 19.8 | 27.1 | -7.3 | 047 | 33.4 | 34.8 | -1.4 | |
| 019 | 10.7 | 10.0 | 0.7 | 048 | 30.0 | 25.2 | 4.8 | |
| 020 | 27.6 | 24.9 | 2.7 | 049 | 27.4 | 26.4 | 1.0 | |
| 021 | 36.5 | 28.8 | 7.7 | 050 | 27.6 | 22.1 | 5.5 | |
| 022 | 34.5 | 26.7 | 7.8 | 051 | 19.9 | 22.5 | -2.6 | |
| 023 | 28.3 | 22.0 | 6.3 | 052 | 31.6 | 28.9 | 2.7 | |
| 024 | 22.9 | 22.2 | 0.7 | 053 | 23.7 | 22.9 | 0.8 | |
| 025 | 19.6 | 16.7 | 2.9 | 054 | 22.1 | 20.2 | 1.9 | |
| 026 | 24.6 | 20.0 | 4.6 | 055 | 15.2 | 18.7 | -3.5 | |
| 027 | 26.0 | 27.7 | -1.7 | 056 | 13.1 | 10.4 | 2.7 | |
| 028 | 35.7 | 31.9 | 3.8 | 057 | 10.5 | 10.2 | 0.3 | |
| 029 | 37.3 | 33.5 | 3.8 | 058 | 29.4 | 31.1 | -1.7 | |
| 059 | 25.0 | 24.5 | 0.5 |
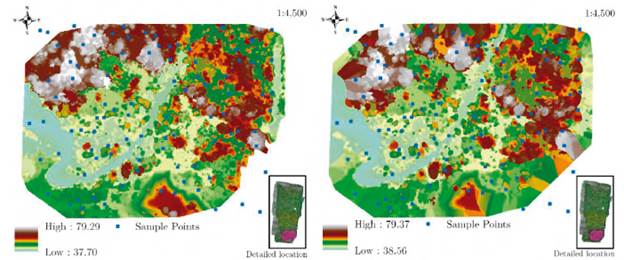
For comparison purposes, both UAS datasets were analyzed (Figure 7). Using a random sampling of283 points, we found a correlation coefficient of 0.99 between both generated DSMs. The results of the aforementioned flight height for both UAS datasets were considered in this analysis.
3.3. Accuracy of delineation of tree crowns
Figure 8 shows the 857 reference objects manually digitized from UAS images, and the result of delineating individual tree crowns by using the mean-shift algorithm provided in the open-source software Orfeo Toolbox/ Monteverdi (OTB, 2018), over the multispectral RGB image (Sequoia camera). From the geometric and arithmetic indices used for validation (Figure 3) we found: Over-segmentation error was 7.1% for the overall validation area, the under-segmentation error was 36.2%, and the total accuracy for delineating tree crowns was 73.9% (i.e., ED1 = 26.1%). The comprehensive index of quality rate (QR) was 39.2%. For the arithmetic indices, PSE had an error of 45.7%, whereas NSR had 20.0%, and the delineation of tree crowns was 50.1% accurate overall (i.e., ED2 = 49.9%). For the accuracy measurements of 1:1 correspondence, 30% of the total reference crowns matched correctly with respect to the segmented trees, and 29% of the reference objects were omitted.
4. Discussion
4.1. Canopy height model accuracy
The accuracy of our estimated CHM incorporates the uncertainty of the DSM and DTM. DSM errors are associated with GPS accuracy (geometric dilution of precision) and the quality of individual photographs while the DTM depends on the visual interpretation of the photogrammetric point cloud and the interpolation of the points. The latter is highly dependent on the characteristics of the canopy, which is very closed in tropical forests. Ota et al., (2017) found a RMSE of maximum height of 1.24 m for temperate conifer forests in Japan which has higher accuracy than our results.
When evaluating the accuracy of the CHM against tree height measured in the field, the correlation was R2 = 0.75, this value is within the range of (R2 0.63 - 0.84) found by Dandois et al., (2013) in a temperate deciduous forest. This is because the CHM model is a function of DTM accuracy, which depends on the penetration of sunlight through canopy gaps, and this is highly limited in these tropical forests. Therefore, the quality of the absolute height estimation depends strongly on the complexity of the terrain and the canopy closure. Concern also surrounds the determination of the tree height measurements in the field (i.e., the treetop). Despite the 0.16 cm accuracy of the DISTO laser, several measurements are required to select the maximum height for each tree crown. The observation must be made below the maximum tree height because a straight line of sight is required between the DISTO laser and the given treetop. The difficulty of finding such a straight line of sight varies between tree species and is affected by the presence or absence of leaves, which is associated with the phenological cycles.
4.2. Quality assessment of tree crown delineation
Although in the bio-geographic Chocó there has already been regional assessment of forest structure and aboveground biomass using measurements from a combination of ground tree inventories and airborne (LiDAR) (Meyer et al., 2019), this study is the first approach for delineating tree crowns in this natural tropical forest fragment using VHR imagery from UAS's.
Regarding the tree-crown delineation validation, because the QR index is far from zero, then a low geometric match is obtained due to a clear discrepancy of the canopy segmentation with the reference polygons. However, QR alone does not adequately assess image segmentation quality, because none of the existing indices can directly identify the optimal combination of parameters for the segmentation process. In general, input parameters that influence the size of the segmented-image objects are mostly selected intuitively by trial and error (Möller et al., 2007; Marpu et al., 2010), although additional metrics have been proposed to improve this quality assessment measuring both topological and geometric similarity between segmented objects and reference objects, for instance SimSize and Area Fit Index - AFI (Montaghi et al., 2013). Other studies have used metrics to assess correct segmentation, over-segmentation, and under-segmentation, assuming that correct, over-, and under-segmentation correspond to the cases true positive, false positive, and false negative results, respectively (Miraki, 2021), but this approach was not considered in this paper.
Few studies have attempted to estimate the tree crowns of tropical forests of high biodiversity, which primarily consist of broad-leaved trees with a great variety of species and ages (Matsumoto et al., 2017). A study in a tropical context was developed by Wagner et al., (2018) in the Brazilian Atlantic rain forest with highly heterogeneous tropical canopy cover, comprising both deciduous and evergreen species in the municipality of Campinas (São Paulo State - Brazil). They used VHR satellite images for tree detection and segmentation, obtaining results of several tree crowns correctly detected of 79.2%, which although not validated with the same metrics, led to a result of an overall accuracy of 85.3%. This is not very different from those obtained in this research (73.9%). Qiu et al., (2020) proposed a new tree crown delineation method using both brightness and spectra from high resolution multispectral images in a plot with high biodiversity and dense crowns with different shapes, structures, and distinctive colors in the Amazon rainforest, achieving a delineation accuracy of up to 76%.
The UAS-derived CHMs for individual tree crown delineation normally perform well in coniferous forests, but their capabilities in broadleaf or mixed forests are still challenging (Miraki et al., 2021). In fact, for the accuracy measurements of 1:1 correspondence, the reference crowns matched correctly and the ED2 result indicates a low performance in the vegetation of the analyzed tropical mixed forest ecosystem, but the manually delineated objects (trees) still influence the results (Clinton et al., 2010) in terms of comparing the shape geometry and the distance between object boundaries (Montaghi et al., 2013). Visual interpretation has limitations with respect to clearly detecting small trees. In addition, delineating irregular-shaped tree crowns manually is difficult for large-scale imagery because of the influence of background (Ke and Quackenbush, 2011).
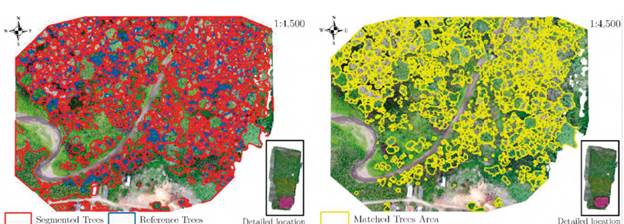
Figure 8 Result of individual-tree-crown delineation. (Left) Reference and segmented trees obtained using mean-shift segmentation. (Right) Matched trees area between digitized trees and segmented trees.
In tropical forests, traditional UAV photogrammetry demonstrates its effectiveness (Giannetti et al., 2018), and several segmentation techniques have been proposed, but they are not specifically conceived for the segmentation of the tropical forest. Such techniques normally perform well in coniferous forests with obvious between-crown shadows, but fail in dense deciduous or mixed forests, where tree crowns are close to each other and between-crown shadows and boundaries are unobvious, whereas adjacent tree crowns may be of distinguishable spectra (Qiu et al., 2020).
Furthermore, the level of detail available in VHR images could potentially have a strong negative effect at various stages of the processing (Zou and Lin, 2013). VHR images may provide very high detail, but can cause large variations, and thus crown edges can be less detectable. This is especially the case where small trees, with relatively small crowns, are dominant (Ke and Quackenbush, 2011).
In addition, note that irregular-shaped crowns create differing reflectance patterns, which are difficult to recognize. In our case, the tropical forest has trees of varying age, species, height, crown size, and crown shape, which causes significant variation in brightness in the VHR images acquired with the UAS. These result in commission errors, where multiple tree peaks are erroneously identified within the same crown. We thus applied image smoothing in an attempt to reduce the noise caused by small branches and their corresponding shadows within a given crown. Nevertheless, some non-forest areas, such as soil, were falsely identified as tree crowns in the segmentation process.
Our results indicated a degree of sensor-specific independence. For example, there are subtle variations in reconstructed crown geometry (i.e., shape, height) and the perceived shape of low-lying vegetation and the terrain beneath. Despite this, and divergent altimetric accuracies, the comparison between both CHM models showed a 99% correlation. Evidently, both sensor type - and the processing software and workflows employed - will impact the output 3D models. However, results are sufficiently similar and of suitable accuracy to facilitate tree segmentation at our desired accuracy.
According to the results and the characteristics of sensor type, we suggest for future studies to derive different indices from the available spectral bands and enhance the input data for segmentation.
4.3. Photogrammetry software package used
Regarding the consequences of the use of the processing software, it is worth considering the potential of each software used. Initially, it is necessary to highlight the issue of orthomosaic and VHR imagery generation, since Pix4D mapper performs an orthorectified mosaic (from the average mapping of pixels, it means, averages the color of each pixel according to the colors of each photo with overlap in that area) based on the generated DSM, while Agisoft Photoscan allows choosing the type of surface on which the orthorectification of the images will be performed. This can be a significant time saver in certain situations. On the other hand, with respect to the treatment of multispectral information, Pix4D mapper provide more tools for the analysis of vegetation and forest areas, when using cameras such as the Parrot Sequoia. With respect to the DSM, we found a 99% correlation between both models generated by Agisoft Photoscan and Pix4D, hence, there are no appreciable differences or important consequences to discuss.
4.4. Potential of photogrammetry canopy height models
Studies have shown that both digital photogrammetry or LiDAR using space-borne or airborne imagery (acquired with manned airplanes) are appropriate for determining forest canopy heights (Kadmon and Harari-Kremer, 1999; Lisein et al., 2013). Tree height accuracy using LiDAR is close to 1 m (Mielcarek et al., 2018) which is better than the 4 m found with our methods. In addition, bias of the three height classes is not constant, with our reference database, there is a bias to underestimate the class from 10-20 and a bias to overestimate in the classes 20-30 and above 30 m. A constant bias would be ideal to improve estimates. We expect tree height estimates close to 60 m to have more uncertainty. Compared with LiDAR, the main limitation of digital photogrammetry is that it cannot acquire structural information under canopy and produce a complementary DTM, the bias of the CHM is related to the quality of the DTM (Swinfield et al., 2019). One reason is the high costs of LiDAR technology, which may be too costly for smaller-scale research projects. The cost of conventional airborne LiDAR acquisitions remains high for researchers and other end-users, especially if high-spatial resolution is required over small areas or at high temporal frequencies. The latter represents a significant barrier for studies requiring frequent observations at numerous small sites or sampling plots (Dandois and Ellis, 2013). In addition, LiDAR by itself does not constitute an immediate solution to obtain certain attributes without imagery, such as species composition and phenology. Furthermore, there are additional data processing bottlenecks associated with the high volumes of data gathered in LiDAR campaigns, including filtering, classification, and archiving. There are two main advantages of UAV photogrammetric point clouds over airborne LiDAR point clouds, first, the lower cost, which is a main limitation in developing countries, second, the ability of AUVs to fly below the clouds in rain forests.
However, photogrammetry models based on passive sensors have some limitations when compared with small-foot-print LiDAR systems. This is because the numerous vegetation characteristics (leaf-area index, tree density, under-canopy structure, etc.) hinder sunlight from reaching all the forest strata, resulting in highly detailed information of the upper canopy but low detail of the forest floor due to poor illumination. Having low detail of the forest floor generates uncertainty in the DTM generation and thus in the CHM. This limitation must be present in the REDD+ program if trying to use allometric equations to determine AGB based on height.
The forest fragment analyzed in this study is located in the Biogeographic Chocó, which is a region of great ecological relevance due to the forest ecosystems present there (Gentry, 1986; Galeano et al., 1998; Myers et al., 2000). These ecosystems represent great potential for the subsistence of the communities that inhabit the area (Camacho and Díaz, 2018; Galeano, 2000), however, lack of information represents a limitation for the application of sustainable initiatives in the area, such as REDD+ projects. The only study related to the estimation of the vegetation height in the region, corresponds to the one developed by Meyer et al., (2019), which provides fundamental reference information for the analysis of forest ecosystems based on LiDAR data and field inventories. In this context, the temporal monitoring of forest ecosystems in the region has been limited. In this scenario, detailed analyzes at the local scale using VHR imagery derived from UAS's, such as the one developed in the present study, provide a fundamental complement to refine the detail of regional analyzes, allowing monitoring on small-scale projects (Dandois and Ellis, 2013). These kinds of studies provide not only an efficient alternative with regards to time and costs with a great level of detail, but also to obtain additional attributes of the forest such as species composition and phenology, thus complementing other observations such as satellite ones.
5. Conclusions
VHR imagery allows us to do detailed mapping over areas that are larger than traditional field plots. The objects in this study were defined as single trees instead of parcel plots, which is an important step in conservation programs, where deforestation is not occurring over large extensions but at the level of individual trees (i.e., selective logging, where the most valuable single trees are extracted). In addition, a UAS-based approach can enhance the modeling of carbon stocks at local scales. This would lead to more accurate scaling up to regional forest modeling efforts such as those commonly undertaken with remote sensing imagery of coarser spatial resolution and could help bridge the gap between above-ground biomass (AGB) field measurements and estimates from conventional remote sensing data. This is one of the challenges for monitoring forest degradation in programs such as REDD+.
UASs allow us to obtain VHR images from viewpoints below clouds, while maintaining low equipment and data processing, which is a major advantage in tropical countries. Although our interest focuses on crown delineation and tree height, other forest features can also be monitored, such as phenology, tree species, and health status.
In terms of tree height, the results may differ between forests because DTM quality depends on the canopy closure, which affects CHM accuracy. In this respect, fieldwork is important to define the height of reference trees and to locate canopy gaps and determine their extent. We suggest several campaigns to re-measure tree heights in order to improve reference data quality. It may be beneficial to analyze CHM correlation among different flight heights using both VHR images.
Optical systems such as UAS offer possibilities to fulfill the needs of forest inventories and can allow the detection of forest structural attributes such as dominant tree height and crown size. They also offer low-cost alternatives with respect to field-based assessment and airborne laser scanning systems or VHR satellite imagery (e.g., Worldview, IKONOS, QuickBird) for accurate extraction of the required forest information. In fact, due to low operation and maintenance cost, it is possible to acquire imagery far more frequently than conventional remote sensing technologies. This is very important for improving deforestation and degradation monitoring programs, as significant seasonal differences in tropical forest cannot be detected with single-date imagery.
The user must evaluate the tradeoff between the cost of a LiDAR sensor and the error involved with a UAS with a RGB sensor. With the methods detailed herein, we obtained an error between 3 and 4 meters within a 95% probability level. Although most previous work uses forest parameters derived from UAVs to estimate height or to delineate tree crowns (Lisein et al., 2013; Zarco-Tejada et al., 2014; Panagiotidis et al., 2016; Bonnet et al., 2017;), we found that assessing both parameters within the same project is useful to validate the results.
According to technical advantages identified, presented and discussed, the proposed UAS-based forest monitoring approach could be particularly attractive and useful to organizations involved in REDD+. This approach could prove especially useful in tropical regions, because of their ability to map and facilitate forest degradation-and-regrowth monitoring. In terms of monitoring, the next step to exploit the full potential of this type of data is to generate new models and to execute new UAV flights to evaluate the sensitivity of the models to fallen or harvested trees.

