


 Inglés (pdf)
 Articulo en XML
 Referencias del artículo
 Enviar articulo por email
 Citado por SciELO
  Citado por Google
  Similares en
SciELO
Similares en
SciELO  Similares en Google
 Permalink
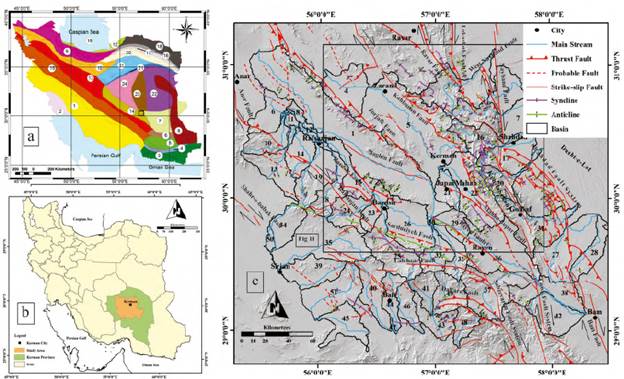
Figure 1 a) Physiographic-tectonic zoning map of Iran's sedimentary basins (Mosavi and Arian, 2015 modified from Arian et al., 2013). The study area is shown in the black rectangle. The numbers in this figure are, 1: Zagros-East Taurus hinterland, 2: Persian Gulf-Mesopotamian foreland basin, 3: Makran accretionary prism, 4: Bashagard Mountains, 5: Jazmorian-Mashkel forearc basin, 6: Shahsavaran-Soltan magmatic arc, 7: South Lut-South Helmand back-arc basin, 8: East Iran Mountain belt, 9: West-Central Alborz and lesser Caucasus hinterland, 10: Great Kavir-Northen Urmieh lake foreland basin, 11: South Great Kavir fold and thrust belt, 12: South Caspian-Black sea foreland basin, 13: Urmieh-Dokhtar Magmatic Arc, 14: Naien-Kerman retro arc foreland basin, 15: Sanandaj-Sirjan overthrust belts, 16: East Alborz or Binalod hinterland, 17: Torbat-e am-Neyshabour retro arc foreland basin, 18: Kopet Dagh hinterland, 19: South Caspian remnant basin, 20: Maiamay-Taibad Inverted back-arc basin, 21: Khaf-Kavir Plain Magmatic Arc, 22: Lut Plain-Gonabad back-arc basin, 23: Tabas hinterland, 24: Yazd-Khour Piggyback basin. b) The location of the study area. c) Structural map of the study area and 51 basins on a Shaded-relief topographic base. Faults in this article are from Rashidi et al., (2017), Fattahi et al., (2011), Walker et al., (2010), Walker (2006), Hessami, and Jamali (2006), and geological maps of the region (e.g. GSI 1992a and1992b).
Introduction
The sensitivity of the drainage pattern to active tectonic processes such as faulting, folding, uplifting, and tilting which lead to geomorphic expression (i.e. river incision, basin asymmetry, drainage geometry, etc.) provide a useful tool to evaluate relative tectonic activity (Cox, 1994). The study of active tectonics, particularly in the areas with high activity in the Holocene and late Pleistocene, is important to evaluate the earthquake hazard (Keller and Pinter, 2002). The most useful tools to study active tectonics are geomorphic indices (e.g. Bull and McFadden, 1977; Keller and Pinter, 2002; Silva et al., 2003). Morphometric analysis has been previously tested as a valuable tool by various studies conducted in different tectonically active areas around the world and is established as a proven technique to understand the development of geomorphic features and to assess the seismic hazard (e.g. Cox, 1994; Keller and Pinter, 2002; Silva et al., 2003; El Hamdouni et al., 2008; Perez-Pena et al., 2009, 2010; Font et al., 2010; Sharma et al., 2017). The average of geomorphic indices such as stream length-gradient index (SL), drainage basin asymmetry (Af), hypsometric integral (Hi), the ratio of valley-floor width to valley height (Vf), index of drainage basin shape (Bs), index of mountain front sinuosity (Smf) and Transverse Topographic Symmetry Factor (T) (e.g. Keller and Pinter, 2002) is used to evaluate the distribution of relative tectonic activity (Iat) (El Hamdouni et al., 2008).
The main characteristic of this part of central Iran, where Kerman city is located, is the presence of major strike-slip faults that are produced in response to the shortening component induce by Arabian-Eurasia convergence. These strike-slip faults accommodate the shortening either by spatial partitioning of dip-slip and strike-slip components and through a combination of strike-slip faulting and vertical axis rotation, which are the properties of such regions (e.g. Allen et al., 2006). One of the most obvious features of these faults is the releasing and restraining bends with their accompanies structures such as pull-apart basins and flower structures. This ongoing process has caused lots of geomorphological expressions (e.g. cutting Pleistocene-Holocene alluvial fans and Neogene marls, Incision of Streams and gullies within alluvial fans) and so many destructive earthquakes around the city of Kerman.
The dominant age of outcrops in the study area are Mesozoic and early Tertiary (GSI 1992a and 1992b). Cretaceous limestone which is unconformably covered by a continuous sequence of sediments from Miocene to Quaternary made the heights around Kerman (e.g. Huckriede et al., 1962).
The study area is Kerman city (Fig. 1) which is one of the metropolises of Iran and the capital of the same-name province. The city of Kerman is located in a place known as one of the most seismic regions in Iran that is most likely to experience a devastating earthquake at any given moment, due to the occurrence of numerous historical (e.g. the 1854 Shahdad and the 1864 Chatrud) and instrumental (e.g. the Mw 7.2 Gowk (1981) and the Mw 6.4 Dahuiyeh (2005)) earthquakes in its surrounding area (Shahpasand-Zadeh and Heydari, 1996). Although Kerman city was shaken by recent earthquakes that happened in its surrounding area, it has not experienced severe damage (e.g. Walker et al., 2010). In such circumstances, the use of morphotectonic information can be helpful to find covered or unknown trends in this region.
Studies using morphometric parameters to characterize the relative influence of tectonic activity and to assess seismic hazard were conducted in various tectonically active areas such as NW Iran (Saber et al., 2018), India (Sharma et al., 2017), SE Spain (Perez-Pena et al., 2010), NW France (Font et al., 2010), and SW Sierra Nevada of Spain (El Hamdouni et al., 2008). Also, many seismotectonic and structural studies were conducted by other workers (e.g. Walker and Jakson, 2004; Walker, 2006; Walker et al., 2010) in and around the city of Kerman, but none of them used morphological parameters to assess the seismic hazard.
In this contribution, we used seven geomorphic indices together with the seismicity to characterize tectonic activity in this study region including drainage basin asymmetry (Af), hypsometric integral (Hi), index of drainage basin shape (Bs), the ratio of valley-floor width to valley height (Vf), index of mountain front sinuosity (Smf), stream length-gradient index (SL), and Transverse Topographic Symmetry Factor (T). These indices were calculated for 51 basins of the study area, using a digital elevation model (30 m DEM resolution) and geological maps (at 1:250000 and 1:100000 scales) in a GIS environment. Then the relative tectonic activity index (Iat) was derived from the average of them, which was categorized into three classes based on El Hamdouni et al., (2008) classification. Further, the seismicity data of magnitude greater than Mw 4.0 was plotted to cross-check their relationship with the tectonic activity of the region (Sharma et al., 2017). Earthquake epicenters are from the catalog of Mousavi et al (2014) for the period of 4th century B.C. through 2012 and the earthquakes between 2012 and 2019 are from IIEES1 and ISC2. Finally, we discuss these findings in the context of the seismic hazard assessment by identifying faults with that potential in the city of Kerman which is the objective of this paper.
Study area
According to the Physiographic-tectonic zoning of the sedimentary basins of Iran, Kerman is a part of the Naien-Kerman retro-arc foreland basin (Arian, 2013) (Number 14 in Fig. 1a). It contains a retro-arc foreland basin on the north margin of the Urmieh-Dokhtar magmatic arc. According to the seismotectonic-geologic hazards zoning of Iran (Arian, 2015), Kerman city is a part of Tabas-Minab province. The Tabas-Minab province is characterized by earthquakes with moderate to high magnitude, with low frequency, long repeat time, down to 15 km focal depth. Furthermore, the earthquakes of this province are of high-level intensity and show southward migration.
Most of the outcrops in the study area are Mesozoic and early Tertiary in age (GSI 1992a and 1992b). The mountains around Kerman are mainly Cretaceous limestone which is unconformably covered by a continuous sequence of sediments from Miocene (Conglomerate) to Quaternary (alluvium and Silty clay pans) beneath Kerman plain (e.g. Huckriede et al., 1962).
Active tectonics
The active tectonics of Iran is mainly affected by the northward convergence of the Arabian and Eurasian plates. The rate of this convergence relative to Eurasia is estimated at around ~25 mm/yr at longitude 58°E (Vernant et al., 2004). Northward moving of Central Iran with respect to western Afghanistan at a rate of 6-13 mm/yr, obtained from GPS study (Walpersdorf et al., 2014), produces N-S, right-lateral, shear across eastern Iran. This shear is accommodated on large, active N-NW trending, right-lateral strike-slip faults which slice eastern Iran (e.g., Berberian, 1981; Walker and Jackson, 2004; Meyer and Le Dortz, 2007; Walker et al., 2009; Allen et al., 2011). Walpersdorf et al., (2014) showed that these faults get additional NS shortening by rotating counterclockwise in the horizontal plane, at a rate of 1 ± 0.4°/Ma.
Main faults
Due to the arid and sparsely vegetated environment of southeastern Iran, the Quaternary activity of the faults and their related structures are well exposed. The faults in this region are either oblique-slip or strike-slip. The oblique-slip faults have both senses of motion i.e. dip-slip and strike-slip. The activity of the strike-slip fault systems has developed horsetail splay at the tips of the faults, releasing and restraining bends, which are accompanied by structures such as pull-apart basin and flower structure (Rashidi et al., 2017).
Major strike-slip fault systems in the study area (Fig. 1c) can be categorized based on their strike into N-S (Nayband, Gowk, and Sabzevaran), NW-SE (Jorjafk, Kuhbanan, Ravar, Mahan, and Rayen), and E-W (Lalehzar) directions. The NW-SE and E-W faults link the right-lateral N-S faults with other active faults in central Iran and distribute the right-lateral shear in this region (Rashidi et al., 2017).
Nayband fault system
The 300 km long Nayband right-lateral fault system with NS trending, extends along the western margin of the Lut block. Based on the main structural discontinuities, five right-stepping en-echelon pattern segments have been identified along this fault (Foroutan et al., 2014). The 40 km long West Nayband fault is considered as a branch of the Nayband fault system that has right-lateral and revers movement (Rashidi et al., 2017). Despite showing a clear expression in the geomorphology along most of its length the Nayband fault is the only part of the western Lut border that has been seismically quiescent during the last few millennia (e.g. Ambraseys and Melville, 1982). The slip rate of 1.8 ± 0.7 mm/yr is estimated for Nayband fault.
Sabzevaran fault system
The N-trending Sabzevaran fault is a strike-slip fault with a small but significant reverse component that has an almost vertical fault plane (i.e. about 80°W) (Regard et al., 2004). The Sabzevaran fault consists of several en-echelon segments with a right-step arrangement. Despite the evidence of high-level tectonic activity and the high slip rate, 5.7 ± 1.7 mm/yr (Regard et al., 2005), there is no known destructive earthquake associated with the Sabzevaran fault. There are some minor faults at the northern tip of the Sabzevaran fault that are considered as its splays; such as the Sardueiyeh fault (around 100 km long fault that cuts Quaternary units in a reverse mechanism and still no earthquake-related deformation has found along it), Lalehzar fault (an active 85 km long right-lateral the strike-slip fault with some recorded earthquakes e.g. 1923/09/22 and 2010/07/31), Dalfard fault (a right-lateral strike-slip fault with reverse component), etc. It seems that shearing and thrusting of the recent rock units and alluvial fans along these faults are caused by the right-lateral strike-slip motion along the Sabzevaran fault (Rashidi et al., 2017).
Gowk fault system
The Gowk fault is an NNW right-lateral strike-slip fault that extends for 160-200 km along strike (Berberian et al., 2001). It is a fault system that consists of segments in an en-echelon pattern and is one part of the Sabzevaran-Gowk-Nayband system of strike-slip faults (Walker et al., 2010) which bounds the western edge of the Dasht-e-Lut desert (Berberian et al., 2001). Pull apart basins with faulted boundaries (e.g. chaharfarsakh) have been generated along the Gowk fault system. By having a proven record of generating destructive earthquakes, (e.g. 1981.06.11 Mw 6.6; 1981.07.28 Mw 7.1; 1989.11.20 Mw 5.8; 1998.03.14 Mw 5.4 and 1998.11.18 Mw 6.6), this fault is one of the most active faults of Iran (e.g. Berberian et al., 2001). The current slip rate on the Gowk fault is estimated at 4.2 ± 0.7 mm/yr (Walpersdorf et al., 2014).
Shahdad thrust and fold system
The Shahdad thrust and fold system is a curved NW trending along the East of the Gowk fault. Since the Gowk fault orientation is oblique to the NS right-lateral shear across eastern Iran, the overall motion is partitioned into strike-slip faulting along the Gowk fault and shortening on the Shahdad thrust and fold system (Berberian et al., 2001). Unlike the Gowk fault that is associated with earthquakes since at least 1877, the Shahdad fault has no historical seismic record for the past millennia (Berberian et al., 2001).
Kuhbanan fault system
The Kuhbanan fault is an active 300-km long, NW-SE-trending, right-lateral strike-slip fault, which consists of several en-echelon segments (Berberian, 2014). The evidence shows that the sense of motion on the Kuhbanan fault may have changed from reverse to right-lateral slip through time (e.g. Berberian, 2014). The Kuhbanan fault currently slips laterally at 3.6 ± 1.3 mm/yr (Walpersdorf et al., 2014). Although this fault has a long record of earthquakes (e.g. 1875, 1933 and 1977, Ambraseys and Melville, 1982), the largest earthquakes in the current cluster may not have yet occurred, due to the absence of a large-magnitude earthquake during the last 160 years of recorded seismic history along the Kuhbanan fault (Berberian, 2005). Also, the GPS measurements imply that the fault is presently active and possibly slipping faster than over the Holocene and geological times. Berberian (2005) believes that all the faults in the southern tip of the kuhbanan fault (e.g. Dahuyiyeh, Chatrud, Bazargan, Dehbala, and East Kerman), are splay intermountain, cross-reverse faults which are developed at almost a right angle. Slip that is transferred from the Gowk fault to the Kuhbanan fault through the restraining bend between them, produces a wide zone of mountainous. Occurring of an NW-SE trend right-lateral strike-slip faulting within this zone (Dehu and Dehran faults) forms a flower structure in cross-section.
Rafsanjan fault
The Rafsanjan fault is an NW-SE-trending, right-lateral strike-slip fault ~200 km long. This fault is one of the major faults of southeast Iran, which shows a clear expression in the geomorphology along most of its length (e.g. Walker, 2006). Maybe it transfers an amount of the Sabzevaran fault right-lateral slip to the Anar fault. The overall NS right-lateral shearing across the region is accommodated by almost pure strike-slip on the Rafsanjan fault in the high, mountainous, regions and shortening component migrates to a series of parallel thrust faults in the plains north of the main Rafsanjan fault trace (e.g., Walker, 2006 and Walker et al., 2010). An average slip rate of ~0.4 mm/yr is estimated for this fault (Fattahi et al., 2011).
Jorjafk fault
The ~200-km-long Jorjafk fault with an NW-SE trending consists of five active main en-echelon segments (Rashidi et al., 2017). Although there is no record of historical seismicity, this fault shows clear signs of activity in the late Quaternary (Walker et al., 2010). The overall motion on this fault seems to be oblique reverse and right-lateral. The dip-slip component migrates onto reverse faults in the adjacent lowlands whereas the strike-slip movement continues to occur along the main fault in the high land. (Walker et al., 2010).
Ravar Fault
The Ravar fault is a right-lateral strike-slip with 150 km long. The Ravar fault consists of two main left stepping en- echelon pattern segments. Folds with different geometries can be seen throughout the Ravar fault, showing the presence of a reverse component. Flower structures were formed in the convergence zone between Lakarkuh and Ravar faults (at their southern tips). The river offsets are recognizable along it (Rashidi et al., 2017). Based on the horizontal slip rate of 0.54 mm/yr, the recurrence interval of an Mw 6.7 earthquake on the Ravar fault is estimated to be about 1400 years (Shafiei Bafti and Shahpasanzadeh, 2010).
Rayen fault
Rayen fault is an NW-SE trending fault that shows a reverse component of motion in addition to its dominant strike-slip mechanism (Rashidi et al., 2017). There are a series of the NW-SE-trending folds along this fault that show signs of activity such as the truncation of the northern fold limb and the discrete northward-facing scarps developed in alluvial fans crossing the northern fold margin. This indicates the presence of underlying thrust faults that caused active folding in this region (Walker, 2006).
Lakar Kuh fault
The N-S trending Lakar Kuh is a right-lateral strike-slip fault with a small reverse component. Its total length is reported to be about 130 km. Horsetail splays that formed at the northern and southern tips of this fault show a reverse mechanism with a small right-lateral strike-slip component. It is believed that the southern splay is the location of three events on 1 and 12 December 2017 with MN magnitudes of 6.0-6.1 (Nemati et al., 2020).
Mahan fault-related folds
The NW-SE trending folds along the northern margin of the Kuh-e-Jupar which are situated close to the town of Mahan and extend northwards to beyond the village of Jupar, are considered as the Mahan fault-related folds. The geomorphic evidence such as the asymmetric pattern of river incision and height changes across the folds shows active folding in Mahan. In other words, these folds are underlain by active blind thrust faults that do not reach the Earth's surface (Walker, 2006 and Walker et al., 2010). A historical earthquake on 2nd January 1934 occurred in the district of Mahan which damaged villages along the Kuh-e-Sekonj range-front to the southeast of Mahan (e.g. Berberian, 2005). Mahan and Jorjafk faults are likely to be related due to the geometrical similarities and aligning along the same strike (Walker, 2006 and Walker et al., 2010).
Bafgh-Baghin fault system
The 170 km Bafgh-Baghin fault system is located along the Bafgh-Baghin mountain. This fault system with the NW-SE trend consists of eight segments. This is a right-lateral strike-slip fault with a small reverse component. There is no historical record of an earthquake in this area but the instrumental earthquakes with small to medium magnitude have been recorded at the depth of about 10 to 15 km (Sistanipour et al., 2012).
Rafsanjan-Zarand fault system
It is a left lateral NE-SW trending fault that is extended from NW of Zarand city to SW of Rafsanjan city. This fault is created as a result of right-lateral strike-slip motion on the Bafgh-Baghin fault system in the SW and on the Kuhbanan fault system in the NE. Sistanipour et al., (2012) believe it is likely to have more intense earthquakes in this area especially at the intersection of Rafsanjan-Zarand and Bafgh-Baghin fault systems, in the future.
Zangi Abad-Kerman fault
It is a 30 km long fault that is situated close to the town of Zangi Abad and extends southwards to the city of Kerman which is considered as a probable fault on the geological map of Rafsanjan (GSI, 1992b). Hasanzadeh et al., (2011), who have identified this fault, have not found any evidence of Quaternary activity of this fault, i.e. deformation and incision of Quaternary sediments, the geometry of alluvial fans and rivers. Since this fault extends to the city of Kerman and is located along the active fault of Kuhbanan, it should be considered in assessing the seismic hazard of Kerman city (Hasanzadeh et al., 2011).
Materials and Methods
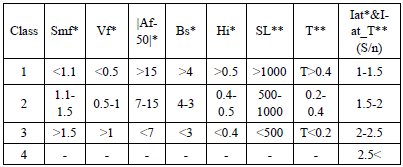
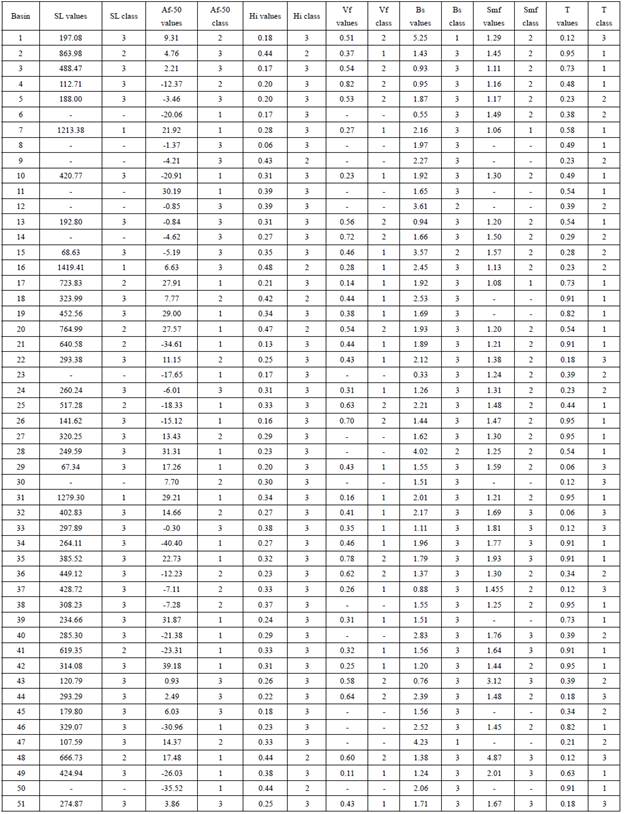
The hydrological modeling process was done in the study area by Arc GIS 10.3 software. 30 m resolution Digital Elevation Model (DEM) and geological maps, four geological maps of Iran at 1: 250,000 Scale (i.e. Kerman, Bam, Rafsanjan, and Sirjan) and at least twenty four geological maps of Iran at 1: 100,000 Scale (e.g. Kerman, Gowk, Rayen, etc.) were used as basic data, to obtain the drainage network layer, basins area, and water dividing layer. The study area was divided into 51 basins and seven geomorphic indices were assessed including stream length-gradient index (SL), drainage basin asymmetry (Af), hypsometric integral (Hi), the ratio of valley-floor width to valley height (Vf), index of drainage basin shape (Bs), index of mountain front sinuosity (Smf), and Transverse Topographic Symmetry Factor (T). Then, the results were classified into three classes based on the El Hamdouni et al., (2008) classification (except for SL index and T factor (Mosavi and Arian, 2015)) (Table 1). After that, for each basin, two kinds of relative tectonic activity index (Iat) was obtained by the average of the different classes of geomorphic indices (S/n) (El Hamdouni et al., 2008); Results from the analysis of all the 7 geomorphic indices (Af, Hi, SL, Smf, Vf, Bs, and T) are accumulated and expressed as Iat_T index, but the T factor was not considered in the Iat index calculation (Table 1). The study area was classified into three classes (including high (class 2), moderate (class 3), and low (class 4) tectonic activity) according to the Iat and Iat_T values. All the calculated results have been shown in table 2. Finally, to identify faults with seismic hazard potential to the city of Kerman, which is the aim of this paper, the plotted earthquake epicenters of the study area were being compared with the morphometric analysis derived from GIS.
Table 1 The geomorphic indices classifications were used in this study. * El Hamdouni et al., (2008). ** Mosavi and Arian (2015).
Geomorphic indices of active tectonics
Asymmetric factor (Af)
The drainage basin asymmetry factor is a way to measure the tectonic tilting of catchments and is defined as follows (e.g. Keller and Pinter, 2002):
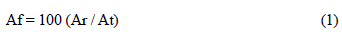
where Ar displays the basin area on the right side of the stream and At indicates the total area of the drainage basin. When a basin is developed under stable conditions with little or no tilting, Af approaches 50, whereas values of more or less than 50 would be considered as the asymmetry of a basin caused by active tectonic (Keller and Pinter, 2002).
Hypsometric integral index (Hi)
This index reveals complex interactions between erosion and tectonics by indicating the volume of a basin which has not been eroded (El Hamdouni et al., 2008). The distribution of elevation is defined by the hypsometric curve and the area below the curve is defined as the hypsometric integral (Strahler, 1952). It is calculated as follows (e.g. Keller and Pinter, 2002):
Hi = (average elevation - min. elevation) / (max. elevation - min. elevation)) (2)
The maximum and minimum altitude is directly extracted from the topographic map and the average altitude is calculated from the average value of at least 50 scattered heights in the basin (Pike and Wilson, 1971) or is obtained through the analysis of the Digital Elevation Model (DEM). The analysis of the Hi index includes two sections: the hypsometric curve and the integral. The shape of the hypsometric curves is related to the erosional stage. young landforms are characterized by high Hi values and convex curves. old landforms have low Hi values and are associated with S-shaped curves. Intermediate Hi values demonstrate mature landscapes (Keller and Pinter, 2002; Pérez-Peña et al., 2009).
Valley floor width-valley height ratio (Vf)
The Vf index is defined as the ratio of the width of the valley floor to its average height (e.g. Bull and McFadden, 1977) and it is calculated as follows:

where Vfw represents the width of the valley, Eld and Erd demonstrate the height of the right and left sides, respectively and Esc shows the height of the valley floor. This index indicates the difference between V-shape valleys, that with the low Vf values represent tectonically uplifted areas, and U-shape valleys which have high Vf values represent the dominance of the erosional processes (e.g. Bull and McFadden, 1977). The Vf and Smf indices are so helpful to demonstrate the relationship between faulting and morphology in an area (Silva et al., 2003).
Basin shape index (Bs)
The relatively young drainage basins in the active tectonic areas tend to be elongated perpendicular to the topographic slope of a mountain. Because of tectonic activity reduction, the elongated shape of the basin gradually transforms into a circular shape (Bull and McFadden, 1977). The basin shape is converted into a quantitative index by using the elongation ratio which is computed by (e.g. Ramirez-Herrera, 1998):
Bs = Bl / Bw (4)
where Bl indicates the length of the basin from the headwaters to the mouth and Bw represents the basin width. basins with high tectonic activity have high values of the Bs indices and indicate elongated drainage, whereas low tectonic activity basins are characterized by low Bs values and a circular shape (El Hamdouni et al., 2008).
Mountain front sinuosity index (Smf)
This index represents the balance between erosion forces, which tend to create irregular mountain front, and tectonic activities, which tend to create straight mountain fronts. The Mountain front sinuosity index is defined by equation 5 (e.g. Bull and Fadden, 1977):
Smf = Lmf / Ls (5)
where Lmf denotes the mountain front length along the connection of mountain and plain, and Ls is the straight-line length of the mountain front (Bull and Fadden, 1977). Active mountain fronts have a straight front with low Smf values (Smf < 1.1); whereas inactive mountain fronts, due to adapting by erosive processes have irregular or sinuous fronts with high Smf values (Smf < 1.5) (Keller and Pinter, 2002; Silva et al., 2003; Bull, 2007; El Hamdouni et al., 2008; Pérez-Peña et al., 2010).
The Stream length-gradient index (SL)
This index was first used to identify the recent tectonic activity by Hack (1973). It evaluates the relative tectonic activity by concerning the relationships between rock resistance and topography along the drainage basin (Hack, 1973). This index is calculated as follows:
SL = (ΔH / ΔL) L (6)
where ΔH/ΔL represents the gradient of the stream, and L displays the total lengthofthechannelfromupstreamtothemidpointofthechannelreachesforwhich the index is calculated (Hack, 1973). The SL index is sensitive to sudden change along the stream profile, this anomalous change may indicate a tectonic uplift or sudden lithological change. The anomalously high Sl values for low resistance rocks show tectonic activity (Keller and Pinter, 2002).
Transverse Topographic Symmetry Factor (T)
This index is appropriate for assessing drainage basin asymmetry. The changes in the tilting rate in different zones of an area demonstrate the difference in the uplifting rate. This index is obtained by the following equation:
T = Da / Dd (7)
where Da denotes the distance from the midline of the drainage basin to the midline of the active meander belt, and Dd indicates the distance from the midline to the basin divide (Cox, 1994). The T factor is a vector that has direction and magnitude ranging from zero to one. T value equals zero for a complete symmetric basin and as the asymmetry of the basin increases, the T value rises and approaches 1. (Cox, 1994; Keller and Pinter, 2002).
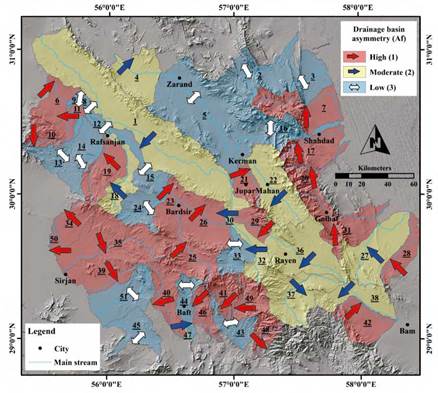
Figure 2 Distribution of the Af index in the Study area, |Af-50| > 15 (class 1), 7 < |Af-50| < 15 (class 2), |Af-50| < 7 (class 3) (El Hamdouni et al., 2008)
Results of Geomorphic indices analysis
Asymmetric factor (Af)
The asymmetry factor (Af) values were computed using DEM in a GIS environment. This index has been calculated as |Af-50|, which is the amount of difference between the observed value and the neutral value of 50 (El Hamdouni et al., 2008). The calculated | Af-50| values in the study area vary between the range from 0.3 to 40.4. Figure 2 illustrates the distribution map of the Af index. According to El Hamdouni et al., (2008) classification, the calculated |Af-50| values along the study area have been categorized into 3 classes: Class 1 (|Af-50| >15); Class 2 (7 < |Af-50| < 15) and Class 3 (|Af-50|< 7) (Table 1). Class 1 which represents high tilting includes more basins than the other two classes, i.e., 24 out of 51 basins (Table 2). Af values of 11 basins belong to class 2 and 16 basins to class 3. Thus, most of the drainage basins are asymmetric in this study area. Basin No.33 has the lowest Af value (|Af-50|=0.3) and the highest Af value (|Af-50|=40.4) belongs to basin No.34 (Table 2). The three classes of Af index have scattered across the study area and most of the tilting is related to the active tectonic. For instance, evaluating the Af values indicates a dominant NNW tilting along drainage basins in the west of the study area which is the location of the major faults of eastern Iran, such as Gowk and Nayband faults, and the earthquake epicenters concentration (mostly destructive earthquakes with MW>5).
Hypsometric integral index (Hi)
By using DEM in a GIS environment, the Hi values were calculated. The Hi values which range from 0.06 to 0.48 are classified into two classes: Class 2 (0.4<Hi<0.5) and class3 (Hi<0.4) (Table 1). Figure 3b displays the distribution of the Hi index in the study area. Basins No. 2, 9, 16, 18, 20, 48, and 50 fall into the intermediate range of Hi value (Table 2) and display an S-shaped hypsometric curve (Fig.3a). So, these basins are considered as the mature stage of the Davis erosion cycle. The 44 other basins with a low range of Hi values (Table 2) and concave hypsometric curves (Fig.3a) demonstrate the old stage of the Davis erosion cycle (Davis, 1899; Keller and Pinter, 2002; Pérez-Peña et al., 2009).
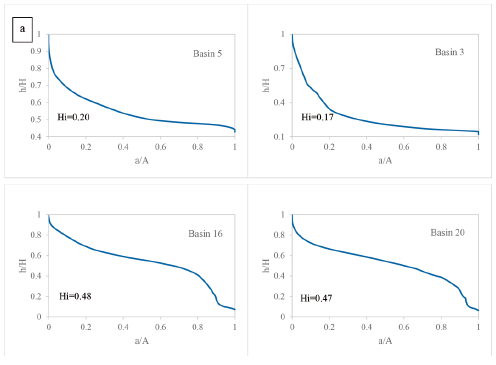
Figure 3a Hypsometry curves of 4 basins with their calculated Hi. Basins No. 16 and 20 with the moderate value of Hi (class 2) show an S-shaped hypsometric curve. Basins No. 3 and 5 with the low value of Hi (class 3) show concave hypsometric curves. (A) is the total surface of the basin. (a) is the surface area within the basin above a given elevation h. (H) is the highest elevation of the basin.
Valley floor width-valley height ratio (Vf)
The parameters of Vf (Vfw, Eld, Erd, Esc) were measured for main valleys that cross mountain fronts using cross-sections drawn from a DEM-derived contour map in the GIS environment. The Vf values were calculated for as many as valleys that were possible, 300 m upstream from the mountain front. The mean of the Vf values is determined as the Vf index which ranges between 0.11 and 0.82 in the study area. According to this index calculation (Table 2), 22 basins are classified into class 1 (Vf < 0.5) which represent the deep V-shape valleys and are usually accompanied by tectonic uplift. 14 basins are categorized in class 2 (0.5 < Vf < 1). This index was not calculated for 15 basins due to the lack of appropriate conditions. These results in addition to the absence of class 3, imply that the values of Vf are relatively high for most of the study area. This activity is mainly caused by faults such as Gowk (in basin No. 16, 17, 22, 31, and 42), Nayband, Ravar, and Lakarkuh (in basin No. 2, 7, 16, and 17), Rafsanjan (in basin No. 10, 15, 18, 19, and 24), Mahan-Jupar (in basin No. 19, 21, and 22) the northern tip of Sabzevaran (in basin No.32, 33, 37, 41, and 49), and the southern tip of Kuhbanan (in basin No. 16, 17, and 22). The distribution of the Vf index and locations where calculations of the index are made are shown in figure 4.
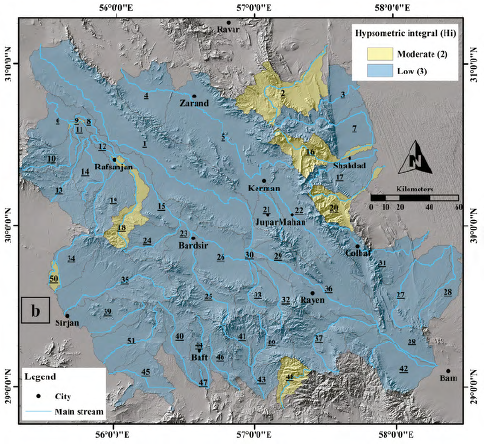
Figure 3b Distribution of the Hi index in the study area, Hi > 0.5 (class 1), 0.4 < Hi < 0.5 (class 2), Hi < 0.4 (class 3) (El Hamdouni et al., 2008)
Basin shape index (Bs)
Bs index was computed using DEM in the GIS environment. According to the Bs index results, which vary between 0.33 and 5.25 (Table 2), most of the basins (46 out of 51) have low Bs values (class 3 Bs < 3) which is the characteristic of circular basins with low tectonic activity (El Hamdouni et al., 2008). Basins No. 12, 15, and 28 with a medium value of Bs belong to class 2 (3 < Bs < 4). Basins No. 1 and 47 with a high value of Bs are placed in class 1 (Bs > 4), in other words, these are basins with more elongation and relatively higher tectonic activity (El Hamdouni et al., 2008). The distribution of the Bs index for the study area is plotted in figure 5.
Mountain front sinuosity index (Smf)
In each basin, Lmf and Ls values are measured from a DEM-derived shaded-relief topographic map in a GIS environment. The Smf values were measured for proper prominent mountain fronts in each basin. The average of obtained Smf values is determined as the Smf index. Figure 6 displays the distribution of the calculated Smf values for the 51basins in the study area (Table 2). These values vary from 1.06 to 3.12. The basins No.7 and 17, which are in the NE of the study area, are categorized in class 1 (Smf <1.1). These basins indicate the straight state of mountain fronts which specify high active tectonic and uplifting (Bull, 2007). Such high Smf values were expected for these two basins since important faults such as Nayband, Gowk, and Shahdad pass across them (Fig. 1b and Fig. 10a and b). Most of the basins (28 basins) are classified into class 2 (1.1<Smf<1.5). All ten basins of class 3 (Smf >1.5) are mainly located in the SW of the study area. Due to the lack of appropriate conditions, this index was not calculated for 11 basins.
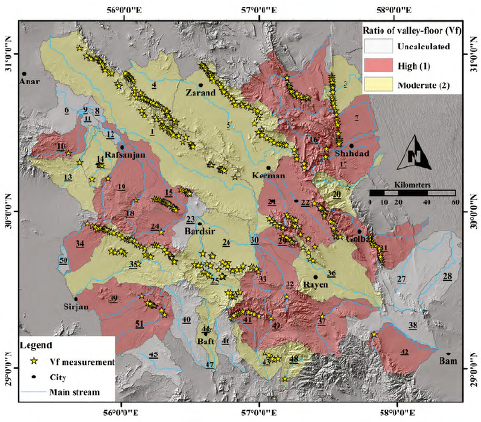
Figure 4 Distribution of the Vf index in the study area, Vf < 0.5 (class 1), 0.5 < Vf < 1 (class 2), Vf >1 (class 3) (El Hamdouni et al., 2008)
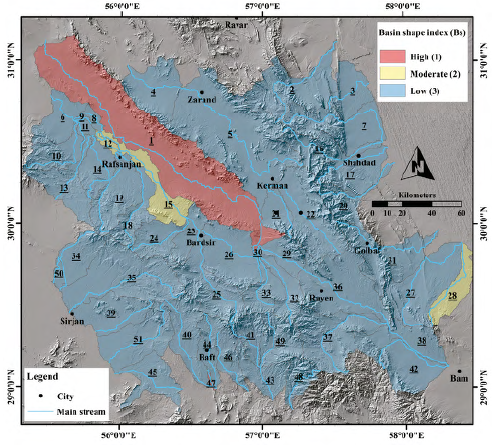
Figure 5 Distribution of the Bs index in the study area, Bs > 4 (class 1), 3 < Bs < 4 (class 2), Bs < 3 (class 3) (El Hamdouni et al., 2008)
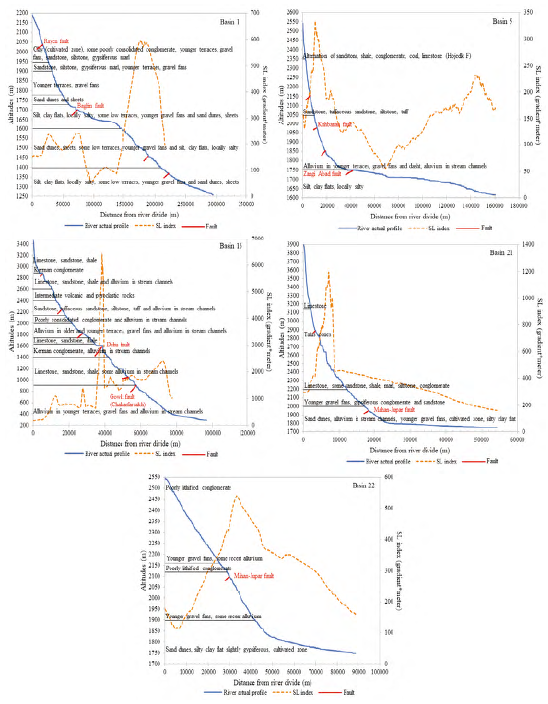
The Stream length-gradient index (SL)
The SL values were computed using DEM (30 m resolution) and a DEM-derived contour map, for every 100 m in the GIS environment. Elevation difference, distance along the main drainage of the study area, and total distance from the source were determined in the GIS environment. Using a methodology defined by Hack (1973), the SL index was calculated with the obtained inputs. The SL values have been categorized according to Mosavi and Arian's (2015) classification: class 1 (SL>1000), class 2 (500<SL<1000), and class 3 (SL<500). The SL values range from 67.34 to 1419.42. The longitudinal river profile and SL index were analyzed to reveal that basins No. 7, 16, and 31 are placed in class 1, 7 basins in class 2, and 32 basins in class 3 (Table 2). This index was not calculated for 9 basins due to the lack of appropriate conditions.
SL values along the channel were plotted on the map of rock strength levels and shown in figure 7a. The Contour lines and distribution of the SL index are displayed in figures 7b and 7c respectively. Also, the longitudinal river profiles were drawn for each basin, some of which are shown in Figure 8. Most of the recognizable SL anomalies are related to active tectonic.
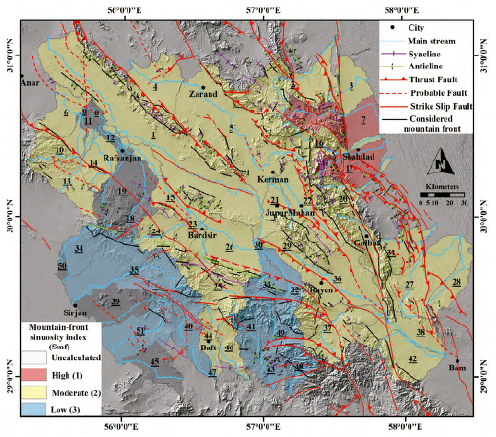
Figure 6 Distribution of the Smf index in the study area in addition to the mountain front and geological structures of the study area. Smf < 1.1 (class 1), 1.1 < Smf < 1.5 (class 2), Smf > 1.5 (class 3) (El Hamdouni et al., 2008).
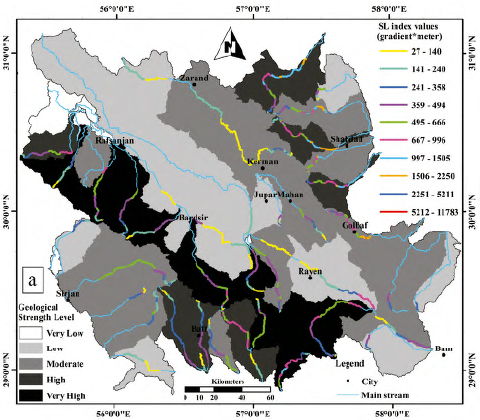
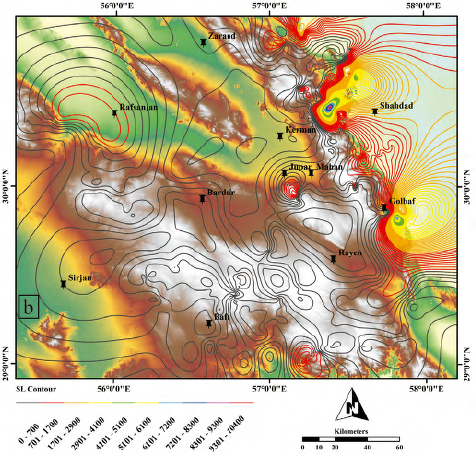
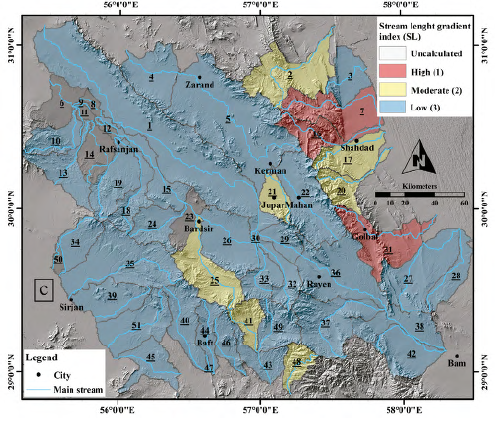
Figure 7c Distribution of the stream-length gradient (SL) index in the study area, SL > 500 (class 1), 300 < SL< 500 (class 2), SL < 300 (class 3) (El Hamdouni et al., 2008).
Transverse Topographic Symmetry Factor (T)
Using DEM (30 m resolution) in GIS environment values for Da and Dd were obtained. Then according to the Cox (1994) equation, the initial values of the T factor were calculated. After that, Tectonics FP software was used for statistical analysis of the T factor. Finally, the mean T values were computed for each basin and were shown as a vector in which its direction displays the tilting direction and its magnitude is T factor (Fig. 9a).
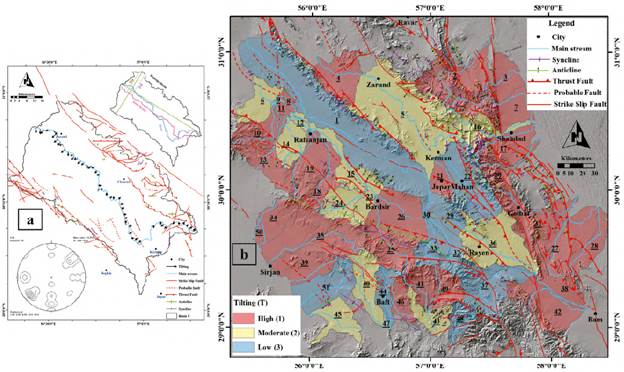
Figure 9 a) Steps to calculate the tilting index of basin No. 5 in the study area. Asymmetric vectors and polar representation of asymmetric vectors. the center of the net shows zero tiltings and its perimeter 1. b) Distribution of the tilting index (T) in the study area with the geological structures of the study area. 1 > T > 0.4 (class 1), 0.2 < T < 0.4 (class 2), 0 < T < 0.2 (class 3) (Mosavi and Arian, 2015).
Based on the results (Table 2), the lowest value of T (0.06) belongs to basins No.29 and 32. Basins No.2, 26, 27, 31, 38, and 42 have the highest T value (0.95). The results have been grouped into 3 categories: class 1 (T>0.4), class 2 (0.2<T<0.4), and class 3 (T<0.2) (Mosavi and Arian, 2015). The T distribution map, shown in figure 9b, indicates that most basins (27 out of 51) have high tilting and are categorized in class 1 (Table 2). Class 2 and class 3 include 14 and 10 basins respectively (Table 2).
Discussion and Conclusions
Morphotectonic analysis carried out by GIS techniques, use geomorphic indices to evaluate the effects of active tectonics in a region. This is particularly valuable in Kerman city where still has not experienced a devastating earthquake, despite being surrounded by major active faults. We used seven geomorphic indices: drainage basin asymmetry (Af), hypsometric integral (Hi), index of drainage basin shape (Bs), the ratio of valley-floor width to valley height (Vf), index of mountain front sinuosity (Smf), stream length-gradient index (SL), and Transverse Topographic Symmetry Factor (T). Then all the index values were categorized into three classes. Finally based upon an index, proposed by El Hamdouni et al., (2008), (Iat) the tectonic activity in the study area was evaluated. As mentioned before two kinds of relative tectonic activity index (Iat and Iat_T) were calculated for the study area (Table 3); considering the concentration of earthquake epicenters and the active geological structures, clarified that implementing the T factor in the Iat classification increases the accuracy of the relative tectonic activity assessment.
Table 3 The classification of the Iat, Iat_T, and T in terms of High (H), Moderate (M), and Low (L) tectonic activity; in addition to the main structures and the dominant types of fault for each basin in the study area. * Due to the lack of known structures, a suggestion was made according to the hypothesis of this paper.

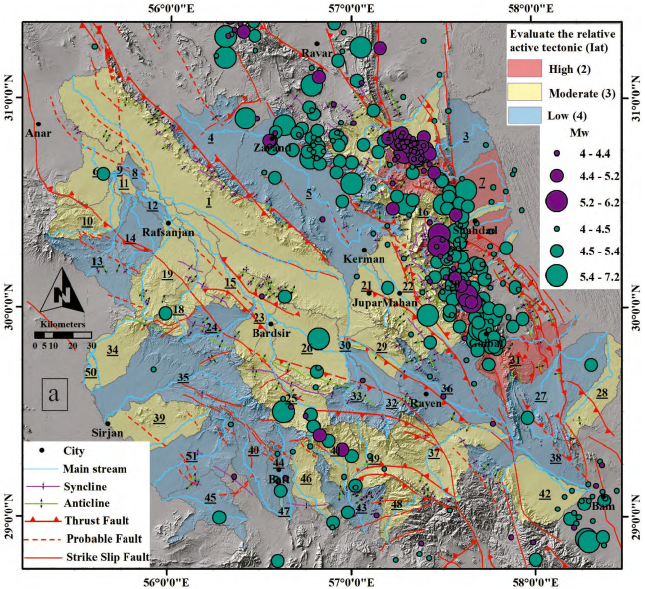
Based on the values of the Iat and the Iat_T, the study area is divided into three categories and the relative tectonic activity zoning map was prepared (Fig. 10a and b). The high percentage of the basins (55%-65% of the total study area) are in class 3 (moderate tectonic activity) (Table 3). Most of the basins of class 2 are located on the East side of the study area, the location of active faults of the region.
Regarding the Iat_T classification, 5 basins (7, 17, 20, 21 and 31) show high tectonic activity (class 2) (Table 3) (Fig. 10b). The high activity of basin No. 7 is caused by the Nayband, Kuhbanan, Lakar Kuh, Gowk, and Dehran faults. The Shahdad and Gowk faults are considered as the cause of tectonic activity in basins No. 17 and 31. The high activity in basin No. 20 is due to the activity of the Gowk fault system. In the basin No. 21, the fault-related folds lead to its high activity; The growth and development of these folds, near Mahan and Jupar cities, happen as a result of the blind thrusts (Walker, 2006 and Walker et al., 2010) activity under them.
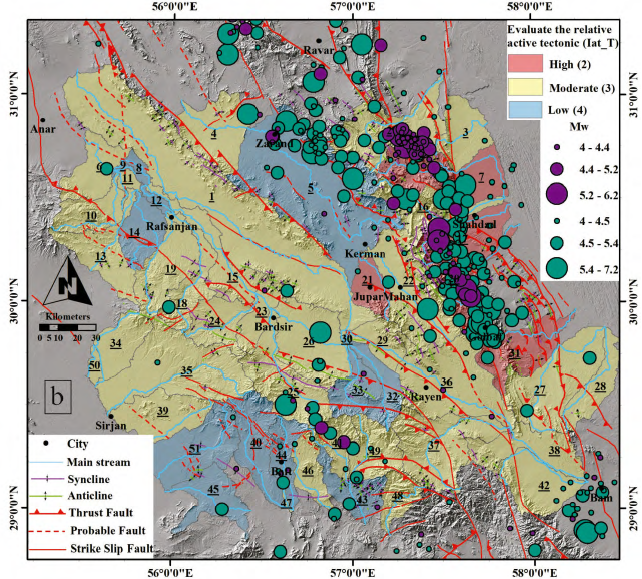
Figure 10b Distribution of the Iat index in the state of implementing T-factor. Earthquake epicenters in Fig 10a and b are from the catalog of Mousavi et al., 2014 (the period of 4th century B.C. through 2012 shown with green circles), and the earthquake between 2012 and 2019 are from IIEES and ISC (shown with purple circles).
The results show that the Kuhbanan fault system, especially its southern termination splays (e.g. Chatrud, Bazargan, Deh Bala, etc) (Fig. 11), which include the seismic gap zones along the Kuhbanan fault, is considered as the fault with the maximum seismic hazard potential to the study area. The Kuhbanan fault is elongated from SE to NW of basin No. 5, where a considerable part of Kerman city is in the southernmost section of this basin. In basin No. 5, all the V-shaped valleys (Vf < 0.5) have been created along the Kuhbanan fault. Furthermore, in basin No. 5, most of the active mountain-fronts (Smf < 1.1) are observed along the fronts created by the Kuhbanan fault (Fig. 11). However, the seismic hazard potential of the following faults should not be overlooked due to the anomalous values of the SL index results from their activity: 1- The southern terminus of the Jorjafk fault which is situated in the NW of basin No. 5, further away from the study area compared with the Kuhbanan fault, 2- The Rafsanjan-Zarand fault system, and 3- The Probable fault Zangi Abad, extending up to the proximity of Kerman city. In addition, the highest T values (T > 0.4) (class 1) (Table 2) in basin No. 5 belong to these faults (Fig. 11).
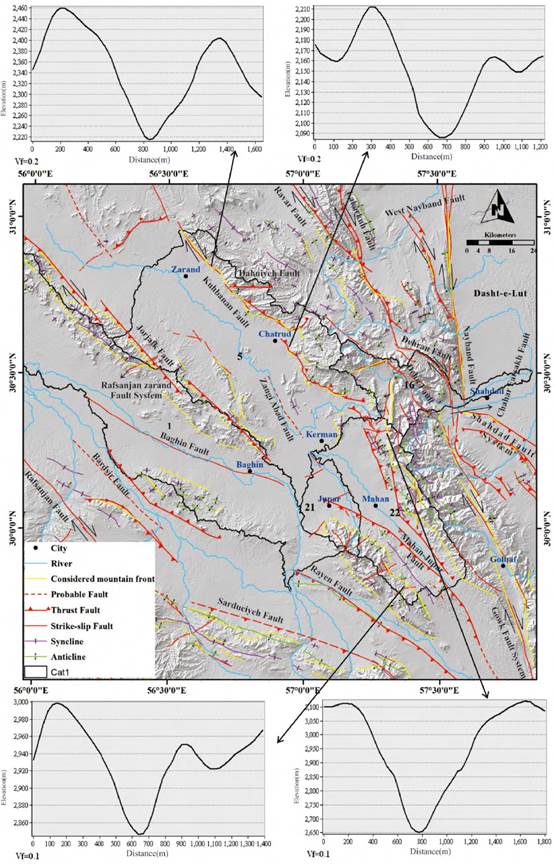
Figure 11 Shaded-relief topographic map of basins No. 1, 5, 16, 21, 22 with the geological structures, the location of considered mountain fronts used for the assessment of the Smf index, and some of the valleys Cross-sections with their Vf values.
A small part of the south of Kerman city is located in basin No. 22 where the Vf shows high activity (Vf = 0.43) (Table 2). The existence of the height of Kuh-e-Sekonj (Fig. 11) and part of the Gowk fault in the East; Mahan-Jupar fault-related fold system in the West; and the Kuhbanan fault (East Kerman fault) in the NE of basin No. 22 are considered as signs of a seismic threat to Kerman city. In basin No. 22, most of the V-shaped valleys (Vf < 0.5) and the highest T values (T > 0.4) (Table 2) are caused by the activities of Gowk and Kuhbanan faults. The concentration of high Smf values (Smf < 1.1) (Table 2) along the Kuhbanan fault in this basin, is another sign of active tectonic and uplifting which are resulted from the activity of this fault (Fig. 11).
The only anomaly in the SL index of this basin is due to the Mahan-Jupar fault system activity which runs parallel to the stream.
Analyzing basin No. 21 is also important in estimating earthquake risk in the city of Kerman, as this basin is close to the city. This basin shows high tectonic activity (class 2) based on the Iat_T value. The Mahan-Jupar fault-related folds, which their growth and development are the result of blind thrusts activity beneath them (e.g. Walker et al., 2010), are regarded as the major possible risk in the basin No. 21. The Mahan-Jupar fault-related folds seem to cause the highest and most anomalous values of the SL index and V-shaped valleys in this basin. Furthermore, the Af (|Af-50|>15), Vf (Vf<0.5) and T (T > 0.4) indices (Table 2) indicate that the basin is tectonically active.
A small part of the southern termination of basin No. 1 is close to Kerman city. According to Iat_T, this basin has moderate tectonic activity (Class 3) (Table 3). In this basin, the important issue that needs to be considered is the faults that caused anomalies in the SL index values. One of them is caused by Baghin fault. The closest distance of this fault to Kerman city is 20 kilometers and it has not produced significant surface ruptures.
Another anomaly, farther downstream, has highlighted a gap between two segments of Rayen fault which Walker et al. (2010) has reported river incision there, and seems to result from fault-related uplift.
Although it is in more distance from Kerman than other basins mentioned before, the importance of basin No. 16 should not be neglected; due to the presence of active faults such as Kuhbanan (Dehu), Gowk (Chahar Farsakh and Dehran) and locating in the range of structural changes related to the intersection of the major well-known faults of the region - e.g. Nayband and Gowk faults - which are responsible for most of the destructive earthquakes happened in Kerman province (Fig. 11).
Since the identified seismic sources - especially in basins No. 1, 5, 16, 21, and 22 - are close to the population centers -such as cities of Kerman, Mahan, Jupar, Shahdad, Golbaf, etc. - we suggest that more attention is needed, and further studies, especially paleoseismology, should be conducted to evaluate this area's seismic risk more carefully.
In conclusion, there is a close relationship between tectonic activity rate, geomorphic indices, and structures in this region; As basins with high relative tectonic activity (class 2 of the Iat_T) (Basins No. 7, 17, 20, 21 and 31) (Table 3), correspond with the active structures and the earthquake epicenters concentration (Fig. 10a).
The morphotectonic analysis conducted in this study suggest that the Kuhbanan fault system, especially its southern splays, has the potential to produce serious seismic hazards to Kerman city in the future; the Mahan-Jupar fault-related folds, the southern tip of the Jorjafk fault, the probable fault of Zangi-Abad, the Rafsanjan-Zarand fault system, and Gowk fault are considered as other threats to Kerman city.
The quantitative geomorphic studies (Table 2 and 3) has indicated that basins in which the T factor class is higher than the Iat index class, are affected by reverse or thrust faulting; while in basins with the Iat index class higher than the T factor class, the predominant fault type is strike-slip (Fig. 9 and Fig. 10a and b).
This study confirms that it is possible to identify seismic sources by their effect on the geomorphic indices since.
Active structures are responsible for most of their anomalous changes. In addition, we showed that geomorphic indices are very useful tools not only in showing the tectonic activity condition of a region -especially in a large area-but also in showing the fault types (i.e., Dip-slip and Strike-slip).

