


 English (pdf)
 Article in xml format
 Article references
 Send this article by e-mail
 Cited by SciELO
  Cited by Google
  Similars in
SciELO
Similars in
SciELO  Similars in Google
 Permalink
Introduction
Submerged vegetation growing in shallow water is one of the most important components providing ecological services in natural rivers (Okamoto et al., 2014; Najafabadi et al., 2015; O'Briain et al., 2017). For the purposes of ecological restoration and pollutant reduction, aquatic vegetation planting and management with different configurations have become common approaches in recent years (Zhou et al., 2006; Callow, 2012; Lama et al., 2021). For the rigid vegetation, due to the additional vegetal retardance, it has been noticed that vegetation planted in rivers may raise the water depth and reduce flow velocity, and therefore increase the potential risk of flooding or sediment silting (Zhang et al., 2015a; Friberg et al., 2017). However, the complexity of the combinations of hydraulic and vegetation conditions hindered the development the determination of the alternations of flow state due to vegetation block (Stone and Shen, 2002; Yagci et al., 2010). A comprehensive understanding of the effects of rigid vegetation on flow structure is therefore significant for river ecological restoration. Starting from this point, numerous research works can be found in literature (Fathi-Maghadam and Kouwen, 1997; Pasquino et al., 2016).
To investigate the effects of rigid vegetation on flow parameters including water depth, flow velocity, flow resistance, turbulent structure and so on, rigid cylinders made of wood, iron, plastic and some other materials were commonly utilized in previous studies to simulate rigid aquatic vegetation in river ecosystems (Wu, 1999; Järvelä, 2005; Musleh and Cruise, 2006; Huai et al., 2009. Temmerman et al. (2005) employed a 3-D model to investigate the flow and sedimentation patterns affected by vegetation and water level fluctuations. Flume studies were carried out by Järvelä (2005) to investigate the flow structure above flexible vegetation, by which the flow above submerged flexible vegetation was reported to follow the log law. A definition for the shearing velocity which can avoid complex turbulence measurements was proposed in his research. The vertical flow velocity distributions in trapezoidal open channels were found following power and logarithmic functional relationships by Chanson (2004) and Nezu et al. (2008). With experimental and theoretical methods, a 3-layer model was proposed by Huai et al. (2009) to predict the vertical flow velocity distribution with submerged vegetation in open channel. The velocity profiles affected by configurations of cylindrical bamboo stems were investigated by Yokojima et al (2015). Based on the experimental and numerical results, the applicability of large-eddy simulation method was examined for the canopy modelling. Water depth was selected as the hydrological controlling parameter by Chauhan (2005) to investigate the vegetation structure and dynamics in a subtropical regulated river, by which, the hydrological regime was reported to dominate the developing of plant community in floodplain wetland rather than the physical connectivity. The importance of vegetation effects on turbulent structure was demonstrated by McBride et al. (2007) through a flume experiment, in which, the flow velocity, turbulent kinetic energy, Reynolds shear stress and boundary shear stress for vegetated and un-vegetated cases were found obviously different. In the studies of Nepf (1999) and Jack et al. (2011), the vegetation existence was found to alter the turbulent structure by changing the shear and wake productions around vegetation stems. For the research on vegetal resistance, Rhee et al. (2008) found that Manning's coefficients were affected by the states of plants, whether green or dormant. From the perspective of biomechanics and streamlining of vegetation, some field experiments were also conducted (Sandercock and Hooke, 2010). Vegetation in river can reduce the force of drag and lift acting on the boundary by increasing the effective roughness height (Thorne, 1990). Based on that White and Nepf (2003) correctly captured the dependence of wake generation on vegetation array density and Reynolds number, Ben Meftah and Mossa (2013) established a theoretical relationship between the bulk drag coefficient CD of a random, emergent array of cylinders with vegetation density. However, flow phenomena in open channel will be more complicated with vegetation introduced, especially for that the water depth is larger than the vegetation height which means submerged vegetation (Stone and Shen, 2002; Gualtieri et al., 2018). Meanwhile, many interactive factors such as river geometry, hydraulic parameters, vegetation type, stems characteristics, planting density and so on also increase the difficulty of the research in this field (Green, 2005; McBride et al., 2007; Zhang et al., 2015b).
Therefore, it is of great significance to find a dimensionless parameter to well describe the impact of rigid submerged vegetation. In this research, vegetation height and a dimensionless concept of relative submergence are adopted to investigate the effects of rigid submerged vegetation on flow structure. Via a series of experiments, the relationship between the vegetation height and relative submergence will be determined, based on which, the variation tendencies and amplitudes of water depth and flow velocity affected by rigid submerged vegetation will be analyzed and compared regarding to both vegetation height and relative submergence. The relative submergence adopted in this study and the relevant analysis results are expected to improve the comprehensive understandings of the interactions between vegetation and water flow and provide some guidance to the engineering practices of river ecological restorations.
Experimental And Analytical Methodology
Experimental setup
To investigate the influences of vegetation height and relative submergence of rigid vegetation on flow structure in open channel, a series of experiments are conducted in a rectangular concrete channel which dimensions where length=30 m, width=1.3 m, depth=0.8 m and bed slope /=0.0055 m/m. As shown in Figure 1, from the recycling tank, water is lifted to the water flatting tower utilizing a pipeline centrifugal pump (Model: 200-200(1) A, Maximum Discharge: 99.4 l/s). Then, water flows through the water flatting tower (with an overflow launder), intake gate combined with an HQC-2 water level and discharge controller, thin-walled rectangular weir, stilling basin and energy dissipation fence in sequence to fulfil the experimental requirements of water stabilization and flow discharge control. As can be seen in Figure 1, there is a 3 m long stabilizing section in front of the test section to further stabilize the water flow. Within the test section (y=3-11 m), a 4 m long vegetation section (y=5-9 m) is determined. To investigate the detailed flow structure affected by the rigid submerged vegetation blocks of different vegetation heights or relative submergences, the flow discharge for this research is selected as 2=90 l/s which is a higher and stable value for the utilized pump. In the experimental open channel, the water flow with free surface remains gradually varied flow states, which are also the hydraulic conditions focused on in this study.
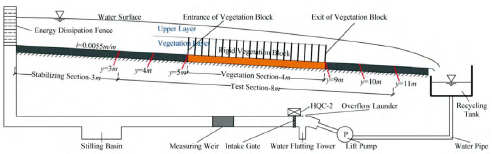
In the experiments, woody cylinders with a uniform diameter of 7 mm are employed to simulate the rigid vegetation in rivers to avoid the influences from leaves and branches. For planting the simulated vegetation stems with uniformly staggered arrays, punched plates are used to cover the planting pool which is built concave downward the channel bed of the vegetation section (y=5-9 m) and filled with fine sand. On these plates, small holes of 1 cm in diameter are uniformly staggered drilled, by which, the simulated vegetation stems can be firmly planted (schematized in Figure 2(a)). As demonstrated by previous studies, vegetation density alters the characteristic length and time scales of energetic motion in open channel, the standard boundary-layer flows could also be shifted to canopy flows gradually with increasing vegetation density (Poggi et al., 2004), In fact, higher vegetation densities are generally used in the practices of river restorations to produce better ecological and environmental benefits (Nikora et al., 2013). Based on the comprehensive considerations on previous study (Velasco et al., 2003, Zhang et al., 2015a), field investigations and the reality of punched plates, a relatively dense vegetation density of 202 stems/m2 is used in the present research.
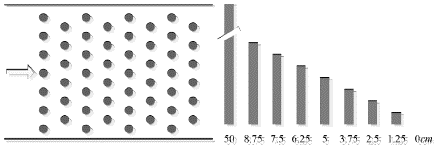
To determine the vegetation heights above the channel bed h V which can ensure that the vegetation stems are full-course submerged, a blank test without vegetation is first conducted with flow discharge of 90 l/s. Within the test section, the average water depth for the blank test is 10.03 cm. The vegetation heights h V are therefore set as 0, 1.25, 2.5, 3.75, 5, 6.25, 7.5, 8.75 and 50 cm to fully investigate the effects of relative submergence on flow structure (see Figure 2(b)). For these 9 vegetation heights, 0 represent the blank test without vegetation, 50 cm means an unsubmerged test for comparisons while the other 7 tests are under submerged conditions. The experimental case with vegetation height of 50 cm is served as a control group, and the data are used for the comparison when analyzing water depth and velocity variations. This will promote our understandings on vegetation effects on water flow without affecting or changing the analysis results about vegetation heights or relative submergence.
The flow velocities and water depths within the test section (y=3-11 m) are measured by ADV (SonTek 16-MHz Micro Acoustic Doppler Velocimeter) and ABF2-2 water level measuring system, respectively. The distance of the probes of ADV to the sampling volume is 5 cm. ADV is therefore a non-contact velocimeter which has high resolution (0.01 cm/s) and accuracy (±1% of measured velocity) for the velocity measuring. With the sampling frequency of 50Hz, ADV was reported to get a stable average flow velocity if the measuring duration exceeds 45 s (Jing et al., 2010). The sampling frequency and duration are therefore set as 50 Hz and 60 s in the experiments. These 3000 instantaneous velocity samples will be used to calculate the time-average flow velocity for each measurement point. During the velocity sampling, the signal-to-noise ratios of the ADV measurements maintain above 15 which can guarantee the quality of the collected velocity data (Pujol et al., 2010). As can be seen in Figure 3(a), flow velocities are measured at the intersections of 9 transverse-sections (y=3, 4, 5, 6, 7, 8, 9, 10, 11 m) and 5 different longitudinal-sections (x=0.05, 0.35, 0.65, 0.95, 1.25 m) within the test section. To make the velocity data more accurate, at each of these intersections, the flow velocities are measured each 0.005 m from the channel bed to the water surface (see Figure 3(b)). Since that the arithmetic average method is typical and critical to the calculations of cross-sectional hydraulic parameters (Chow, 1959; Zhang et al., 2015b), the arithmetic mean of the flow velocities collected on each transverse-section is taken as the cross-sectional average velocity, correspondingly.
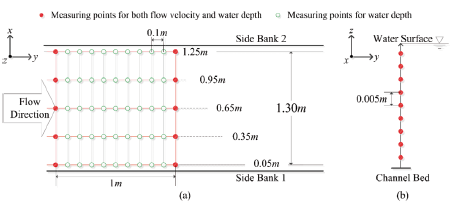
With ABF2-2 water level measuring system, the water depths along the measuring bridge can be automatically measured point by point with equidistance (0.1 m for the present research). Its resolution and accuracy are 0.01 mm, 0.04 mm, respectively. In the experiments, the longitudinal-sections for water depth measurements are same to the velocity measurements. However, along the longitudinal direction, the water depths are equidistantly measured every 0.1 m from y=3 m to y=11 m (see Figure 3(a)). Similar to the calculating of cross-sectional average flow velocity, the arithmetic average of these 5 values on each transvers direction is the cross-sectional water depth.
Analytical methodology
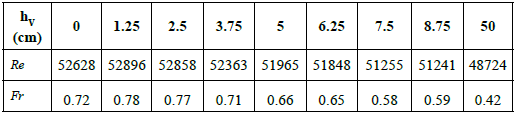
In this research, the average Reynolds number Re and Froude number Fr are used to determine the flow state for each experimental test. As shown in Table 1, the average Reynolds number Re is in the range of 48724-52896 for all the experimental tests which suggests that the flow in the test section is fully developed turbulent and independent of Re (Kouwen and Fathi-Moghadam, 2000). Meanwhile, the average Froude number Fr between 0.42 and 0.78 is lower than 1 indicating the slow flow condition in the test section (Table 1). The friction factor for such rough channels with vegetation covered is independent of gravitational effects (Kouwen and Fathi-Moghadam, 2000).
The relative submergence S r analyzed in the research is defined as the specific value of water depth h and the submerged vegetation height h V (Equation (1)).
The average relative submergence
 can be got by averaging the S
r
values at each transverse-section corresponding to each experimental test.
can be got by averaging the S
r
values at each transverse-section corresponding to each experimental test.
With the water depths experimentally measured in this research, the difference between the maximum and minimum water depths corresponding to 9 different experimental tests can be calculated with:
Similarly, the formula for the difference between the maximum and minimum flow velocity is:
RESULTS AND DISCUSSION
Effects of vegetation height on relative submergence
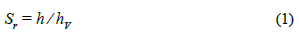
With the water depths measured in the experiments, the relative submergence at each measurement points can be calculated with Equation (1) corresponding to different vegetation heights. For the case without vegetation, the relative submergence is +œ as the vegetation height h V=0. For the other 8 tests, the variations of the relative submergences along the vegetation section are plotted in Figure 4(a). As can be seen in the figure, the relative submergences present decreasing trends along the flow direction for all cases. The decreases of the water depths should be responsible to such decreases of relative submergence as the vegetation heights are constant within the vegetation section. In addition, the minimum value of the relative submergences except for the unsubmerged case (hV=50 cm) is 1.133, which appears at the exit of the vegetation block (y=9 m location) for the case of hV=8.75 cm (Figure 4(a)). At this time, the water depth is only 9.9 cm (as shown in Figure 5), which indicates that the vegetation stems may be submerged in the fore part of vegetation section and unsubmerged near the exit of vegetation section if another larger vegetation height hV=10 cm is introduced. Such partially submerged and partially unsubmerged condition is much more complex and not considered in the research. From Figure 4(a), it can also be seen that the gaps between two adjacent curves of relative submergence decrease rapidly at low vegetation heights and slowly when the vegetation heights increase to higher values.
Figure 4 (a) Variations of relative submergence along the vegetation section, (b) the relationship between vegetation height and average water depth.
Corresponding to different experimental cases except the unsubmerged one, the case-averaged water depth h
avg
is analyzed regarding to the vegetation height h
V
to further realize the effects of vegetation height on average relative submergence
 . As shown in Figure 4(b), the relationship between them can be described by a linear function
where α=0.102, b=0.332 are constant factors while the coefficient of determination is R2=0.928. This relationship demonstrates that the average relative submergence
 decrease with the increase of vegetation height. It is obvious that the average relative submergence of the blank test is since the vegetation height can be considered as h
V
=0. By extending the fitting line in the figure, a special point where both vegetation height and average water depth equals 15.22 cm is found, which makes the average relative submergence equals. That means the vegetation stems are just unsubmerged in average although it may be not rigorous. The vegetation stems are presumably partly unsubmerged while the other stems submerged because of that the variation of water depth is affected by the vegetation block planted in the channel. In this case, the average relative submergence should be higher than 1 according to its definition. The exact value of the vegetation height which can make all the stems just unsubmerged couldn't be predicted and needs to be experimentally calibrated. But this value will undoubtedly be greater than 15.22 cm.
decrease with the increase of vegetation height. It is obvious that the average relative submergence of the blank test is since the vegetation height can be considered as h
V
=0. By extending the fitting line in the figure, a special point where both vegetation height and average water depth equals 15.22 cm is found, which makes the average relative submergence equals. That means the vegetation stems are just unsubmerged in average although it may be not rigorous. The vegetation stems are presumably partly unsubmerged while the other stems submerged because of that the variation of water depth is affected by the vegetation block planted in the channel. In this case, the average relative submergence should be higher than 1 according to its definition. The exact value of the vegetation height which can make all the stems just unsubmerged couldn't be predicted and needs to be experimentally calibrated. But this value will undoubtedly be greater than 15.22 cm.
Effects of vegetation height on the variation trends of water depth
Water depth which indicates the absolute height of water in rivers is one of the important control parameters for the designs of water courses and hydraulic structures (Chow, 1959). The variations of water depth affected by rigid submerged vegetation of different vegetation heights or average relative submergences are investigated in the research. Figure 5 shows the variations of measured water depths along the flow direction.
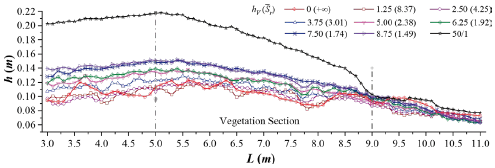
As can be seen in Figure 5, the variation of water depth presents a slight decreasing trend with obvious fluctuations for the experimental case of no vegetation. In this case, the irregularity of the concrete channel bed should be responsible to such fluctuations of water depth. Such variations of the other 8 vegetated cases are different. In detail, the curves of water depth present increasing trends before the vegetation block (y=3-5 m) and reach maximum values near the y=5 m location which is the entrance of the vegetation block. On the whole, the maximum water depth increases with the increase of vegetation height. Within the vegetation section (y=5-9 m), the water depths decrease gradually and smoothly. Near the exit of the vegetation block (y=9 m), the gaps between these curves shrink rapidly to a bunch and this situation maintains after that (y=9-11 m). In summary, the curves of water depth for the vegetated cases become smoother in comparison with the blank test, but the water depths before and within the vegetation block are raised due to the vegetation blockage and retardance. And the raised amplitude of water depth increases with the increase of vegetation heights. At last, these water depths after the vegetation block resume to the level and trend of the blank test.
It can be easily found that the water depths drop rapidly near the exit of vegetation block, which is well known and consistent with previous studies (Zhang, 2015b). Therefore, flow acceleration and fluctuation, as well as high frequency exchange of flow momentum and turbulent kinetic energy are inevitable in this zone, which may cause erosion of river bed (Yagci, 2010; Zhang, 2015b). Enhancing the strength of river bed in this zone and regulating the flow structure by configuring the vegetation patches are undoubtedly two ways to deal with this problem. Obviously, some more vegetation is needed to some distance downstream of the vegetation block in the practices of river ecological regulation. In the gap regions between the vegetation patches, the flow velocity will be reduced due to the sheltering effect, which have positive effects on the stability of river bed (Zhao and Huai, 2016). However, how to determine an optimal configuration of vegetation patches such as the type, height and patches number of vegetation, the distance and number of gaps, etc. needs more case studies to analyze and summarize.
For the unsubmerged case (h
V
=50 cm,
 ), it can be noticed that the curve of water depth is much higher than the other cases before y=9 m location. As predicted in the research, the vegetation height making all the vegetation stems unsubmerged must be much higher than 8.75 cm. The vegetation height and average relative submergence of h
V
=8.75 cm,
=1.49 are still far away from the unsubmerged case although the lowest relative submergence at y=9 m location is as low as 1.133. Much higher blockage and retardance of the unsubmerged vegetation block can make the water depths before and within vegetation block higher. The effects of submerged vegetation on flow resistance are completely different to that of unsubmerged vegetation, the resistance mechanisms for the submerged and unsubmerged vegetation raising the water depths need further experimental studies (Fathi-Moghadam et al., 2011; Zhang et al., 2014).
), it can be noticed that the curve of water depth is much higher than the other cases before y=9 m location. As predicted in the research, the vegetation height making all the vegetation stems unsubmerged must be much higher than 8.75 cm. The vegetation height and average relative submergence of h
V
=8.75 cm,
=1.49 are still far away from the unsubmerged case although the lowest relative submergence at y=9 m location is as low as 1.133. Much higher blockage and retardance of the unsubmerged vegetation block can make the water depths before and within vegetation block higher. The effects of submerged vegetation on flow resistance are completely different to that of unsubmerged vegetation, the resistance mechanisms for the submerged and unsubmerged vegetation raising the water depths need further experimental studies (Fathi-Moghadam et al., 2011; Zhang et al., 2014).
It is obvious that vegetation blocks of different parameters show different affecting strength at different locations in the channel. For detailed analyzing the effects of rigid submerged vegetation on water depth at different locations, the average water depths at selected locations before (y=3 m), entering (y=5 m), within (y=7 m), outing (y=9 m), and after (y=11 m) corresponding to different experimental tests are plotted in Figure 6. In the figure, it can be easily observed that the effects of vegetation heights or relative submergence are significant before and within the vegetation block.
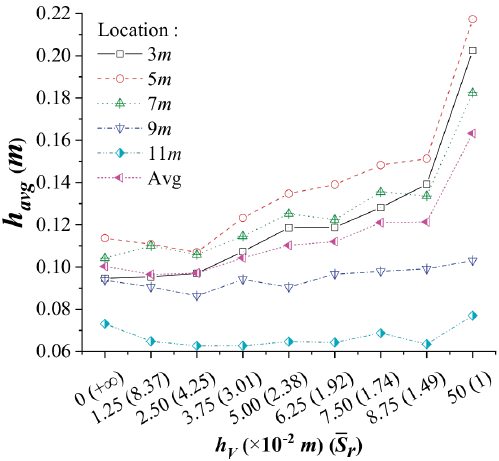
Figure 6 Variations of average water depth at different locations regarding to vegetation heights and average relative submergences.
Table 2 Statistical results of vegetation height impact on water depth
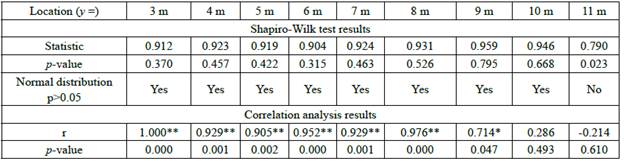
Note: ** represents significance level 0.01, * represents significance level 0.05.
In order to determine the significance of vegetation height impacts on water depth at different locations, the relationship between them is analyzed by correlation analysis method corresponding to the integer transverse-sections between y=3 m to y=11 m. It should be noticed that the data from the unsubmerged case (h
v
=50 cm,
 =1) is removed to more accurately reflect the effects of submerged vegetation block. In Shapiro-Wilk normality test, the data of water depth at the transverse-section y =11 m is found not to obey the normal distribution (Table 2). And Spearman correlation coefficient is therefore adopted. The results of correlation analysis presented in Table 2 are consistent with the conclusion directly overserved in Figure 6. The effects of vegetation heights are significant before (y=3-5m) and within (y=5-9 m) the vegetation block.
On the transverse-sections within these areas, the water depths increase with the increase of vegetation heights or decrease of relative submergences. For the other transverse-sections at and after the exit of vegetation block, the differences in water depth due to variable vegetation heights or relative submergences are negligible. That is why the curves for water depth in Figure 5 contract to a bunch of approximatively overlapping lines at this area (y=9-11 m). Although the impacts of vegetation height on the variation trends of water depth are illustrated above, the extent of such effects have not been quantified. As such, further analyses on the effects of vegetation height and relative submergence on the variation amplitude of water depth are performed.
Effects of vegetation height and relative submergence on the variation amplitude of water depth
In recent years, vegetation planting and management have become common techniques for river ecological restoration and regulation. How the submerged vegetation blocks affect the variation amplitude of water depth or raised water depth is therefore significant to investigate. The differences between the maximum and minimum water depths h d corresponding to different vegetation heights and average relative submergence are plotted in Figure 7.
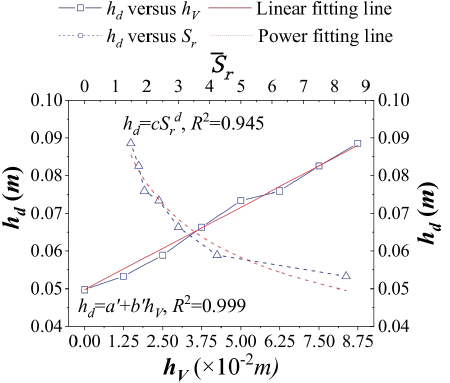
Figure 7 Variations of water depth difference regarding to vegetation heights and average relative submergences.
As can be seen in the figure, the water depth differences h d which can represent the variation amplitudes of water depths increase with the increase of vegetation height. As the water depths for 9 different cases are close near the exit of vegetation block, the variation amplitudes of water depth can represent the raised water depths in a great extent, which illustrate that the introduction of submerged vegetation can significantly alter the water surface profile in rivers. As can be seen in the figure, the water depth differences hd increase linearly with vegetation height. The variation trend can be fitted by linear function of
where α’=0.0497 and b’=0.4 are constant factors representing the intercept and the slope for the trend line, respectively. The coefficient of determination for this fitting is R 2 =0.999. Considering the relationship between vegetation height and water depth presented in the last section, the water depth difference h d should decrease with the increase of relative submergence of vegetation. As shown in Figure 7, the fitted relationship between h d and average relative submergence can be described by
where c=0.097 and d=-0.315 are constant factors for this power function while the coefficient of determination is R 2 =0.945.
In comparison with the linear relationship between the water depth difference h
d
and vegetation height the power function seems more complex in form for predicting the effects of submerged vegetation on raised water depth. However, the average relative submergence
 is a more general parameter and applicable for different flow discharges in engineering practices, it just needs to calibrate the factors c and d (Manes et al., 2007; Wilson, 2007; Fathi-Moghadam et al., 2011).
Effects of vegetation height and relative submergence on flow velocity distribution
Figure 8 shows the variations of flow velocity along the test section. As shown in the figure, the flow velocity of the case without vegetation changes very small along the flow direction and presents a very slight increasing trend as a whole, which is consistent with the slight decreasing trend of water depth presented in Figure 5. Except for these two lowest vegetation heights h V =1.25, 2.5 cm and largest average relative submergences , the flow velocities of the cases with submerged vegetation basically don't change along the flow direction before 8 m location. When h v =1.25 and 2.5 cm, the flow velocities seem to decrease slightly in this section, which may be related to the bed roughness alternations due to the submerged vegetation with low height and large relative submergence. For these two cases. the frontal vegetation area per unit bed area λ can be calculated as 0.018 and 0.035, which demonstrated bed-shear flow conditions according to the division standard (0<λ<0.04) in previous studies (Nepf, 2012; Zhao et al., 2019). When h V increases 3.75 cm and above, the flow regimes have changed while λ are larger than 0.04 (0.053 for the case h V =3.75 cm). However, further analysis of the bed roughness and vertical distribution of flow velocity under rigid submerged vegetation conditions are necessary to connect these two issues in the future.
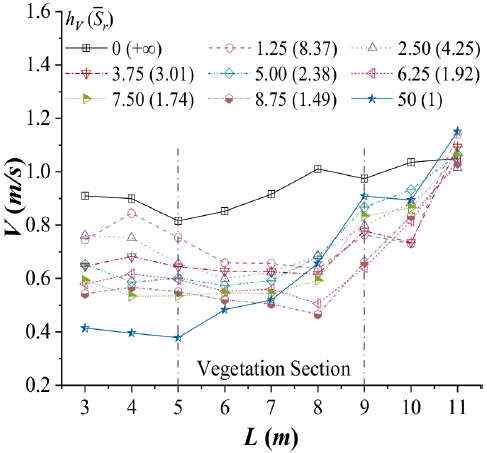
Figure 8 Variations of flow velocity along the test section corresponding to different vegetation heights and average relative submergences.
After y=8 m location, the curves of flow velocity for all the cases with submerged vegetation increase rapidly towards the level of the blank case. Such increases near the exit of vegetation block are reasonable in considering the variations of water depth shown in Figure 5. For the case with unsubmerged vegetation (hV=50 cm,
 =1), the flow velocities are obviously lower than the other cases and increase when the water just flows into the vegetation block, which presents a better consistency to the trend of water depth. These large increasing gradients of flow velocity at the interface of vegetation block agree with previous study (Green, 2005; Zhang, 2015b). Furthermore, it can be noticed in Figure 8 that the curves of flow velocity are crossed or overlapping at many locations, which makes it difficult to rank the flow velocity.
Anyway, the distributions of flow velocity are significantly affected by the rigid submerged vegetation of different vegetation heights or relative submergences. A problem that cannot be ignored is that high-velocity water flow may erode the river bed and banks (Coon, 1998; Qian et al., 2016). As reported in previous studies, vegetation patches planted properly will help to better protect against such erosion (Liu et al., 2017). As pointed out by Najafabadi et al. (2015), the interactions between accelerating flow velocity and vegetated banks are dominant to the flow characteristics of vegetated open channel. A further study on the special values is therefore necessary to realize the effects of vegetation heights or relative submergences on flow velocity distributions and hydraulic erosion.
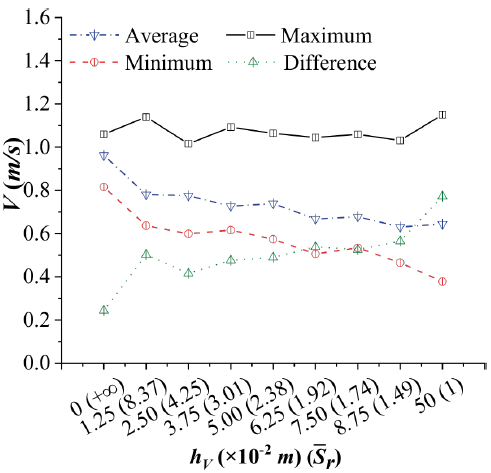
As mentioned above, an analysis on the variations of the maximum, minimum flow velocities and the differences between them as well as the average flow velocities are investigated regarding to the vegetation heights or relative submergences.
As shown in Figure 9, the maximum flow velocities fluctuate slightly and basically don't change with the increase of vegetation heights or decrease of average relative submergences. The fluctuation for the curve of maximum flow velocity is less than 0.135 m/s. For the curve of minimum flow velocities, the values decrease from 0.816 m/s to 0.378 m/s due to the increase of vegetation heights and therefore retardance by vegetation. The decreasing amplitude of the minimum flow velocities is up to 0.438 m/s. The variation of the average flow velocities is just higher in numerical values than the curve for the minimum flow velocities while the variation tendency is similar. It is obvious that the difference between the maximum and minimum flow velocities should increase with the vegetation heights as the maximum values change slightly and minimum values decrease continuously. Such difference is as high as 0.772 m/s when the vegetation stems are unsubmerged (h
V
=50 cm,
 =1) and significantly higher than 0.566 m/s for the case h
V
=8.75 cm and
=1.49, which is consistent to the variations of water depths.
=1) and significantly higher than 0.566 m/s for the case h
V
=8.75 cm and
=1.49, which is consistent to the variations of water depths.
Conclusions
Based on a series of experiments conducted in a laboratory channel, the vegetation height and a concept of relative submergence are adopted to analyze the effects of rigid submerged vegetation on flow structure in this research. With the experimental results of the research, the following conclusions can be drawn.
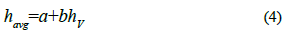
(1) The relative submergences present decreasing trend along the vegetation section except for unsubmerged case of the present research. The linear regression function h avg =a+bh v between vegetation height and case-averaged water depth demonstrates a decrease trend of average relative submergence with the increase of vegetation height.
(2) The differences between the maximum and minimum water depths corresponding to the submerged cases follow a linear relationship h
d
=α’+b’h
v
h
V
with vegetation height and a negative power functional relationship h
d
=c
 " with the average relative submergence. With these relationships, the raised water depths due to rigid submerged vegetation can be predicted, especially for the relative submergence which is more general than the vegetation height.
(3) For most submerged cases, the flow velocities basically don't change before 8m location, and increase rapidly towards the level of the case without vegetation after 8m location. The differences between the maximum and minimum flow velocities increase with the vegetation heights as the maximum values change slightly and minimum values decrease continuously.
Some parameters in the empirical relationships obtained in this research need to be calibrated in practical applications due to the complexity of vegetation and hydraulic conditions. The findings of the research may improve the comprehensive understandings of the effects of vegetation heights and relative submergences of rigid submerged vegetation in open channel and may give some guidance to the practices of river ecological engineering design and management.

