


 Inglês (pdf)
 Artigo em XML
 Referências do artigo
 Enviar este artigo por email
 Citado por SciELO
  Citado por Google
  Similares em
SciELO
Similares em
SciELO  Similares em Google
 Permalink
1. Introduction
Initially, GNSS systems and permanent station networks were used to create time series, from which the velocities of the stations that comprises the geodetic networks were extracted, thus allowing the creation of a deformation model that enables the study of the geodynamics of the area covered (Feigl et al., 1993; Freymueller et al., 1993). For these kinds of studies, a 30 or even 300 second decimate is sufficient, since the time series are created from several years of observations (Members BIFROST Project, 1996). The implementation of geomatic techniques were also expanded to other fields like hydrology with successful results (Arab Amiri & Gocic, 2021; Arab Amiri & Gocic, 2021; Gocic & Arab Amiri, 2021).
The development of GNSS receivers allowed large sampling frequencies (1 Hz or higher). On the other hand, it also improved the quality of accurate products (Bock et al., 2009; Altamimi et al., 2007) (i.e. corrections of satellite clock states, orbits, etc...). This improvement in the precise products is materialized into the evolution of the processing techniques, allowing better estimates that are close to the processing in near real time (Colosimo et al., 2011). Such development allows the use of conventional models for the analysis of GNSS data generated by the stations during seismic events (Ge, 1999; Ge et al., 2000; Hirahara et al., 1994; Larson, 2009), where large displacements are obtained in short intervals of time, typical circumstance during a great magnitude earthquake.
The increasing number of geodetic networks with sampling frequencies of 1 Hz or higher, is a very useful tool for the study of seismic events (Zheng et al., 2012), complementing the traditional methods (Li et al., 2013). They allow, in addition to the study of the cortical deformation in time (Bock, 1991), before and after the rupture, to record the displacements experienced by the stations during the event (Michel et al., 2017), with increasing accuracy. GNSS systems have great advantages over traditional seismic equipment. For instance, they do not get saturated in case of big accelerations and offer a direct measurement of the cosmic displacement, being the seismogeodetic networks a useful tool for the study of seismic events.
The area that encompasses the islands of Japan is one of the most tectonically active areas, hence the great importance of cortical deformation monitoring. It is a region characterized by the interactions of 4 tectonic plates (Yoshioka et al., 1994) (the Euro-Asian plate, the Pacific plate, the Philippine Sea plate and the Okhotsk plate) (Bird, 2003), being the central part of Japan the most active (figure 1). The tectonics of the region originates a high seismic and volcanic activity. Subduction zones are created in the convergence zone of two plates, when the oceanic plate slides under the continental one. In Japan, there are several of them, like the convergence of the Pacific and Euro-Asian plates (Hashimoto et al., 2004) or in the southern zone, with the Euro-Asian and Philippine Sea plates (Furukawa, 1999). The landslide that occurs in the subduction zone (Brizzi et al., 2018; Métois et al., 2012; Mazzotti et al., 2000) is the result of a combination of displacements generated by both earthquakes and the displacement of the plates (Chlieh et al., 2008). The accumulated movement during the inter-seismic period generates the energy that is later released with a seismic event. The measurement of the cortical deformation during this period is key to understand the recurrence of earthquakes (Wallace et al., 2004), especially those of great magnitude.
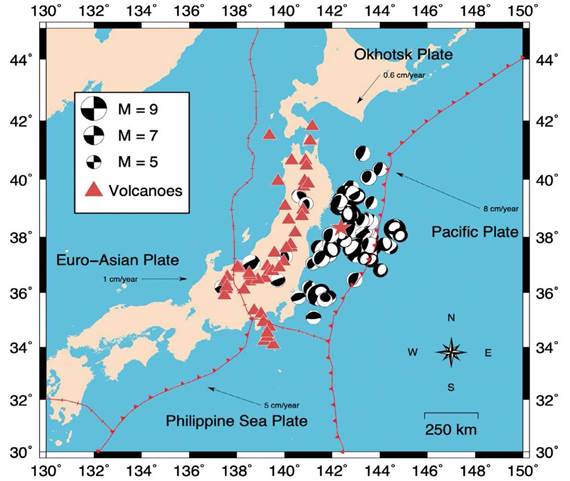
Figure 1 Representation of the limits of the four plates that converge in the zone of Japan represented by the red line, the centroids of the earthquakes of magnitude greater than 4 occurred in the year before the earthquake, the volcanoes and the epicenter of the earthquake represented by a star.
The central area of the main island of Japan is affected by the interaction of the plates formerly mentioned that generates subduction zones due to their collides (Loveless, J. P., and B. J. Meade, 2010). The Pacific and Euro-Asian move opposite each other subducting beneath the Kanto region, close to the epicenter of the earthquake. This fact is one of the reasons the high number of seismic events (Nishimura T., Sagiya, T., Stein, R. 2007) that have struck the surrounding areas. There are several of these events recorded, like the 1923 Kanto earthquake whose rupture stroke the area along the confluence of the Euro-Asian and Philipine plates (Shishikura, 2003; Ishibashi, 2004).
Another interaction that affects the central region of Japan is the Okhotsk plate moving South while collides with Euro-Asian plate on its way to East (Zhao et al., 2018). To the south, the Philippine Sea plate is subducting beneath the Euro-Asian plate. Besides, the Pacific plate subducts beneath the Philippine Sea plate due to their different velocities. The former interactions imply the central region of Japan is surrounded by a complex tectonic activity that generates several subduction areas (Katsumata, K., N. Wada, and M. Kasahara, 2003) and faults, source of the high seismicity in the region (Hindle, D., and K. Mackey, 2011) and its recurrency (Shelly, R. et al., 2006; Kano, M. et al., 2018). As a consequence, a great number of high magnitude events were recorded in the area. Some examples are the 1993 Kushiro-Oki earthquake (Suzuki and Kasahara, 1996; Ozel and Moriya, 1999) and the 1994 Hokkaido-Toho-Oki earthquake (Kikuchi and Kanamori, 1995; Katsumata et al., 1995) both with a magnitude greater than 7.5.
The cortical deformation (Fujita et al., 2019; Kumar et al., 2002) generated by the tectonic plates in the area reaches values over 50 mm/ year in several points (Sagiya et al., 2000; Sagiya et al., 2002; Simons et al., 2011). The deformation occurs along the different collide zones of the plates, generating several subduction zones (Ozawa et al., 2004; Kumar et al., 2002). The geodynamic complexity of the zone is materialized in an important seismic activity (Ozawa et al., 2005), with events of great magnitude along history (e.g., Ozawa et al., 2004; Watanabe et al., 2006). The register of past events is a tool that allows to characterize the seismicity of the zone (Tajima et al., 2013; Ide & Aochi, 2013). Another tool that has allowed the study of the seismic of the zone is the satellite positioning systems, which allow to measure the surface deformation (Li et al., 2020; El-Fiky & Kato, 2006) giving an idea of the displacement of the plate on which the station is located as well as the numerical simulation of earthquakes (Sagiya et al., 2000).
On March 11, 2011, a strong earthquake occurred off the northeast coast of Honshu Island, shaking the islands of Japan. The event was originated in the subduction zone located at the confluence of the Pacific and North American tectonic plates (i.e., Okhotsk plate), which have a relative motion velocity of about 8 cm/year. Although the epicenter is located 130 km from Japanese territory, its effects on the main island were devastating. This fact make very complicated the measurement of near field offsets (P. K., Gautam et al., 2019). This earthquake is one of the largest recorded with seismic instrumentation (M 9.0) and GPS. Its ground motion effects have been widely studied using seismic equipment (Goto, H & Morikawa, H., 2012; Hirose, F., 2011; Ishii, M., 2011; Suzuki, W. et al., 2011), since there are also huge seismic networks all over the islands (e.g., K-Net). The processing of the GNSS data allows to obtain the field of coseismic displacements on the ground, obtaining values without the need of integrating acceleration values coming from seismometers.
While traditional methods use seismic data, GNSS data or a combination of both for studying seismic events (Melbourne, T. et al., 2002; Hsu,Y. et al., 2006; Ohta, Y. et al., 2012; Larson, K. M., P. Bodin, and J. Gomberg 2003; Ohta, Y. et al., 2008), we propose to focus on the combination of temporal and displacement values derived only from GPS data to evaluate the propagation of the earthquake instead of the mechanism process (Yakota, Y., et al., 2009). After constructing the temporal series of each station, we managed to figure out a threshold value to assume the station is by fact being affected by the seismic waves. From there, we analyzed the trend of this time variation versus the epicentral distance, what also let us calculate an approximation of the wave velocity based only on the time series of the GPS stations, not on seismic data (Stein, S., and E. A. Okal 2005). Previous aproximations of the velocity of the wave were made only by using a few stations (Zheng, Y., et al., 2012), but with higher rates of data (5 Hz). Furthermore, we calculated the coseismic displacements again based only on GPS data, with independence of seismic data inversion.
2. Data and processing
Japan has a dense geodetic network in its territory, known as GEONET, whose deployment began in 1993 by the Geographical Survey Institute (GSI), motivated by the number of seismic events that were recorded in the area. In 1996, the network had more than 400 stations, growing to more than 1300. This network makes Japan one of the countries with the greatest amount of GNSS-based information for geodynamic studies in the world.
Stations maintain a homogeneous pattern, being the typical configuration a monument on which the antenna is installed, a dual-frequency GPS receiver and a modem connected to a telephone line for data transmission. The receivers are Trimble or Topcon brand, and all the stations are equipped with Chokering type antennas, model TRM29659.00. The average distance between stations is 20 km, with a maximum distance of 40 km (Sagiya, 2004), which provides an enormous amount of data. Initially the network was configured to work at a decimate of 30 seconds, although technological evolution allowed the GSI authority to increase the sampling frequency of stations to 1 Hz. On the other hand, the increase in bandwidth allows observation data to be transmitted in real time to the control center for processing.
For this study, data from 93 stations belonging to the GEONET network have been used, located in the area where the largest cosmic displacements were recorded (Grapenthin & Freymueller, 2011) during the 2011 Tohoku-Oki earthquake (between latitude 37 and 40 degrees North, 136 and 142 degrees East, figure 2).
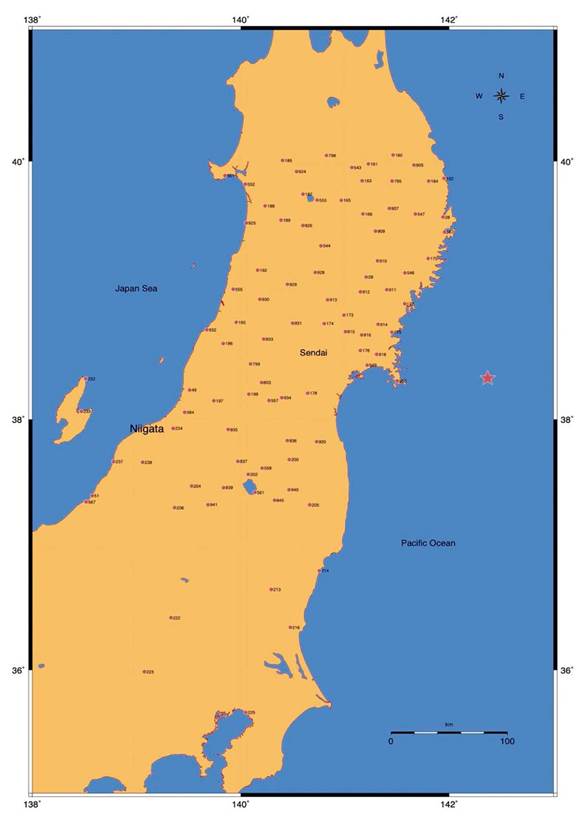
Figure 2 Disposition of the stations belonging to the GEONET network that were used in this study, as well as the epicenter of the Tohoku-Oki earthquake
With this work we aim to a better understanding of the earthquake focusing on the study of different parameters. By defining a time of detection and comparing it with the time when the maximum displacement is reached, we were able to see the evolution of the shock wave by comparing the different results obtained by each station. Besides, by calculating the displacements and obtaining a least square regression, we manage to model the real effect of the earthquake on each site, with the possibility of giving an approximate value of displacement and time of arrival of the seismic wave. This information could be very valuable to reinforce earthquake early warning systems, when using IGS ultra-rapid ephemerides. Once the earthquake is detected, according to the methodology, in the closest GPS station to the epicenter, a prediction of the displacements and time of arrival could be calculated.
3. Analysis
The analysis of the time series is based on the study of different parameters related to time and displacement (normal distribution is plotted on figure 5), obtaining also, from the local geodesic coordinates, the 2-D topocentric displacements (i.e., the horizontal displacement). The studied temporal parameters aim to detect the influence that the earthquake exerts on the time series in local geodetic coordinates. Therefore, what is sought are the moments in which it is appreciated in an unequivocal way that the variation on the time series generated by each station is due to the earthquake (i.e., the main tremor causes an alteration in the series not induced by the errors of the processing strategy), as well as the time values in which the maximum variation in the time series is registered. The latter, when compared with the distance to the epicenter, allows us to see the behavior of the event as the seismic waves evolve throughout the Japanese territory. The displacement parameters characterize the magnitude of the event and are defined from the averages of the time series in the instants previous to the earthquake (from the second 19000). When these averages exceed the threshold value of 3 times the average (value defined for this study), it is considered that the effect of the earthquake is recorded by the station. Likewise, to characterize the evolution of the event, the maximum values of the local geodetic coordinates E and N are used.
Daily (24 hours) RINEX files were processed from 93 stations located in the central and northern regions of Japan, corresponding to the 70th day of the year 2011 (March 11), with a sampling frequency of 1 Hz, covering the entire period of the earthquake (starting at 05:46:23 UTC). GIPSY-OASIS software (Lichten & Border, 1987; Zumberge et al., 1997), version 6.1, is used for processing, using the precise products (Héroux et al., 2001) generated by NASA's Jet Propulsion Laboratory. Specifically, the final ephemeris, calculated for the IGb08 reference frame, were used, refining the models of the phase centers of the receiver and satellite antennas (Schmid et al., 2007). These ephemerides have a latency of14 days and provide 3-D RMS accuracies of 2.5 centimeters in the determination of the position of the satellites of the constellation. The GMF function (Boehm et al., 2007) is used to reduce errors related to the tropospheric delay. The oceanic tidal load model used is FES2014b, whose values are obtained from the website http://holt.oso.chalmers.se/loading/.
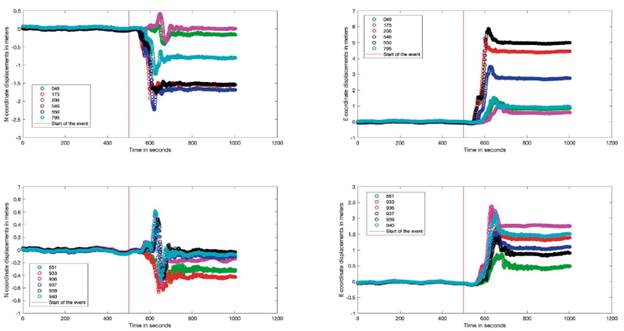
Figure 3 E and N time series corresponding to stations 049, 175, 206, 546, 550, 551, 795, 933, 936, 937 939, 940. The vertical red line marks the beginning of the earthquake. The period represented goes from 500 seconds before the earthquake to 500 seconds after it. Stations distributed along the study area are chosen
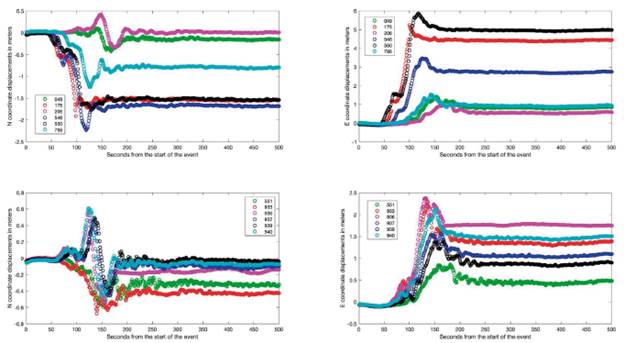
Figure 4 E and N time series corresponding to stations 049, 175, 206, 546, 550, 551, 795, 933, 936, 937 939, 940. The series begin in the instant of the beginning of the earthquake (second 20783 of the day in UTC time), and extends an interval of 300 seconds. The image is represented as a zoom to better appreciate the evolution of the earthquake
The data are processed in kinematic mode using the PPP strategy (Ge et al., 2008; Gao & Shen, 2002; Martín et al., 2012). Kinematic processing is chosen to avoid the effects of precursor events occurring in the hours prior to the earthquake. After the processing, the series corresponding to the geocentric Cartesian coordinates in the IGb08 reference frame are calculated. These series of coordinates are transformed into local geodetic coordinates E, N, U using Matlab software, using first the function "ecef2geodetic" that converts the ECEF (Earth Centered Earth Fixed) coordinates of each station into a reference value in geodetic coordinates (latitude, longitude and height). The time series are then generated in local geodetic coordinates using the "ecef2enu" function (Figure 3). In addition, Matlab will also be used to study the processing results, programming the least-squares regression algorithms in this software.
Different parameters related to time and displacement will be studied on the time series, obtained also, from the local geodesic coordinates, the 2-D topocentric displacements (i.e. the horizontal displacement).
The magnitude of the event is represented with horizontal displacements that in several cases reach meters (Figure 4), showing its attenuation as the stations move away from the epicenter (e.g., there is a large difference between the magnitude of the displacement between stations 206 and 546, whose distances to the epicenter vary by 74 km). The representation of the series corresponding to the different stations also gives an idea of the arrival time of the main shock. The time differences are quantifiable and are parameter to analyze the evolution of the earthquake along the territory. However, this only reflects the propagation of the wave, without allowing to calculate its characteristics or a detailed observation of the rupture process (Ozawa et al., 2011), serving as an initial approximation focused on a quick determination of parameters of interest related to the earthquake, which allows to feed, for example, early warning systems, being, for instance, a verifying element that an earthquake is happening. To obtain rupture models or waveforms from GPS data, more information from other measuring equipment (i.e., seismic equipment) is needed (Zheng et al., 2012).
The positions of the stations represented in Figures 3 and 4, as well as the distances (measured in kilometers) to the earthquake epicenter are shown in Table 1. Table 2 shows the values of the E and N displacements, as well as the displacement modulus. These 12 stations have been chosen as a representation of the study carried out following a criterion of distance to the epicenter. Stations with a wide range of distances ranging from a minimum of 87 kilometers to a maximum of 248 kilometers have been taken, the minimum distances used in the study being 87 kilometers and the maximum 654 kilometers.
Table 1 Location and distance to the epicenter of stations represented in figures 3 y 4
| Station | Latitude | Longitude | Distance (km.) |
|---|---|---|---|
| 49 | 139.5096 E | 38.2307 N | 250.4 |
| 175 | 141.4494 E | 38.6827 N | 89.65 |
| 206 | 139.3643 E | 37.3028 N | 287.73 |
| 546 | 141.5755 E | 39.1431 N | 114.32 |
| 550 | 141.5007 E | 38.3012 N | 75.98 |
| 551 | 139.8489 E | 39.8911 N | 279.01 |
| 795 | 141.4526 E | 39.8490 N | 187.15 |
| 933 | 140.2205 E | 38.6284 N | 190.54 |
| 936 | 140.4468 E | 37.8335 N | 177.15 |
| 937 | 139.9727 E | 37.6693 N | 222.60 |
| 939 | 139.8355 E | 37.4613 N | 242.45 |
| 940 | 140.4640 E | 37.4449 N | 193.80 |
Table 2 E and N coordinates displacement, additionally module of the topocentric 2-D displacement of the stations represented in figures 3 and 4.
| Station | E (m.) | N (m.) | Displacement (m.) |
|---|---|---|---|
| 49 | 0.95 | -0.17 | 0.97 |
| 175 | 4..4 | -1.54 | 4.66 |
| 206 | 0.70 | -0.01 | 0.70 |
| 546 | 2.90 | -1.68 | 3.35 |
| 550 | 5.02 | -1.51 | 5.24 |
| 551 | 0.55 | -0.33 | 0.64 |
| 795 | 1.01 | 0.89 | 1.35 |
| 933 | 1.50 | -0.44 | 1.56 |
| 936 | 1.84 | -0.19 | 1.85 |
| 937 | 1.21 | -0.09 | 1.21 |
| 939 | 1.03 | -0.05 | 1.03 |
| 940 | 1.62 | -0.08 | 1.62 |
The horizontal displacements are obtained from the modulus of the vector resulting from the composition of the displacement vectors E and N in local geodetic coordinates and centered at every station. The horizontal displacement vectors are the result of the difference between the mean values of the time series between the beginning of the day and the second 20783 UTC (instant at which the earthquake occurs) and between the second 21283 UTC and the end of the day (or the end of the records, since some stations stop working due to structural or electrical network damage after the main shock). It is during the 500 seconds after the main shock that peak displacement values are recorded (Simons et al., 2011).
The results show a maximum displacement of 5.02 meters and a minimum value of 0.04 meters in the E coordinate, and a mean value of 1.48 meters and a standard deviation of 0.98 m, while the maximum and minimum displacement values (in absolute value) for the N coordinate are 1.82 meters and 0 meters respectively, with a mean value of 0.58 meters and a standard deviation of 0.50 m. On the other hand, we obtained a maximum 2D topocentric displacement of 5.24 meters and a minimum value of 0.04 meters in the farthest station studied, with a mean value of displacement of 1.62 meters and standard deviation of 1.05 m.
Table3. Maximum, minimum, mean and typical deviation of the results of the temporal series E and N and 2-D displacement, according to D=V(E2+№ ) of the GEONET stations used in the study fixed to a normal distribution. Values are represented in meters.
| Maximum value | Minimum value | Mean | Typical deviation | |
|---|---|---|---|---|
| E coordinate | 5.02 | 0.04 | 1.48 | 0.98 |
| N coordinate | 1.82 | 0.00 | 0.58 | 0.50 |
| 2-D displacement | 5.24 | 0.04 | 1.62 | 1.05 |
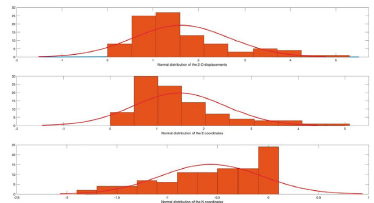
Figure 5 Normal distribution with frequency histograms of the 2-D displacement values, local geodesic coordinate E and N, of the stations comprised in GEONET used in the research.
The resulting vectors are used to generate the field of horizontal seismic velocities. In the areas closest to the epicenter, values up to 5 meters of horizontal displacement are obtained, showing the magnitude of the earthquake. The effects of the mainshock were recorded in GNSS equipments in regions far away from the epicenter (Wang et al., 2011; Feng & Jónsson, 2012).
The co-seismic displacements are an earthquake-specific parameter (Melgar et al., 2013), and decrease as the stations move away from the earthquake epicenter. The decreasing can be studied as a function of time, measured in seconds from the event, as well as distance (Zhan et al., 2013). The attenuation of the earthquake effects is due to the decrease in the amplitude of the surface waves generated by the earthquake. In this way it is possible to quantify the evolution of the event along the Japanese territory.
The surface waves generated at the epicenter of the earthquake dissipate as they travel through the study area. This behavior causes the displacements recorded at the stations (figure 6) to decrease as the distance from the epicenter increases. Plotting the 2D displacement versus distance from the epicenter, data show an exponential decay trend (figure 7). Since the measurements made have the usual errors associated with satellite positioning techniques (e.g., errors due to atmospheric refraction), a least square fit (Deng et al., 2019) is used, using an exponential regression. The goal is to find a curve that minimizes the discrepancy between the real data and the approximation, in order to obtain a model of the attenuation of the co-seismic displacement as a function of the epicentral distance.
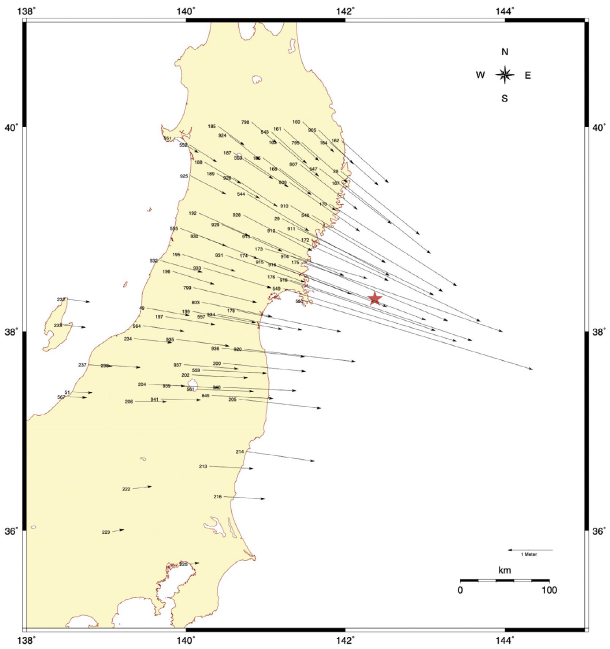
Figure 6 Horizontal velocity field caused by the Tohoku-Oki earthquake, obtained from E and N displacements in local geodetic coordinates.
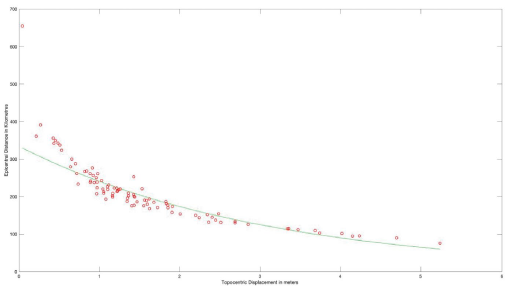
Figure 7 Co-seismic displacement plotted versus distance to epicenter. Data fitted to a least-squares exponential regression: y=aebx. The results obtained are a= 5,8112 and b =-0.3278.
On the other hand, the time value at which the station detects the event is calculated. Due to the precision of the PPP strategy (Szolucha et al., 2018), it is necessary to define a value from which it is considered that the station is detecting a displacement, so that the errors intrinsic to the positioning strategy do not cause the appearance of false positives. For this purpose, the average of the positions of the E, N, U coordinates is calculated from the second 19000 within the day in UTC time, up to the second 20783, instant in which the earthquake occurs. It is assumed that for detection to occur, the values of the local geodetic coordinates must be greater than 3 times the calculated mean, thus ensuring that all positions are already being affected by the displacement resulting from the event.
Unlike the exponential behavior shown by the 2D seismic displacement versus distance to the earthquake epicenter, the representation of the results obtained show a linear trend. Analogously to the previous case, a model that fits the observed data with the smallest possible error is sought. Therefore, a least squared regression is performed to adjust the results to a straight line, obtaining the results shown in Figure 8.
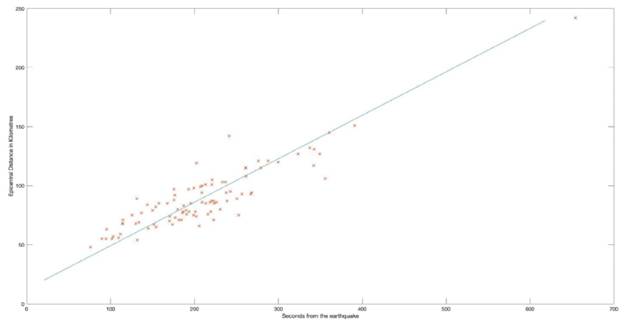
Figure 8 Representation of the epicentral distance of each station versus detection time in seconds from the onset of the earthquake together with the line obtained in the least squares regression. The model fits a straight line according to: y = a x + b, obtaining values of a=2.7179 and b= -33.8587.
Based on the results obtained in the previous processing, it can be observed that the trend of the seismic displacement, caused by the surface waves on their way through the main island, is an exponential decay. However, the time it takes for the station to start recording the effects of the displacement from the beginning of the event, with the rule that the disturbance recorded in the time series of the E and N coordinates is three times higher than the average of the values prior to the beginning of the event, shows a linear character.
Figure 8. Representation of the epicentral distance of each station versus detection time in seconds from the onset of the earthquake together with the line obtained in the least squares regression. The model fits a straight line according to: y = a x + b, obtaining values of a=2.7179 and b= -33.8587.
In addition to the co-seismic displacement, another determining factor is the maximum displacement generated by the earthquake. This value allows us to appreciate the magnitude of the surface waves in the area studied and given that the surface waves that generate the seismic displacement are the same, it is to be expected that the behavior of the maximum displacement will be similar in its evolution as the distance to the epicenter increases. To check the results obtained, the evolution of this magnitude is studied as the distance to the epicenter increases, obtained from the series of E and N coordinates of the network stations.
In order to obtain a better characterization of the event and its evolution, a new time parameter is defined. Once selected the instant in which the station is sensitive to the earthquake, the time value is calculated for all station as well as its maximum displacement values. Again, since these are the same waves, as the distance to the epicenter increases, a similar behavior is expected. The time value in which each station records the maximum displacement is calculated, measured from the moment in which it has been defined that the earthquake is detected (i.e., 3 times the mean value of the local geodetic coordinates) until the instant in which the maximum displacement value is reached.
Following the previous methodology, it is again observed that the displacement undergoes a decay as the station moves away from the earthquake epicenter, following a decreasing exponential pattern similar to when the co-seismic displacement was studied. In the same way, the evolution of the calculated time from detection to the maximum value shows an increase with the epicentral distance with a linear behavior as shown in Figure 9, although this trend is less marked than in the case of the time in which the event is recorded at the station. The least squared regression is calculated for the case of the maximum 2D displacement, fitting to an exponential, whilst time values are fitted to a straight (figure 9).
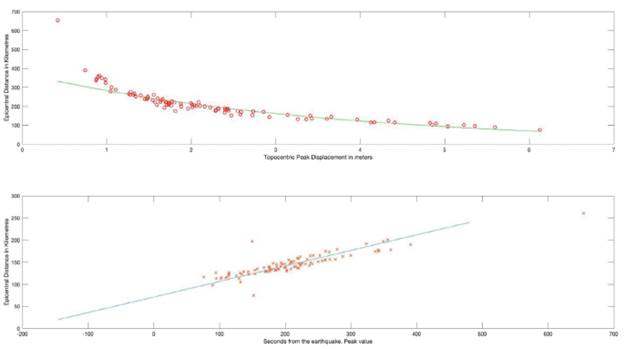
Figure 9 The upper part represents the epicentral distance of each station versus the maximum 2D displacement together with the exponential function obtained in the least squares regression, whose values are: a = 5,9248 and b = - 0.2795. The lower part represents the epicentral distance of each station versus the detection time in seconds of the maximum 2D displacement since the detection of the earthquake together with the line obtained in the least squares regression, whose values are a = 2.8433 and b = - 201.8993.
4. Discussion
In this research a methodology has been designed for the Tohoku-Oki earthquake using only observations from GPS stations of the GEONET network. The PPP strategy is used as it is considered the most appropriate, since the magnitude of the earthquake makes the use of other strategies, such as Double Differences, implies using reference stations located at a great distance from the geodetic network. In addition, given the magnitude of the earthquake and the displacements obtained, the PPP strategy offers enough precision to carry out the research.
Due to the precisions of the PPP strategy in kinematic mode, it is necessary to establish a minimum value, so that the station can be suffering the effects of surface waves generated by an earthquake. For this reason, a value 3 times higher than the mean of the records obtained from the second 19000 to the second 20783 is used as a threshold. As the effects of the earthquake are detected on the series of each station, the evolution of the surface waves can be seen. This wave is responsible for the horizontal displacement in each station, getting lower as the epicentral distance is bigger (figures 10 and 11). When comparing it to the distance to the epicenter, a decay in the magnitude of the displacement is obtained, a logical behavior due to the attenuation the wave undergoes as it moves away from the source. The former is independent from the fact that the ground effect can cause increases in the displacement.
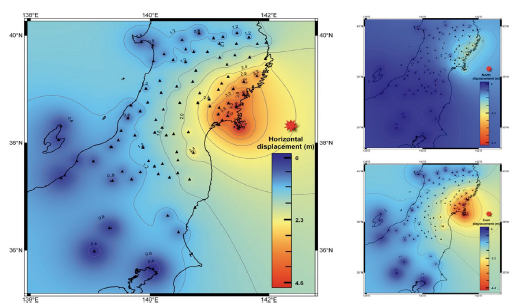
Figure 10 Interpolation map representing coseismic displacement as a result of the processing of the data. 2-D coseismic displacement is represented in the left picture. North coseismic displacement is represented in top right picture and East coseismic displacement is represented in bottom right picture.
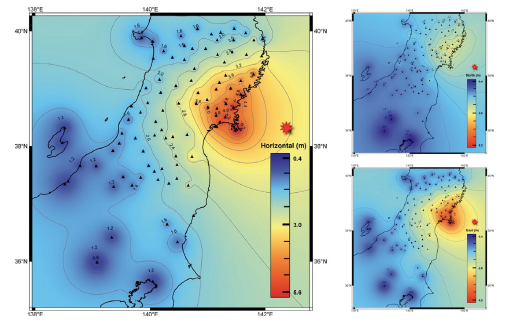
Figure 11 Interpolation map representing the maximum displacement recorded by the GPS stations as a result of the processing of the data. 2-D maximum displacement is represented in the left picture. North maximum displacement is represented in top right picture and East maximum displacement is represented in bottom right picture
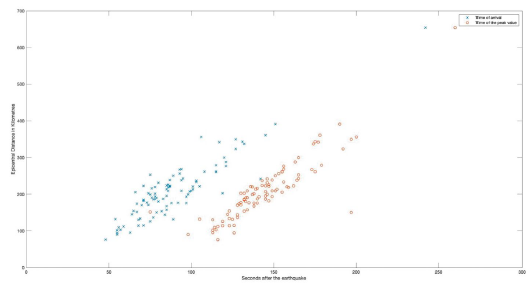
Figure 12 Representation of the earthquake detection times according to the methodology and the time when the maximum displacement is reached. Both values are plotted versus the distance separating the station from the epicenter. A greater dispersion is evident as the epicentral distance increases.
Results provide, in addition to the evolution of the magnitude of the displacement, a view of the detection times (figure 13), establishing a valid threshold for both the detection and the maximum of the shock. This allows us to see the evolution of the surface waves as they travel through the Japanese main island, as well as the variation in time of the effects produced at each station. The applied methodology does not offer a prediction of the event, since there is no continuous processing of the observations, but it does give an approximation of the evolution of the amplitude of the earthquake. In addition, the use of final ephemeris for the calculation of the positioning solution prevents the use of the results for early warning. However, the methodology could be implemented (e.g., in the case of using predicted ultra-fast ephemeris, generated by the IGS) as a verification element that an earthquake is indeed occurring, or in the use of new techniques such as VADASE (Branzanti et al., 2012), an algorithm that can be embedded into the GPS receptor firmware that does not require ambiguity solving. The algorithm is able to estimate in near real time the velocities and displacements in a global reference frame (ITRF), using highrate (1 Hz or more) carrier phase observations and broadcast products (orbits, clocks) collected by a stand-alone GNSS receiver, achieving a displacements accuracy within 1-2 cm over intervals up to a few minutes (Fratarcangeli, F., et al., 2018). The use of three times the mean value of the results obtained during the previous minutes to certificate that the station is suffering the effects of surface waves, is enough to absorb the errors generated in the processing.
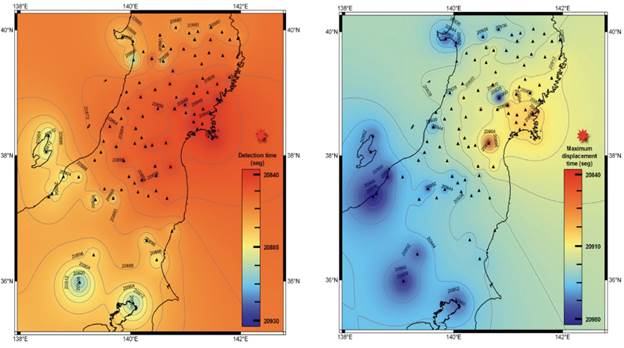
Figure 13 Interpolation map representing the detection time of the event using the methodology implemented in this paper (left picture) and the time when the máximum displacement occurs.
Another parameter studied is the maximum displacement recorded by each station and the time associated with this value. When plotting the data versus the epicentral distance, an exponential decreasing pattern is again observed, also obtaining a model based on a function of the type =ae", representing the attenuation suffered by the earthquake (Lin & Wu, 2010). The attenuation resulting from this study is comparable to the values obtained using other methodologies (Xu et al., 2019), and the results are useful for comparison with prediction models (Gautam et al., 2019).
The displacements obtained in the E and N coordinates show an eastward displacement, consistent with the focal mechanism associated with this event (Lay, 2018). Despite this evidence, the results obtained do not allow us to recreate the model of plate slip originating in the subduction zone, as other techniques (Aris et al., 2016; Linuma et al., 2012) that rely on GPS measurements, mainly due to the distance separating the epicenter from the nearest stations and the fact that data are only available on one side of the rupture zone.
The results obtained in this research are aligned with those obtained using non-geodetic methods. In (Feng et al., 2012), InSAR measurements are used to calculate an interferogram of the coseismic deformation, in addition to using GPS measurements of the GEONET network stations for the correction of the orbital errors of the Earth observation satellites by comparing results. As an example, station 550 obtains a displacement value of 5.03 meters eastward in the E coordinate, consistent with the 5.02 for that same station and coordinate using our methodology.
Both, the event detection times according to the methodology, as well as the maximum 2D displacement values, show a linear behavior when plotted versus the epicentral distance. From the propagation point of view, the displacement velocity of the surface waves can be obtained from the straights calculated in the least squared regression. The epicentral distance is measured in kilometers, and the time in seconds, therefore, the slope of both lines will represent the velocity measured in Km/second. The values are very similar to each other being 2.7179 Km/s when the sensitivity of the station is set to three times the average value of the coordinates corresponding to the 1783 seconds before the earthquake. In the case of the maximum values, the velocity obtained is 2.8433 Km/s, a value lower than that obtained in the implemented methodology.
This variation points to a change in the propagation velocity of the event, whose reasons may be related to changes in the subsurface produced by ruptures derived from the event (Kim et al., 2012), or they may be due to the variation of the elastic properties of the lithosphere that movements induced by the earthquake can generate (Vidale & Li, 2003; Peng & Ben-Zion, 2006), which would justify the greater dispersion of the time values with increasing distance from the epicenter as shown in Figure 12.
The values previously obtained approximate the S-wave velocity, based only on the use of the GPS station displacements for its calculation. On the other hand, only the epicentral distance has been considered when making the calculations, without considering the azimuth to the epicenter. This fact, added to the local characteristics of each soil typology (Morikawa & Fujiwara, 2013), affects the values obtained, so they are approximations that represent the average propagation velocity of the rupture, and similar to those calculated with other methodologies (Zhang et al., 2012), such as those based on the analysis of the distortions recorded in the ionosphere (Astafyeva et al., 2013).
5. Conclusions
This paper presents a methodology to study the 2011 Tohoku-Oki earthquake based only on GEONET network GPS stations observations. PPP strategy has been used for the processing of the geodetic network data, using the Gipsy-Oasis software in its version 6.1. The methodology followed is based on the calculation of the time series of the local geodetic coordinates of 93 stations located in the central area of Japan. From these series, different parameters are calculated. First, the 2D co-seismic displacement is calculated, representing the displacement vectors in Figure 6. These displacement values are plotted versus the epicentral distance, showing a decreasing behavior when moving away from the epicenter, fixing it to an exponential model by a least square regression. The function obtained is used as a law of attenuation of the event.
Next, the moment at which stations detect the earthquake is calculated, when the E and N series deviate more than three times the mean calculated for the moments before the earthquake occurs. The value of 3 times the mean is used to avoid the limits in the precision of the chosen strategy for the process (i.e., PPP or Precise Point Positioning) generate false positives. The time values are plotted versus the epicentral distance showing a linear behavior, with the detection time increasing with the epicentral distance. What motivates the movement of the stations is the surface wave derived from the earthquake or S-wave, therefore the time records allow to calculate the propagation velocity of the wave, calculated as the slope of the straight line obtained after linear least square regression.
Then the values of maximum displacement are calculated, and the time from the beginning of the earthquake they are reached. The same procedure is followed as with the co-seismic displacement and the instant of detection. An exponential behavior is obtained when representing each value versus the epicentral distance, in the case of the maximum of the E and N coordinates, and a linear behavior in the case of the time it takes to reach these maxima. Therefore, with the methodology used it is concluded that the displacements derived from the earthquake decrease with the distance to the epicenter according to an exponential relationship, while the time it takes for the effects of the event to be registered by the stations increases with the distance to the epicenter in a linear trend.
Time parameters are also calculated setting two main cases: time detection of the event and moment of the maximum displacement. Results for the first case are obtained after applying the methodology implemented in this paper. For the maximum displacement time series are analyzed looking for the peak both in E and N coordinate.
Finally, it should be noted that the results obtained can be used as a first approximation for the study of an earthquake, especially of a sufficiently large magnitude so that the displacements generated are much larger than the errors generated by the processing strategy. We found that the PPP accuracy limited us in the way of detecting the event. The presence of values within the E and N geodetic time series higher enough for being considered bigger than the threshold value, but lower for being considered outliers, difficult the detection of the event. With a view to improving the methodology, it is hoped that the introduction of a weighting of the results, when calculating the least square regressions, based on the direction of propagation, will lead to an improvement that will make it possible to refine the attenuation law obtained.
We propose the implementation of the methodology in a less dense net. GEONET is a very rare exception, since there is no other geodetic net like it. To validate the methodology greater distances between stations would be needed, as well as a fewer number of stations. On the other hand, we used final ephemerides for the processing of the RINEX files. In order to use this methodology in support of earthquake early warning systems (Hoshiba, M. et al., 2011), the use of IGS ultra-rapid predicted ephemerides is proposed, as well as the automatic access to GPS data for their processing. By doing so, we approximate to near real time, with the limitations related to data transfer and process burden. Taking this into account, a new issue arouses: isolated areas with no GPRS nor 3g or 4g coverage. This problem could be mitigated by implementing satellite communications, with the increase of costs that it implies.

