


 English (pdf)
 Article in xml format
 Article references
 Send this article by e-mail
 Cited by SciELO
  Cited by Google
  Similars in
SciELO
Similars in
SciELO  Similars in Google
 Permalink
Introduction
The land cover comprises of the naturally occurring (e.g. vegetation, waterbody, topography, rock and soil formations) and anthropogenic elements (water bodies, urban, industrial sites, mine sites) over the surface of the Earth (Düzgün and Demirel, 2011; Foley et al., 2005; Geist and Lambin, 2002). The steady increase of the human population (from 7.7 billion to exceed 10 billion in fifty years, UN 2019) and climate change elevate the pressure on land resources (Meyer and Turner, 1992; Vitousek et al., 1997; Pillay et al., 2014). Land use and Land cover (LULC) changes has certain link with global environmental change (Song et al., 2018).
Scientists from various fields and countries focus on addressing human impact (including vegetation removal, urbanization, quarrying, deforestation, surface mining, road and dam construction, excessive irrigation, groundwater extraction) on the environment and the rate of land transformation ( Gornitz et al., 1997; Williams, 2000; Falcucci et al., 2007; Foley et al., 2005; Mouflis et al., 2008; Düzgün and Demirel, 2011; Mossa and James, 2013; Gill and Malamud, 2017; Meneses et al., 2017; Gül et al., 2019). Land use and Land cover (LULC) changes have the potential to change the Earth energy balance (Song et al., 2018), to change hydrological ecosystem (Yohannes et al. 2011), to fragment and transform the ecosystem (Hong et al., 2011), and to trigger the natural hazards such as flooding, landslides, rock fall and subsidence (Rahman et al., 2011; Mossa and James, 2013; Gill and Malamud, 2017). Land use and land cover changes and some other natural factors rain fall initially responsible for the changes in local temperature, water balance, greenhouse emission (Kalnay and Cai, 2003; Hassan et al., 2021; Tuladhar et al., 2019; Dewan et al., 2021). Those local changes have formed the global effect (Kalnay and Cai, 2003; Reis, 2008; Song et al., 2018; Altürk and Konukçu, 2020; Hong et al., 2021). For this reason, an understanding the local pattern is necessary for realizing the global situation, and to offer local solution for policymakers.
Remote sensing and Geographic Information Systems (GIS) provide useful data not only for detecting, classifying and modeling anthropogenic driven impacts on LULC but also for combining field observations and past changes (Abbas et al., 2010; Alphan, 2003; Chen et al., 2003; Düzgün and Demirel, 2011; Rahman et al., 2021). Particularly, historical time-series of data sets gathered from the satellites enable us to monitor, compare and assess the trends, distribution, intensity, transformation and related changes in LULC. Herold et al. (2011) and Latifovic et al. (2005) state that in order to monitor and assess the rates of degradation, it is essential to combine the historical and present data sets. Considering the lack of past field data, remotely sensed images become an important data source for long-term assessments. Different studies focused on monitoring the change in LULC with the aid of time-series data sets (Mouflis et al., 2008; Dewan and Yamaguchi, 2009; Bullock et al., 2018; Huang et al., 2018).
Several studies were done in Turkey related to LULC, however all of them interest to local region. For example, LULC changes of Adana city (Alphan, 2003), Bandirma town (Atay Kaya and Görgün, 2020), Istanbul city (Çakir et al., 2008), Samsun city (Güler et al., 2007), Trabzon city (Keleş et al., 2008), Rize city (Reis, 2008), Kastamonu (Şen et al., 2018) and Seyhan basin (Zadbagher et al., 2018) have been developed mostly due to urbanization. In addition, a few studies were focused on other reasons such as fragmentation of agriculture areas in Tekirdağ city (Altürk and Konukçu, 2020), agricultural activities in northern Turkey (Şen and Güngör, 2018), forestry areal change (Çakir et al., 2007; Sivrikaya et al., 2007; Keleş et al., 2008; Bozali et al., 2015), surface coal mine area change (Demirel et al., 2011) and coastal zone (Hepcan et al., 2011).
Diyarbakir is one of the biggest cities of Mesopotamia and SE Turkey, show different examples of the LULC. Urbanization was generally taken into consideration, especially in old town section of the city (i.e., Suriçi) (Koç and Aykal, 2018; Sinemillioğlu et al., 2010; Kuzucuoğlu and Karadoğan, 2015). Other satellite image analysis-based studies in the study area have concrete objectives and examined at changes through the lens of a single factor. Among those limited studies, one only examines the changes in irrigation-agricultural areas (Bayraktar and Bayram, 2007), while the other is concentrated on the surface temperature changes due to natural and increasing urbanization (Oğuz, 2007). Since their assessments are mostly on the specific sections of the city, they do not provide sufficient data for evaluation of overall intensity, types, or rate of human-induced activities on the LULC.
Considering the modifications in LULC of the city in the last 50 years, it has become necessary to assess the rate, types, trends and distribution of human-induced changes in LULC. Moreover, sustainable city planning is required certain determination of LULC. The study area was chosen due to ongoing mining activities, urbanization, and massive population growth, which increased significantly during the 2000s. The lack of studies on the impacts of human-induced activities on the land adversely affects the planning and the land conservation policies of this growing city.
This study is an initial attempt to show the effects of the most common anthropogenic factors in Diyarbakir province. The present study was performed to describe, classify, and analyze the interactions of the selected anthropogenic factors with LULC of the Diyarbakir city. The study is aimed to (i) define the most effective agent in terms of alteration of the lands of the study area; (ii) discuss the environmental issues in order to understand the degradation process and (iii) correlate the present and past impacts of human-induced activities on the LULC. The obtained results would guide policymakers to improve future planning strategies and to protect the lands of Diyarbakir city against degradation.
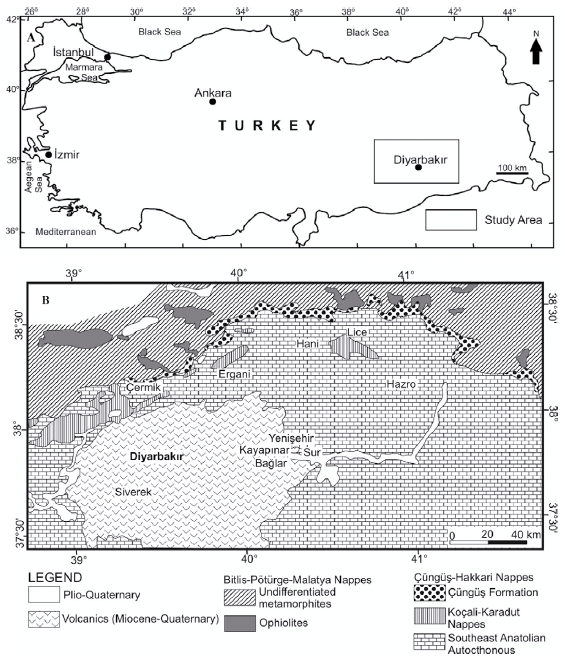
Figure 1 (A) Location map and (B) simplified geological map of the study area (modified from Toprak, 2012)
Study Area
The study area covers an area of 15401 square kilometers, is located in the SE part of Turkey and is limited to the Diyarbakir city province (Figure 1A) (Between 37o30'-39o00' latitude and 39o00'-41o30' longitude). Situated on the west bank of the Tigris (Dicle) River, Diyarbakir city is a characteristic example of a geographical region that bears the traces of various civilizations starting from prehistoric to modern times. The remains and artifacts of the old civilizations can be found all around the city. There are over one hundred registered monuments and cultural properties located in the old town of Diyarbakir, including but not limited to the castle, palace, churches, mosques and city walls. The city walls was acknowledged a status of World Heritage Site by UNESCO in 2015 (Dursun and Topal, 2019). In the last decades, the city has witnessed a massive expansion as a result of population growth and rapid urbanization. As a result, various anthropogenic factors have caused changes in LULC of the Diyarbakir city. Diyarbakir and the surrounding region contain various aged allochthones and autochthones units (Figure 1B). Undifferentiated metamorphic units of the Bitlis-Pötürge-Malatya Nappes mainly contains marble and lesser extent augen gneiss, biotite gneiss, amphibolite, quartzite, albite, garnet schist and muscovite schist. Ophiolite nappes of the Bitlis-Pötürge-Malatya Nappes include Campanian-Maastrichtian serpentinized diabase, dunite, pyroxenite, gabbro and basalt.
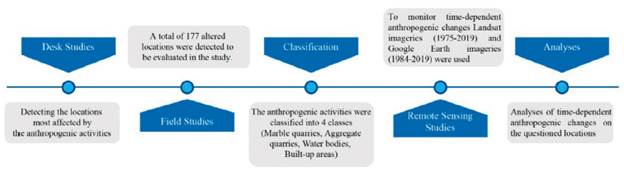
Table 1 Acquisition information of the satellite images used in the present study
| Path/row | Acquisition date | Sensor | Spacecraft | Path/row | Acquisition date | Sensor | Spacecraft |
|---|---|---|---|---|---|---|---|
| 185/33 | 1975-07-15 | MSS | Landsat_2 | 185/34 | 1975-09-07 | MSS | Landsat_2 |
| 186/33 | 1975-08-03 | MSS | Landsat_2 | 186/34 | 1975-06-28 | MSS | Landsat_2 |
| 172/33 | 1985-07-09 | TM | Landsat_5 | 172/34 | 1985-07-09 | TM | Landsat_5 |
| 173/33 | 1985-06-14 | TM | Landsat_5 | 173/34 | 1985-06-30 | TM | Landsat_5 |
| 172/33 | 1990-07-23 | TM | Landsat_5 | 172/34 | 1990-08-24 | TM | Landsat_5 |
| 173/33 | 1990-08-15 | TM | Landsat_5 | 173/34 | 1990-07-30 | TM | Landsat_5 |
| 172/33 | 1995-07-05 | TM | Landsat_5 | 172/34 | 1995-07-05 | TM | Landsat_5 |
| 173/33 | 1995-08-13 | TM | Landsat_5 | 173/34 | 1995-07-28 | TM | Landsat_5 |
| 172/33 | 2000-07-02 | TM | Landsat_5 | 172/34 | 2000-06-16 | TM | Landsat_5 |
| 173/33 | 2000-07-25 | TM | Landsat_5 | 173/34 | 2000-07-25 | TM | Landsat_5 |
| 172/33 | 2005-07-16 | TM | Landsat_5 | 172/34 | 2005-08-17 | TM | Landsat_5 |
| 173/33 | 2005-08-24 | TM | Landsat_5 | 173/34 | 2005-07-23 | TM | Landsat_5 |
| 172/33 | 2010-07-30 | TM | Landsat_5 | 172/34 | 2010-07-30 | TM | Landsat_5 |
| 173/33 | 2010-07-05 | TM | Landsat_5 | 173/34 | 2010-08-22 | TM | Landsat_5 |
| 172/33 | 2015-07-28 | OLI | Landsat_8 | 172/34 | 2015-07-12 | OLI | Landsat_8 |
| 173/33 | 2015-07-19 | OLI | Landsat_8 | 173/34 | 2015-07-19 | OLI | Landsat_8 |
| 172/33 | 2019-08-08 | OLI | Landsat_8 | 172/34 | 2019-08-08 | OLI | Landsat_8 |
| 173/33 | 2019-07-30 | OLI | Landsat_8 | 173/34 | 2019-07-30 | OLI | Landsat_8 |
The Koçali-Karadut Nappes contains the Jurassic-Cretaceous Koçali Complex including cherty limestone, diabase, conglomerate, radiolarite, marble, agglomerate and ophiolite units, and the Upper Cretaceous Karadut Complex containing shale, clayey limestone, limestone and chert. The Çüngüş Formation, which is member of the Çüngüş-Hakkari Nappes, is made up of Eocene-Miocene shale, marl and sandstone. The Southeast Anatolian Autochthone includes Eocene-Oligocene conglomerate-sandstone-shale alternation, limestone, marl, dolomitic limestone (Midyat Group), Lower-Middle Miocene conglomerate-sandstone-siltstone, and locally evaporate-lacustrine limestone, reef limestone, sandstone, sandstone-siltstone, marl (Silvan Group) and Middle-Upper Miocene shale-sandstone-siltstone, sandstone and conglomerate (Şelmo Formation). All of those older units were unconformably overlain by the Plio-Quaternary deposits including Karacadag volcanics, river terrace and alluvial deposits (Figure 1b) (Bağirsakçi et al., 1995; Ercan et al., 1991; Genç, 1985; Lustrino et al., 2010; Şaroğlu and Emre, 1987; Sütçü, 2008; Toprak, 2012; Yilmaz and Duran, 1997).
Material and Methods
The methodology steps used for this study are shown in Figure 2. Firstly, field studies were conducted to observe and identify the most common and ongoing degraded areas. A total of 177 locations have been selected for investigation. These 177 locations were examined within the scope of this study and visited to investigate their properties such as: GPS coordinates, boundaries, destruction conditions, and the human-induced activity type. Such properties have been determined for every single location investigated through the present study. Following the field studies, 177 locations with anthropogenic degradation were identified. These locations are grouped under four classes according to the anthropogenic activities causing degradation. In order to assess the previous conditions and to determine the evolution of the anthropogenic degradation in topography over the last 45 years, the selected locations were retrospectively monitored with the aid of remotely sensed data. Remote sensing techniques were applied to a Landsat time series and Google EarthTM imagery.
Changes in land use and land cover (LULC) have become a significant and essential component of existing strategies for monitoring changes in the landscape and managing natural resources (Kumar et al., 2014; Rawart et al., 2013). The European Commission has developed The Coordination of Information on the Environment (CORINE) Program to create an integrated GIS on the state of the environment within the European Union (Moos and Wyatt, 1994). European land cover data can be easily obtained from the CORINE database. In order to utilize the Landsat and Google EarthTM time series of Diyarbakir, a number of digital image processing techniques and post classification comparison change detection (PCCCD) were applied for the years 1975, 1985, 1990, 1995, 2000, 2005, 2010, 2015, and 2019. The Acquisition dates and related information of the satellite images used in the current study can be seen in Table 1.
It is well known that various anthropogenic factors affecting the lands of Diyarbakir city include but not limited to deforested areas, vegetation removal, surface material extraction, water reservoirs, road constructions, built-up areas and degradations of arable lands. Considering their scale, distribution and overall impacts on land, four different land use classes that are highly common in the study area were used for LULC maps and PCCCD. These are classified as follows:
Marble Quarries (MQ) - Include marble quarries that currently in operation or abandoned.
Aggregate Quarries (AQ) - Include legal and illegal stone quarries that currently in operation or abandoned.
Water Bodies (WB) - Include human made water structures (dams, hydroelectric power plants, artificial lakes and ponds).
Built-up Areas (BA) - Include residential, commercial, educational, industrial or governmental areas.
Here, it is important to note that, for reasons such as economic conditions, lack of industrialization, and low immigration rates, the degree of urban expansion remains very limited in the districts of Diyarbakir. Hence, most of the BA elements were concentrated mainly in the central zones of the city. Therefore, in the present study, only areas covering the city center (a total of 33 locations) were analyzed in the BA class. Here, it is worth mentioning that although the marble quarries and aggregate quarries can be categorized as surface mining activities, they have been examined in two separate classes because their areas of influence and the way they degrade the land are different.
Following the determination of the classes during the field surveys, a total of 177 locations covering these classes were selected and their coordinates were specified. Then the changes that occurred in these 177 locations between 1975 and 2019 were determined and discussed. It is vital to note that the 177 locations were selected based on the field surveys and observations on visual impacts of the activities. These are representing the impact of recent anthropogenic activities on land.
Multi-temporal Landsat data and high-resolution Google EarthTM data for the years 1975 to 2019 were used to determine the anthropogenic changes caused by mining, urbanization, and water reservoirs. For assessing the previous land cover classes of 177 locations, the CORINE land cover (CLC90-land cover map for the year 1990) map of the study area was utilized as the base land cover map. The class of the 177 points determined was established using the CLC90-land cover map for the year 1990. The land use changes through time and the classifications of these places on the CLC map were determined. Imagery from the Landsat 2 Multispectral Scanner System (MSS) (1975), Landsat 5 Thematic Mapper (TM) (1985, 1990, 1995, 2000, 2005, and 2010), and Landsat 8 Operational Land Imager (OLI) (2015 and 2019) were obtained from the United States Geological Survey (USGS) website (https://earthexplorer.usgs.gov/). Landsat images on path/row 172/33, 172/34, 173/33, and 173/34 have been downloaded for the selected years. The Google Earth imagery data from 1984 to 2019 were acquired from Google EarthTM software. Preprocessing procedures are required to acquire and evaluate spectral data which are spatially-radiometrically adjusted images. Firstly, the layer stacking process was used in used Landsat bands. Then radiometric calibration was performed to stacked bands. The four scenes of each year mosaicked and subset to the border of the study area. Digital image processing was carried out using Envi and ArcGIS softwares.
Post Classification Comparison Change Detection
Post classification comparison change detection is a method for identifying and quantifying variations in the area from multi-temporal imagery (Gillanders et al., 2008; Singh, 1989). By evaluating a satellite imagery data set, this land surface monitoring technique, depending on the scale of the images utilized, provides an efficient means of measuring change at the landscape or national scale (Cohen and Goward, 2004; Wulder et al., 2004). To detect anthropogenic changes in the Diyarbakir, post classification comparison change detection was performed on land cover (LC) maps produced from Landsat images of each selected year. Landsat true color composites used for post classification comparison change detection. Landsat images were preprocessed and mosaicked in Envi before being imported into ArcGIS. Landsat satellite images from 1975 to 2019 and Google EarthTM images from 1985 to 2019 were used to examine locations corresponding to each land use class (i.e., AQ, MQ, BA, WB) defined by field investigations. The main goal of this stage is to detect the amount of change in land use at 177 locations over time. Landsat images from 1975 to 1985, as well as Landsat and Google Earth TM images from 1985 to 2019, were used to assess land use changes and delineate boundaries in these locations. The boundaries of the areas determined by field studies were generated for each class in ArcGIS using satellite images from the specified years. The area of each polygon was calculated by the attribute table of each layer. Thus, areal changes in each location were determined by years. The previous land cover of these 177 locations was determined using the CLC map of the study area. These results were then used to compute the trend, net change, percent change and rate of each land cover class between the years 1975 and 2019.
Results
The observed changes for the categorised activities have been described based on their number, distribution, expansion, and previous land cover conditions following image processing. Figure 3 depicts the LULC changes in the examined classes in Diyarbakir from 1975 to 2019, based on changes detected by Landsat imagery analysis. Table 2 shows the spatial extent and location numbers of these changes. Figure 4 depicts the most extensive locations based on monitored classes.
Anthropogenic changes at class level
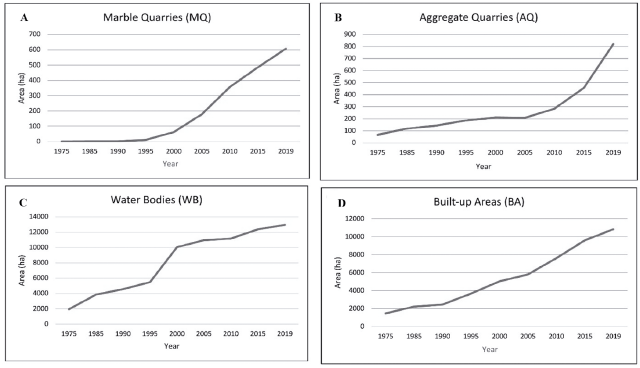
As it can be followed from the Figure 5A over the forty-four years, there was an aggressive increase in the lands occupied by MQ activities (Figure 5A). The total land area under this class was 2 ha in 1975. The area covered by MQ has increased to 607 ha in 2019 (Table 2). This change highlights an increase of 30250 percent, a net increase of 605 ha, and an annual average expansion rate of 13.7 ha over the studied forty-four years.
The increase in the number of opened MQ between 1975 and 2019 validates the increase in the size of the lands transformed by this activity for the same period. The highest increase in the size of the MQ is observed in the years between 1995 and 2010. During this period, the areas occupied by MQ have increased from 11 ha to 357 ha (Table 2).
This change demonstrates an increase of 3145.4 percent, a net increase of 346 ha, and an annual average expansion rate of 3 ha over the observed 19 years. Considering their distribution, most of the MQ are located in the north section of the study area. Of the monitored 49 MQ, the most expanded one is located in Hani District (MQ-4) (Figure 4). The quarry was first monitored in the year 2000, with a land area of 15 ha; at the end of 2019, it is found that the land area covered by this quarry has increased to 72 ha with an increase of 380 percent, a net increase of 57 ha, and an average annual expansion rate of 3 ha.
AQ class is another human-induced activity studied through the present paper (Figure 5B). In the year 1975, the total land area under this class was 67 ha but it has increased to 819 ha in 2019 (Table 2). This modification indicates an increase of 1122.3 percent, a net increase of 752 ha, and an average annual expansion rate of 17 ha of the land transformation during the studied years of 1975 to 2019. The highest increase in the AQ class is monitored in the years between 2005 and 2019. According to the results, during the mentioned period, the areas occupied by such quarrying activities increased from 208 ha to 819 ha, which illustrates an increase of 293.7 percent, a net increase of 611 ha, and an average annual expansion rate of 43.6 ha of the land converted to AQ over the 2005 and 2019. The spatial distribution of the AQ is roughly uniform. Most of the quarries have been opened through the northeast and northwest sections of the city. Of the monitored locations for the years spanning 1975 to 2019, the most expanded location for the AQ class is the one located in the Ergani District (AQ-54) (Figure 4). This quarry site produces raw material for a cement factory, located some 10 kilometers north of the site.
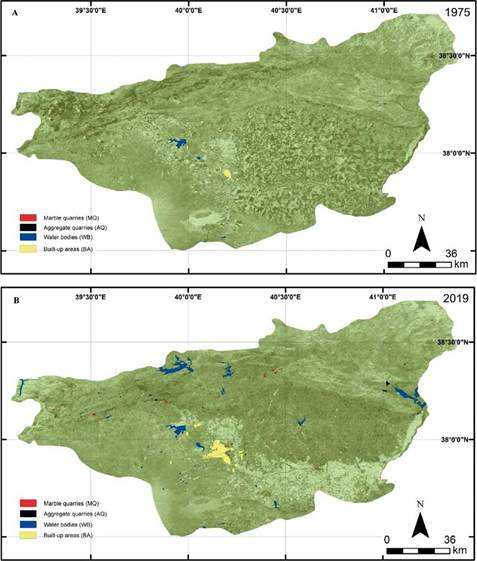
Figure 3 Landsat satellite images showing the land cover status of 177 locations in (A) 1975 and (B) 2019
Table 2 Change detection statistics at class level (in hectares)
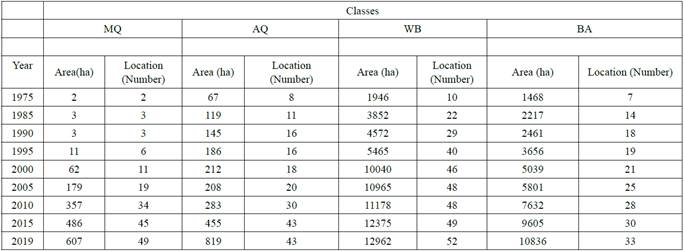
MQ: Marble Quarries; AQ: Aggregate Quarries; WB: Water Bodies; BA: Built-up Areas
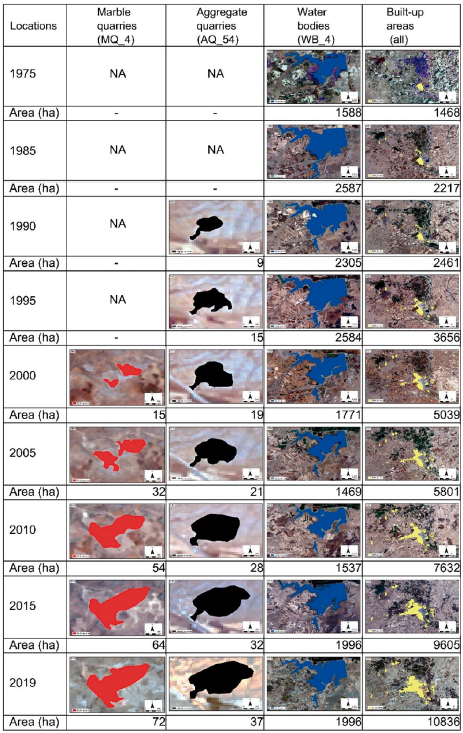
In size, WB is the most expanded class among the studied anthropogenic activities (Figure 5C). It is found that the lands covered by the WB have increased from 1946 ha in 1975 to 12962 ha in 2019. This change implies an increase of 566.1 percent, a net increase of 11016 ha, and an average annual expansion rate of250.3 ha of the land transformation over the studied years of 1975 and 2019. The most dramatic changes in water bodies class are monitored in the years between 1990 and 2000 (Figure 5C). Based on the results, during the mentioned period, the areas occupied by WB increased from 4572 ha to 10040 ha, which demonstrates an increase of 119.6 percent, a net increase of 5468 ha, and an average annual expansion rate of 546.8 ha of the land transformed to WB over the 1990 and 2000. Considering the overall trend of the distribution, while most of the artificial lakes and ponds accumulate at the south and southwestern sections; dams and hydroelectric power plants constructed through the north and east parts of the study area. During the studied time series, the most expanded location for the WB class is found as Devegeçidi Dam, located ca. 25 kilometers northwest of the city center (WB-4) (Figure 4).
Through the present study, the differences in BA activities of 33 locations in the city center were analyzed for the years between 1975 and 2019. The measurements make it possible to reveal significant growth in BA class with respect to a time interval (Figure 5D). The extent of the lands covered by BA in Diyarbakir city center was 1468 ha at the end of 1975, then it becomes 10836 ha in 2019 (Table 2). This change highlights an increase of 638.1 percent, a net increase of 9368 ha, and an average annual expansion rate of 213 ha. The most dramatic increase in BA occurred in the years between 2000 and 2019 (Figure 5D). Over the mentioned years, the lands occupied by BA increased from 5039 to 10836 ha, which indicates an increase of 115 percent, a net increase of 5797 ha, and an average annual expansion rate of 305.1 ha of the land transformed to BA over the years 2000 and 2019. The expansion of the city during the years of 1985-1995 mainly occurs in the west section of the city center, Baglar District, where most of the BA elements are occupied by squatters. In the year 2000 and beyond the lands converted to BA in Diyarbakir city center have expanded aggressively, resulting in dense urbanization, mainly through the northwest section of the city, Kayapinar District. Since then, Kayapinar became the main expansion ax of Diyarbakir city, where most of the BA are characterized by residential and commercial buildings.
The most significant land cover changes
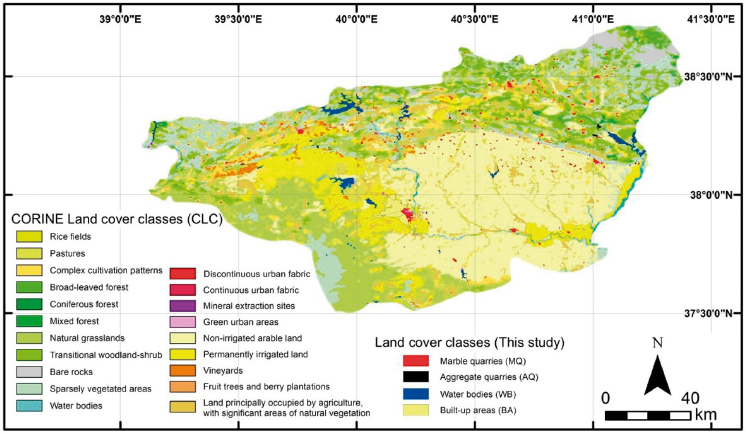
In order to assess previous land conditions of the studied classes, the previous land cover classification of the CORINE has been analyzed. The land cover distribution of the study area has been mapped as shown in Figure 6, and its spatial extent and location for the studied classes are given in Table 3.
Table 3 Changes in land cover (location and area) for the studied area and CORINE land cover classes (in hectares)
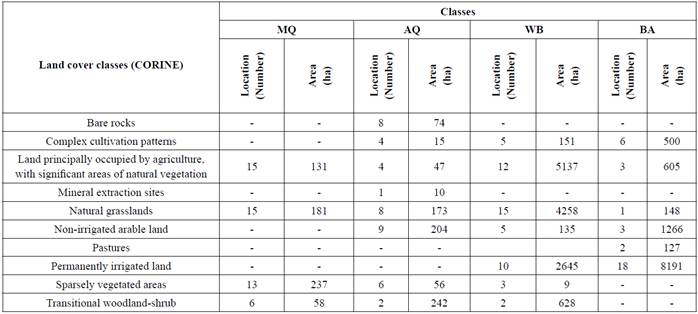
MQ: Marble Quarries; AQ: Aggregate Quarries; WB: Water Bodies; BA: Built-up Areas
It is clear from the Table 3 that 39 percent (237 ha) of the total land modified by MQ activities (607 ha) was previously covered by the "sparsely vegetated areas", 29.8 percent (181 ha) by the "natural grasslands" and 21.5 percent (131 ha) by the "land principally occupied by agriculture, with significant areas of natural vegetation" based on the land cover classification. It is also found that 87.7 percent of locations assigned as MQ were opened mainly over the vegetation and agricultural land (Table 3).
Considering the previous land cover of the total areas occupied by AQ class (819 ha), a 29.5 percent (242 ha) of the lands previously was covered by the "transitional woodland-shrub", a 24.9 percent (204 ha) by the "non-irrigated arable land" and a 21.1 percent (173 ha) by the "naturalgrasslands" (Table 3). On the other hand, it is found that 58.1 percent of the AQ locations were opened in the "non-irrigatedarable land", "naturalgrasslands" and the "bare rocks". Here, it is worth pointing out that the lands covered by the "bare rocks" have been only transformed by AQ activities. As can be seen in Table 3, 9 percent (74 ha) of the total area dominated by AQ activities have taken place in the "bare rocks" class.
It is clear from the Table 3 that 39.6 percent (5137 ha) of the total land modified by WB activities (12962 ha) was previously occupied by the "land principally occupied by agriculture, with significant areas of natural vegetation", 32.8 percent (4258 ha) by the "natural grasslands" and 20.4 percent (2645 ha) by the "permanently irrigated land". It has also been found that 71.1 percent of locations assigned as WB were distributed over the same land cover classes (Table 3).
Considering the previous land cover of the total areas occupied by BA class (10836 ha), a 75.6 percent (8191 ha) of the lands previously was covered by the "permanently irrigated land", 11.7 percent (1266 ha) by the "non-irrigated arable land" and a 5.6 percent (605 ha) by the "landprincipally occupied by agriculture, with significant areas of natural vegetation" (Table 3). Moreover, it is found that 72.7 percent of the BA locations were constructed in the "permanently irrigated land" and "complex cultivation patterns", based on the land cover classification (Table 3).
Discussion
Considering the total areal change over the past forty-four years, it is understood that a total area of 25224 ha of land has been modified with an average annual expansion rate of 573.2 ha over the 177 locations in Diyarbakir. The 51.3 percent (12962 ha) and 42.9 percent (10836 ha) of the total modified lands are WB and BA respectively. The AQ and MQ are responsible for 5.6 percent (1426 ha) of the total modification.
The WB activities can be attributed to dams, hydroelectric power plants, ponds and canals, which have been built in order to control, store and supply water for energy production and irrigation. The variations in the water level of WB elements and irrigation periods have a direct impact on the spatial extension of the WB elements. The satellite images were captured in May-June when the water level of WB elements is increasing and covering nearby areas. WB class recorded its most upward trend in the years before 2000 due to "Southeastern Anatolia Project (GAP) and continued at a relatively stable trend in the years after 2000 (TCKB 2012).
The BA modifications can be attributed to the extensive migration from rural remote areas to the city center, population and the need for additional settlements. The population of the Diyarbakir has barely trebled in 50 years and increased from 581.208 in 1975 to 1.756.353 in 2019 (TÜİK, 2019) due to natural (e.g., topography, unfavorable soil conditions and being at the riverside) and anthropogenic factors (e.g., surrounded by city walls, industry and military areas). Most of the BA elements, especially those constructed in the last decade are characterized by residential (Kayapinar District), commercial and industrial structures (Yenisehir District, See: Figure 1). Prior to urbanization, these zones were less populated and were mostly covered by "permanently irrigated land". The BA class includes infrastructures such as underground passages and bazaars, water supply networks, shelters, sewerage systems, that cannot be detected by the satellite images.
Urbanization increases the demand for construction materials such as aggregates and stone blocks. Despite a general trend of increase in the size of AQ, a minor reduction of the expanse was monitored between 2000 and 2005 (Table 1). This decrease observed in the size of the AQ activities may be attributed to the status of the quarries as ceased or abandoned in that period. Although there was no increase in the number of AQ between 2015 and 2019 (43 quarries), significant changes were observed in the size increase (364 ha). Another degradation impact can be associated with the type of excavated rock material. Although the number of AQ opened in basalt has increased in the last decade, most of the AQ in the study area have been opened in limestone beds.
The aggressively increasing of marble quarries in the last three decades threatens the LULC in Diyarbakir city. Those quarries have been excavated in Lower Miocene reef limestones (Bagirsakçi et al., 1995; Erdogan and Yavuz, 2002) in Hani, Çermik, Hazro and Ergani Districts (Figure 1). The increase in the number of MQ is highly related to the demand for construction material in the region and export as a natural stone to Asia, Europe, Middle East and the United States, (especially after 2005). Varol, Aydin and Ayhan (2019) point that between 2004 and 2018, the exported marble products account for approximately 45 percent of total export revenues of Diyarbakir, and 3 percent of the total marble export revenues of Turkey. According to field surveys conducted on quarry sites, MQ seem to be responsible for the removal of topsoil and subsoil, deforestation, agricultural land degradation, massive holes, slope modification, and waste sites.
In Diyarbakir, a total of25224 hectares of land in 177 locations has been modified based on the studied and CORINE's land cover classes shown in Tables 1 and 2. 42.9 percent (10836 ha) of this modification was previously "permanently irrigated land", which were modified by WB (75.6 %) and BA (24.4 %). The "land principally occupied by agriculture, with significant areas of natural vegetation" is the second land cover class (5920 ha-23.5% of the total land modification, Table 2) that highly modified over anthropogenic activities. It is noteworthy that, this land cover class has been modified by all the studied classes, mostly by WB (86.8 %) and BA (10.2%) activities. The "natural grasslands" is the third highest alteration land (4760 ha-23.5% of the total land modification, Table 2). This class has been mostly modified by the WB (89.4 %) and MQ (3.8%) activities. In an attempt to compare the outputs of the present study to the nearby provinces, the literature was reviewed. Unfortunately, apart from a few studies (Akay and Sertel, 2016; Özcan et al., 2018) (focusing mostly on limited periods and specific effects), nothing has been reported on anthropogenically driven impacts on the lands of nearby provinces.
Under the comprise of this study, based on LULC, four class WB, BA, AQ and MQ were evaluated. Other studies more or less preferred similar classes; in addition, agriculture, forest and rarely industry were also taken into consideration in Turkey (Alphan, 2003; Sivrikaya et al., 2007; Çakir et al., 2008; Keles et al., 2008; Reis, 2008; Bozali et al., 2015; Altürk and Konukçu, 2020; Atay Kaya and Görgün, 2020). The land modification due to natural and anthropogenic effects were also discussed in detail by the previous studies in different countries (Roberts, 1989; Gollin et al., 2016; Roberts, 1989; Wu and Zhang, 2012; Yang and Cai, 2003; Akinyemi and Mashame, 2018; Matlhodi et al., 2019; Obiahu et al., 2021; Liaqat et al., 2021).
Hydrological system variations, such as river discharge, surface runoff, flooding, water supply, and land cover changes due to dam reservoirs, are addressed in various water-related LULC studies. As seen in the Botswana, the seasonal fluctuation of WB activities may not be permanent and may revert to the previous land cover (Akinyemi and Mashame, 2018; Matlhodi et al., 2019). Furthermore, LULC changes are responsible for Bangladesh's increasing floods (Rahman et al., 2021). Those changes including anthropogenic factors, compositions of natural vegetation and grassland were also change the ecosystem and hydrological system (freshwater supply, water quality and flood) in Ethiopia, at least controlled landscape decrease the erosion and decrease the sediment input to the river (Yohannes et al., 2021). Similarly, besides the climate change, LULC changes can increase the uncertainty of hydrological variability in catchment area of river including runoff and natural recharge process and evapotranspiration (Tuladhar et al., 2019). Some of the water body like in Diyarbakir in SE Turkey is built on the rivers flowing across borders (Tigris and Euphrates flow in Syria and Iraq). Thus, the changes in those bodies have related to neighboring countries.
Population blooming as in Diyarbakir may also significantly control land use change. Dependently the impact of economic growth and industrialization on urbanization like in China has been widely discussed in the literature (Gollin et al., 2016; Roberts, 1989; Wu and Zhang, 2012; Yang and Cai, 2003). Economic and social development of the regions like in Ebonyi state in SE Nigeria promote population increase and thus rapid transformation of the LULC pattern (Obiahu et al., 2021). Urbanization has also effects on the land degradation such as decreasing of green area and lowering of groundwater, thus strict monitoring is required for better understanding the adverse effect of LULC (Liaqat et al., 2021). Urbanization sourced LULC documented in some big cities of Turkey, such as Adana (Alphan, 2003), Tekirdağ (Altürk and Konukçu, 2020), Bandirma (Atay Kaya and Görgün, 2020), Samsun (Güler et al., 2007), Istanbul (Çakir et al., 2008), and Rize (Reis, 2008). Their results show that significantly increasing in urbanization area. The increasing of urbanization causes to decrease in agriculture and forest areas (Reis, 2008; Altürk and Konukçu, 2020; Atay Kaya and Görgün, 2020).
Quarrying operations have a negative influence on the environment at several stages of the process, including as exploration, blasting, excavation, crushing, transportation, and waste disposal (Ashmole and Motloung, 2008). Siddiqui and Jain (2021) proposed that mining activities are the main factors for LULC in Jharia coalfield in India. Pollution hotspots due to marble quarry activities including sawdust, marble debris, sludge have been studied using the GIS in Mohmand Marble Zone in Pakistan (Fawad et al., 2021). They reported that the marble waste threatens the flora and fauna healthy in both aquatic and terrestrial environments. As a result of the type of excavated material (limestone) and the increase in the number of marble and aggregate quarries, the negative impact of AQ and MQ operations on Diyarbakir's LULC escalates and spreads. These quarries also cause slope modification, holes, and scars, making occupied land prone to geohazards, as highlight by Mossa and James (2013). MQ activities, on the other hand, have an impact not only on the site where quarrying operates, but also on the land nearby (Castro-Gomes et al., 2012; Werner et al., 2019). Considering the components of the quarrying activities and location of the quarry sites in the study area (Figure 3), most of them occupied and modified additional land for different purposes (e.g., tailing dams, access roads, water storage ponds, block cave areas, waste rock dumps and housing for workers) to excavate, deposit and transport the material. The type of excavated rock material is also important considering the degradation rate of the land. Drew, Langer and Sachs (2002) discussed in their study and revealed that quarrying activities operated in a sedimentary rock like limestone may disturb the land cover more than a magmatic one such as granite or basalt. In some LUCL analysis, vegetation and urbanization have reverse relations, an increase of urbanization in the Nile Delta of Egypt cause decreasing in vegetation and also led to high land surface temperature development (Abd El-Hamid, 2020).
Urbanization, industrialization (plants, mining activities, etc.), mismanaged agricultural activities, and deforestation are all human impacts that disrupt the ecohydrological system (Yohannes et al., 2021). It is known that the impact of humans on the landscape varies by region. While forest areas increase in the Arctic and alpine terrain, dry and semi-arid regions see a decline in vegetation. Furthermore, it has the potential to create local extreme temperature variations (Hassan et al., 2021), resulting in frequent and severe floods (Rahman et al., 2021). Additionally, LULC and agricultural activities (e.g., crops and livestock) are significant sources of greenhouse gas emissions that must be regulated under the Paris Agreement (Kalnay and Cai, 2003; Hong et al., 2021). LULC is both a cause and a consequence of global environmental change (Song et al., 2018). They are impacting the Earth's energy balance, as well as the climate, hazards, and ecosystems both locally and globally (Reis, 2008; Song et al., 2008; Altürk and Konukçu, 2020; Hong et al., 2021; Yohannes et al., 2021; Yohannes et al., 2021). For efficient environmental protection, sustainable development, and the supply of necessary information to decision makers, time-series trend analysis and continuous monitoring of LUCL and future mitigation are needed (Alqurashi and Kumar, 2013; Baynard, 2013; Abd El Hamid, 2020; Fawad et al., 2021; Hassan et al., 2021).
Conclusions
A set of satellite images covering the years 1975 to 2019 were used to examine the effects of human-induced activities in Diyarbakir. Based on the findings, it can be inferred that the Diyarbakir lands have been significantly modified over the last forty-four years.
The findings indicate that WB, BA, MQ and AQ have been responsible for the vast majority of land degradation activities. WB and BA, it is understood, are two significant classes that have expanded dramatically over the years studied. The 94.2 percent of total land modification is attributed to these two classes. Although the WB class has the largest proportion of land modifications (51.3 percent), it should be noted that this proportion is not constant and may change depending on seasonal fluctuations in water level. In light of such factors as rural-to-urban migration, rising population, the need for additional construction space, poor land use planning, and the impact of seasonal fluctuations on the size of lands occupied by WB activities, it can be concluded that the BA class is the most effective agent that will continue to transform the lands of the study area in the future. It is essential to enforce planning regulations with the cooperation of government agencies and local stakeholders in order to control and reduce the adverse impact of urbanisation on arable lands, vegetation, and woodlands.
Although surface mining activities (e.g., MQ and AQ) account for a modest percentage of total land modifications (5.6 percent), factors such as the export potential of marble products and the rising demand for raw materials can boost pressure to open new quarries and expand existing ones. As a result, surface mining activities can be considered an effective agent that will continue to modify the study area's lands in the next years. The environmental degradation generated by such activities has a high potential to damage the environment in terms of geohazard and landscape aesthetic appeal. As a result, local governments must take precautions for land reclamation when quarries' operations are terminated and abandoned. Such studies are vital for understanding the linkages and possible interactions between human activities and nature in order to improve decision-making processes. As a result, this study could be a pioneer in conducting similar studies in neighboring areas where the rate of rural-urban migration, urbanization, and industrialization is on the rise, to assess the impact of human-induced land impacts.

