


 Inglés (pdf)
 Articulo en XML
 Referencias del artículo
 Enviar articulo por email
 Citado por SciELO
  Citado por Google
  Similares en
SciELO
Similares en
SciELO  Similares en Google
 Permalink
Introduction
High-accuracy positioning can be provided through a Differential Global Positioning System (DGPS) approach. This approach is also known as relative positioning, and it is based on simultaneous satellite observation and assessment from a reference station with known coordinates, and stations which the positioning will be achieved. Within this framework, post-process or Real-Time Kinematic (RTK) methods can be employed. In single base systems with a single reference station, distance-based (atmospheric refraction, or orbit) errors decrease the accuracy. In these systems, a high-accuracy position can be determined with an interstation distance of up to 10-20 kilometres. With multiple reference stations using carrier phase networks instead of a single reference station, real-time positioning can be achieved across all cities and countries with the desired accuracy. Using data from multiple stations significantly decreases distance-based errors and increases TTFA performance and positional reliability. For this purpose, the distance-based error model is created in multiple stations' adjustment software and transferred to the user in real-time (Lachapelle et al., 2000; Raquet, 1998; Wübbena et al., 1996).
Correction data is transmitted to the user in the Radio Technical Commission for Maritime Services (RTCM) format. RTCM started its operations as a USA government advisory committee in 1947 before transforming into its current status as a globally supported independent organisation. RTCM creates a standard that facilitates all transportation modes, including satellite positioning and navigation systems. Data transmission is achieved through Network Transport of RTCM via Internet Protocol (NTRIP). This enables a safe flow control mechanism for RTCM data on a network (RTCM, 2019).
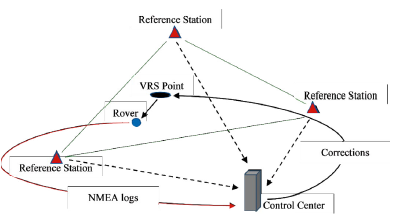
A frequently used correction model in network RTK (NRTK) is the VRS; the operating principle of this is shown in Figure 1. In short, reference stations transmit carrier phase observation and broadcast ephemeris data to the control centre in RTCM format via NTRIP. Subsequently, a rover transmits approximate coordinates to the control centre in the National Marine Electronics Association (NMEA) format via NTRIP. There is two-way communication between the rover and the control centre. CORS software in the control centre creates a VRS point using the approximate coordinates of the rover. The rover then achieves precise positioning by retrieving correction data based on the VRS location and tropospheric conditions from the internet via NTRIP (Wanninger, 1999). The advantages of this method are that they support current RTCM formats (RTCM2.1 and RTCM 3.1), calculate troposphere and ionosphere models at the control centre, and create separate corrections for each rover. There are, however, also disadvantages of this method. These include a limited number of concurrent users (depending on the control centre server capacity) and the necessity to re-initialise when the distance between rover position and VRS point exceeds certain distance limits (Gumus and Selbesoglu, 2019).
Studies have already been carried out into the positioning accuracy and reliability of single RTK for different interstation distances using horizontal and vertical components. In these studies, it was found that precision in the vertical components changes as horizontal components change and that as interstation distance increases, the accuracy of single RTK method decreases along with it (Featherstone and Stewart, 2001; Satalich and Ricketson, 1998).
In some studies, different geometric designs were adopted to test Global Navigation Satellite System (GNSS) receiver brands. It was found that when 90 km interstation distance is sufficient, ± 2.5cm accuracy was achieved in horizontal components and ± 5cm accuracy in vertical. Different GNSS receiver brands had no significant effect on the analysis (Edwards et al., 2010; Eren et al., 2009; Garrido et al., 2011). In terms of temporal correlation for NRTK methods, it was shown that there is no significant difference for interstation distances of between 15 and 45 kilometres (Ogutcu, 2019). Other studies have observed that GALILEO and GLONASS usage with GPS has positive impacts on integer ambiguity solution and TTFA (Ogutcu and Kalayci, 2016; Tsakiri, 2011).
In studies conducted to investigate the effect of NRTK measurement time on accuracy and precision, it was observed that while measurement durations increase precision, there is no significant difference for accuracy (Bae et al., 2015; Ogutcu and Kalayci, 2018). Similarly, studies in South Carolina showed that GNSS measurement accuracy increases with measurement duration; however, it does not significantly change after 180-300 seconds (Allahyari et al., 2018).
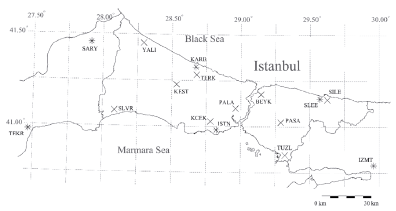
This paper aims to investigate the impacts of CORS network geometry on precision and accuracy by using different CORS networks. Additionally, the effect of the geometric design on TTFA will be analysed. Figure 2 shows the position of two different CORS network stations for the study region.
During the design phase of the CORS-TR network, there was a discussion in the technical and scientific environment regarding point density. Following these discussions, the number of stations in the project rose from the 80 that had initially been planned - firstly to 145, and then again to a final total of 158 stations (CORS, 2019). In addition to CORS-TR, local CORS networks such as ISKI CORS network have been put into service in Turkey. It has not yet been established how these local and national networks will be integrated, and what the network design principles and point density should be. The solutions developed in this regard are essential both for the efficient use of resources and to guarantee the performance expected from the network. This study was carried out in order to contribute to the formation of the aforementioned solution strategy. Within the scope of the study, the effects of baseline lengths on the solution performance related to accuracy and precision will be discussed, as well as the ensuing effect on TTFA, which is a crucial component of GNSS networks.
In this context, the network geometry was changed for ISKI CORS, with the interstation distances being increased. The analysis was conducted into the accuracy and precision rate for the new interstation distance, and the effects of the redesigned network geometry on integer ambiguity solution and TTFA were investigated. In addition, the sufficiency of ISKI CORS network station frequency was tested using two different network geometries.
Data and Methods
This study was based on the correction data of the local ISKI CORS in Istanbul and the national CORS-TR network. Reference stations for these two networks have been positioned in locations without signal obstruction to limit satellite visibility. Similarly, there are no reflecting surfaces at station locations that might lead to multipath error. As rover stations, two stations that were added to the ISKI CORS network in 2013 and 2014 were used (KEST and PASA) (ISKI, 2019). The average altitude difference between KEST-PASA stations and the ISKI CORS network is 47m; for CORS-TR, it is 80m. A low altitude difference between the rover and the reference stations decreases the tropospheric effect. In KEST and PASA stations, there are Topcon TPS Net-G3A model receiver and Topcon TPSCR.G5 antenna. Other stations in the ISKI CORS network have a Topcon TPS Net-G3 model receiver and a Topcon TPSCR.G3 model antenna. In the CORS-TR network, the stations are in the Trimble system.
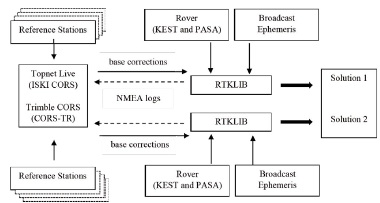
The study examined the effect of network geometry on accuracy, precision and TTFA, carrying out analysis on open source RTKLIB software (RTKLIB, 2019) with a real-time VRS solution. To introduce stations as a rover on Topnet Live software and to connect with NTRIP, an RTK mount point was defined on these stations and 1004 (GPS) and 1012 (GLONASS) formats in RTCM 3.0 were selected as observation message type.
Correction data was obtained simultaneously via ISKI CORS and CORS-TR 2101 port external IP over RTKLIB software, and NTRIP connection was provided over a DSL internet line.
Broadcast ephemeris data were defined with free-broadcasted ntrip. use-snip.com:2101/RTCM3EPH service. Because introducing these changes in Topnet Live software (such as defining stations as a rover, and changing network geometry by interrupting correction broadcast of some stations) will impact all users, the measurements were conducted between 11 pm and 4.30 am in order to minimise disruption. In addition, recording measurements at night time resulted in a minimum level of ionospheric effect. Figure 3 shows the data communication between CORS software in the ISKI CORS and CORS-TR network control centre (Topnet Live and Trimble CORS) and RTKLIB software. In Figure 3, it can be seen that solution 1 and solution 2 were obtained by using two different base corrections (ISKI CORS and CORS-TR) for KEST and PASA stations.
To carry out our study, firstly the two reference stations selected as rovers (KEST and PASA) were inactivated on Topnet Live software in the ISKI CORS network centre server. An 8-station ISKI CORS network was used to obtain 17,500 epoch VRS solutions with a one-second period on RTKLIB software. These data were collected on 24, and 25 October 2019, between 11 pm and 4.30 am (Figure 4b). Subsequently, four stations inside the ISKI CORS network (BEYK, KCEK, PALA and TERK) were inactivated on Topnet Live software, and baseline lengths were increased (Figure 4a). Using this new ISKI CORS network geometry, VRS solutions for KEST and PASA stations were obtained as 17,500 epochs; these were collected on 25 and 26 October 2019 using the same timeframe. Similarly, 6-station national CORS-TR network geometry was used, and VRS solutions were simultaneously obtained for KEST and PASA stations (Figure 5).
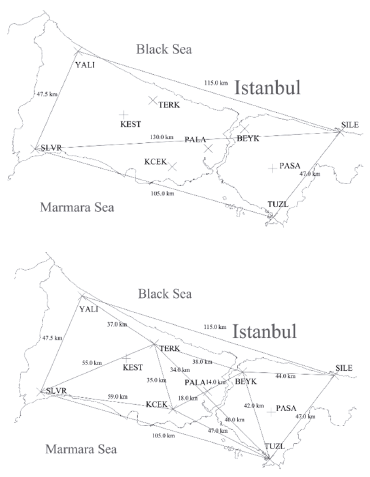
Figure 4 a: 8-station ISKI CORS network geometry. b: 4-station ISKI CORS network geometry. (+: Rover).
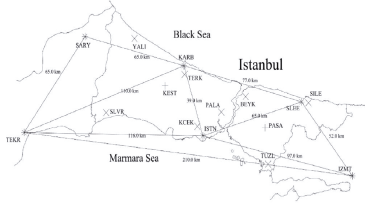
Figure 5 National CORS-TR network geometry with six stations in the study region (*: CORS-TR, +: Rover).
Figure 4 shows the 8-station ISKI CORS network and the new 4-station geometric design. Accordingly, the average interstation distance for a 4-station ISKI CORS network was 88.90 km, and the average interstation distance for an 8-station ISKI CORS network was 48.60 km. Figure 5 shows the geometric design for CORS-TR network (average of 89.60 km interstation distance).
Since ISKI CORS and CORS-TR networks are defined with different datums, ITRF2005 - ITRF2000 and ITRF2000 - ITRF1996 transformations were conducted with the ITRF online tool (ITRF, 2019) in order to achieve datum unity. these values were used as true values (Gökdaş and Özlüdemir, 2020). VRS Cartesian coordinates obtained with three different network geometries for KEST and PASA stations were subtracted from the true values determined with BERNESE software. Local Geodetic System (LGS) transformation of the differences between the VRS solution and true values were calculated in Equation 1.
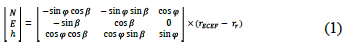
In Equation 1, N (north), E (east) and h (up) are the coordinate axes in LGS, and and are the latitude and longitude values of receiver positions, respectively. is the true receiver value in the ECEF coordinate system. r ECEF are measurement values obtained with VRS. Root Mean Square Error (RMSE) values for n, e, u (LGS) coordinates are calculated with Equation 2.
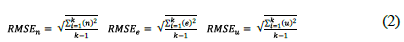
Here, k is the total number of VRS epochs. RMSE horizontal components (2D) are calculated based on the equation below.

MATLAB software was adopted to evaluate the results. An ANOVA test was selected, as the population had a normal distribution and independent samples. Two different hypotheses were tested in order to establish whether different CORS geometric design had caused significant difference for accuracy and precision (Equation 4).
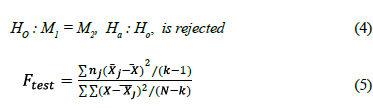
In Equation 4, M 1 values are VRS solutions (n, e and u) of the KEST and PASA stations obtained with the 8-station ISKI CORS network. The M 2 value is the VRS solution for CORS-TR and the 4-station ISKI CORS network. In Equation 5, represents the number of groups. Here, ISKI CORS and CORS-TR networks are represented as a group. The numerator of the equation represents the sum of squares, and the denominator represents the within-group sum of squares. N is the sample size (the number of epochs). F test - the value obtained from Equation 5 at (k - 1) and (N - k) degrees of freedom - was compared with F table value at α: 0.05 significance level. The value from the F table was F 1INF =3.84.
Results and Discussion
As explained in the previous section, the local ISKI CORS network geometric design was analysed. For this purpose, 8- and 4-station ISKI CORS networks were used, and VRS solutions were obtained for two stations (KEST and PASA) with two different geometric designs (Figures 4a and 4b). Again looking at two stations, the national CORS-TR network was also used to obtain a VRS solution for a longer interstation distance than that of the ISKI CORS network (Figure 5). VRS solutions with 17,500 epochs for the 8-station ISKI CORS network, the 4-station ISKI CORS network and the national CORS-TR network with six stations in the study region were obtained with RTKLIB software. As explained in the previous section, this was maintained by calculating the difference between obtained VRS solutions and true values determined with BERNESE. By using Equation 1, LGS transformation was applied to the differences and north, N, E and h values were calculated (Figure 6).
Table 1 shows mean, max, min, RMSE and std. values for the north, east and up in LGS. Accordingly, the 4-station ISKI CORS showed lower accuracy than the other two CORS geometries for n axis mean and RMSE value (1.57cm and ±1.76cm). On the e axis, the 6-station CORS network provided better results than the other two CORS geometries (Mean: 0.21cm, RMSE: ±0.63cm). On the u axis, the 8-station ISKI CORS network showed the best performance for mean and RMSE values (-1.19cm, ±1.66cm), whereas the CORS-TR network showed the worst performance (Mean: -3.26cm, RMSE: ±3.38cm). For std. values calculated for the three different CORS geometries, similar results were determined for each axis.
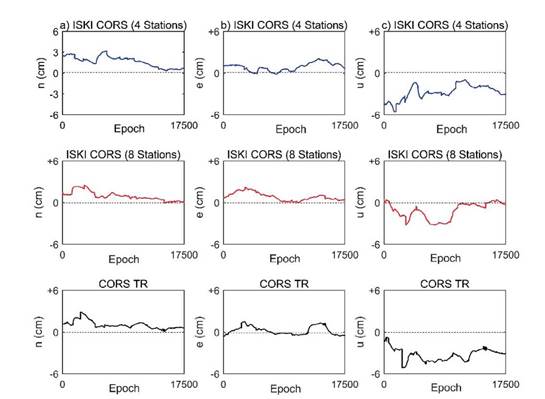
Figure 6 n, e and u axis average accuracy and precision for three different CORS geometries (a: n axis, b: e axis and c: u axis).
Table 1 Mean, max, min, RMSE and std. values on the n, e and u axes for three different geometric designs.
| Average | 4-stations ISKI | 8-stations ISKI | CORS-TR | ||||||
|---|---|---|---|---|---|---|---|---|---|
| (cm) | n | e | u | n | e | u | n | e | u |
| Mean | 1.57 | 0.88 | -2.71 | 0.94 | 0.85 | -1.19 | 1.03 | 0.21 | -3.26 |
| Max. | 3.17 | 2.08 | -0.97 | 2.51 | 2.23 | 0.64 | 2.87 | 1.51 | -0.76 |
| Min. | 0.27 | -0.17 | -5.62 | -0.08 | -0.04 | -3.26 | 0.05 | -0.68 | -5.15 |
| RMSE | ±1.76 | ±1.04 | ±2.88 | ±1.14 | ±1.02 | ±1.66 | ±1.17 | ±0.63 | ±3.38 |
| Std. | 0.80 | 0.55 | 0.99 | 0.65 | 0.57 | 1.16 | 0.56 | 0.59 | 0.87 |
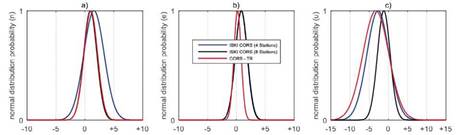
Figure 7 Normal distribution graphic of VRS solutions with three different CORS geometries (a: north, b: east, c: up).

Figure 8 ANOVA test graphic for three different CORS network geometries for the north, east and up components.
Figure 7 shows normal distribution graphics for the north, east and up components calculated with three different CORS geometries. According to Figure 7 and Table 1, the error margin on the u axis is more than for the other axes. The 8-station ISKI CORS geometry showed the best performance on the u axis.
Figure 8 shows the box plot of the error distribution of three different CORS network solutions. The line in the box plot shows the median value, and the red region outside the upper and lower boundary notes the outliers. VRS solutions on CORS networks with three different geometries were compared and analysed using an ANOVA test at a 95% confidence interval on MATLAB software. As can be seen from Table 2, the ANOVA test showed that the 8-station ISKI CORS and 6-station CORS-TR had lower F:256 values than the other results on the horizontal component. However, at a 95% confidence interval, there was a significant difference between the three different CORS geometry solutions (P>F:0).
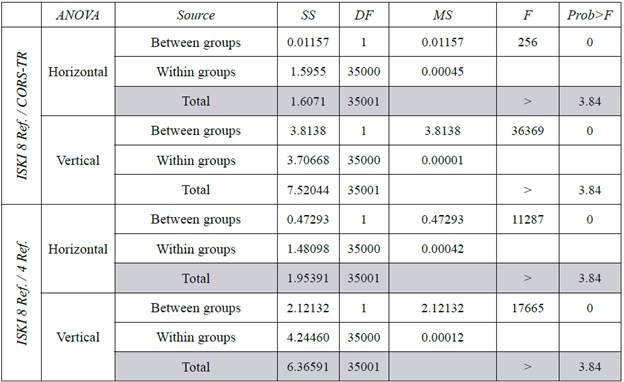
In Table 2, SS is the sum of squares, DF is the degree of freedom, MS is mean square, F is F test value, and F table value is 3.84.
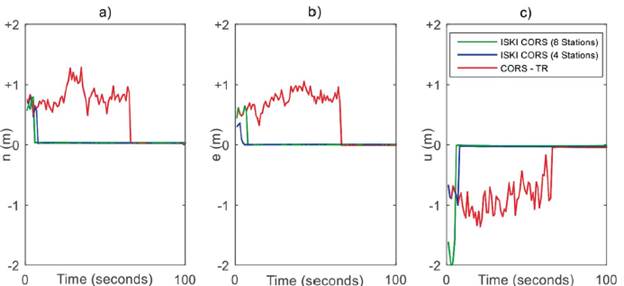
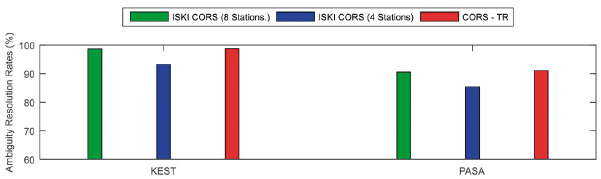
Figure 9 shows the average change on the n, e and u axes for the first 100 seconds for three different CORS geometries. This shows that, regardless of the number of stations in the ISKI CORS network solution, an average of 5 seconds was obtained; for the CORS-TR network solution an average TTFA value of 65 seconds was obtained. Figure 10 shows the FIX solution rate of KEST and PASA stations for three different CORS geometries. Here it can be seen that the integer ambiguity solution rate of KEST station was higher than that of PASA station. While integer ambiguity solution rates of 8-station ISKI CORS and CORS-TR network geometries provided similar results for both stations, the ratio was low for 4-station ISKI CORS network geometry.
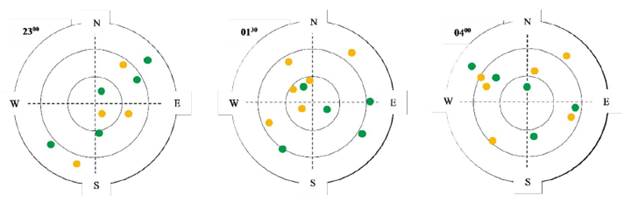
The lower integer ambiguity solution rate in PASA station (compared to KEST station) was analysed. Low-level integer ambiguity solution in each of the three CORS geometries of PASA station was observed between 11 pm and 11.30 pm. Between these hours, it was found that only a small number of GPS and GLONASS satellites were observed at PASA station, and they did not show homogenous distribution. Figure 11 shows the GPS and GLONASS satellites at 11 pm, 1.30 am, and 4 am.
Summary and Conclusion
In this paper, the authors investigated the effect of CORS network geometric design on the accuracy, precision, TTFA and integer ambiguity solution in NRTK. In addition to the local ISKI CORS network operating in Istanbul with ten stations, data were also used from the national CORS-TR network with 158 national and six regional stations (Figure 2). In addition to the two current network geometries, a new geometric model was developed for ISKI CORS network geometry analysis, and a 4-station ISKI CORS network with a lower number of stations and higher interstation distances was created. For this purpose, only four stations (SILE, SLVR, TUZL and YALI) were activated in Topnet Live software where ISKI CORS network correction parameters are calculated (Figure 4a).
VRS solutions were obtained for KEST and PASA stations inactivated at the ISKI CORS network central server with three different network geometries. Observation files for the inactivated KEST and PASA stations and VRS correction data created on Topnet Live software for KEST and PASA stations were transferred to RTKLIB software. Broadcast ephemeris data were obtained from the online service. All data were communicated in RTCM data format and with NTRIP data transmission protocol (Figure 3).
Since it is not possible to simultaneously broadcast correction data in 4-station ISKI CORS and 8-station ISKI CORS geometries, the VRS solution was conducted after waiting for one day between the analyses (24-25 October and 25-26 October 2019). In CORS-TR geometry, VRS analysis for both days was conducted simultaneously. Since increasing baseline lengths by changing the ISKI CORS network geometric design and inactivating two stations as rover will impact the NRTK users, this study was conducted between 11 pm and 4.30 am.
The true coordinates of KEST and PASA stations were determined with BERNESE software, and these values were used in accuracy analysis. Since ISKI CORS and CORS-TR networks are defined on different datums (ITRF05 - ITRF96), datum transformation on KEST and PASA stations coordinates were applied for datum unity. The true value of KEST and PASA stations and the differences between VRS solutions of three different CORS geometries were transformed into LGS with Equation 1. North, east and up values calculated in LGS were statistically analysed (Table 1). Additionally, these values were tested with ANOVA on MATLAB (Table 2). After conducting accuracy and precision analysis on three different CORS geometry solutions, integer ambiguity solution rate and TTFA performance were analysed (Figure 9, 10).
Based on these analyses, it was seen that the horizontal and vertical components of three different CORS geometry solutions were different from each other at a 95% confidence interval. When compared for accuracy, it was seen that for horizontal components interstation distances of three different CORS geometries had no significant effect on results. For vertical components, the 8-station ISKI CORS network with the shortest interstation distance produced the best results for accuracy. For std. values, it was found that interstation distances had no significant effect on the solutions. Within the scope of this study, it was seen that although interstation distances had no effect on TTFA, 4- and 8-station ISKI CORS geometries ensure precise positioning in the same time interval, and CORS-TR geometry provided a solution with a 60-second delay. In the integer ambiguity solution rate, the 4-station ISKI CORS geometry performed less well than the other two CORS geometries. Additionally, GPS and GLONASS satellite numbers, elevation angle and distribution were investigated for low integer ambiguity solution rates in PASA stations. It was found that these results could be accounted for by the low number of satellites observed between 11 pm and 11.30 pm at PASA station, and their non-homogenous distribution (Figure 11).
As a result, the authors express that by considering precise positioning at vertical components, integer ambiguity solution rate and TTFA performance factors; the 8-station ISKI CORS has sufficient point density and optimal geometric design. CORS-TR also provided similar results to the 8-station ISKI CORS network, especially in the horizontal component and FIX solution rate. As seen in this study, ISKI-CORS network gave optimum results with an average interstation distance of48.60 km. It is recommended not to exceed this base distance in newly established CORS networks.

