


 Inglês (pdf)
 Artigo em XML
 Referências do artigo
 Enviar este artigo por email
 Citado por SciELO
  Citado por Google
  Similares em
SciELO
Similares em
SciELO  Similares em Google
 Permalink
Introduction
Drought is a natural phenomenon that causes irreversible damage to the ecosystem with its alarming and negative effects for millions of human, animal and plant species on earth. The geographical conditions, climate and anthropogenic impact of a region contribute to the emergence of drought. Understanding the emergence of drought, its duration and when it will end is one of the most important work areas for hydrologists. Today, climate change is worsening in many parts of the world (Liming & Yaonan, 2016). Therefore, there is an increasing interest in sustainable water resources management. In fact, the aim here is to prevent future water resources wars that threaten species (Rostam et al., 2020). The effects of climate change vary from region to region. It causes differentiation, especially in the local precipitation amount. Therefore, it is vital to understand regional dry and rainy periods (Meilin et al., 2020).
Global warming causes negative changes on the water cycle and spatial-temporal characteristics of water resources. This significantly disrupts the balance in water resources and dry and wet conditions, especially in semi-arid and arid regions (Yanfeng et al., 2015). Drought is responsive to environmental change and altogether affects financial, ecological and farming exercises. Exploring the spatial-temporal properties of drought will help specify the correlation of drought with meteorological, hydrological and ecological cycles, and to further assess the effect of climate change on humanity (Yudan et al., 2020). Although drought is not easy to define precisely, it can simply be considered as periodic rainfall and shortage of water resources comparing average conditions.
Drought can be categorized as meteorological, agricultural, and hydrological. Lack of rainfall in a certain period indicates meteorological drought, while a decrease in agricultural production due to insufficient soil moisture is an indicator of agricultural drought, and a decrease in underground and aboveground resources is an indicator of hydrological drought (Yürekli et al., 2012). Meteorological drought is the primary type, which is the impetus behind other droughts, bringing about a decrease in the normal long term precipitation. With the meteorological drought and its negative effects occur and different kinds of drought will eventually develop, and the combined adverse effects may cause harmful effects in an area (Alamdarloo et al., 2020).
Several indexes are developed to detect meteorological, agricultural, and hydrological drought. These indexes are created using the parameters of the hydrological cycle and are used to minimize the negative effects of drought on water resources. When the index values indicating that this drought will occur, certain restrictions can be made in the use of water for precautionary purposes, general cleaning and irrigation operations can be minimized by the local resident.
The drought index most commonly used by hydrologists today is the Standardized Precipitation Index (SPI). SPI measures the lack of precipitation at various time intervals in regions with different climates (Edwards & Mckee, 1997). Examining drought over a wide span of time according to climatological, atmospheric and oceanic parameters may help moderate future drought impacts on society by improving our comprehension of the drought hazard. The data analysis reveals that climate change scholars have demonstrated that in areas where precipitation dwindles in mid-elevation during summer or where snowfall decreases, the combined impact may bring about significant increases in drought recurrence in the twenty-first century (Rind et al., 1990).
Determining the correlation between drought and different climatic parameters using large scale data sets can be used in drought prediction. It is critical to extract essential information from large databases and infer drought risk. Today, it is technical data mining that focuses on such operations (Tadesse et al., 2004). Data mining utilizes an array of data analysis instruments to determine patterns and relationships between physical factors in various data sets (Two Crows, 1999). This method is utilized in multidisciplinary fields. For instance, this technique is utilized for business applications by numerous organizations for planning key advantages to increase profit (Groth, 1998). Data mining algorithm and models, for example, decision trees clustering, associations, categorization, regression, time series forecasting and sequential patterns can possibly determine drought examples and properties. For instance, time series data mining can be applied in determining drought patterns.
The Minimal Occurrences with Constraints and Time Lags (MOWCATL) algorithm was used in this study to find the correlations between drought and atmospheric/oceanic indexes by considering time lags of their occurrences (Harms et al., 2002; Tadesse, 2002). Data mining was used to specify the complex interactions including oceanic and atmospheric parameters that potentially lead to droughts over the examined stations in Aras Basin, Turkey.
The Aras basin is in the first place in Turkey, especially in livestock breeding. Agriculture, irrigation and animal husbandry activities carried out in the summer months require a large amount of water. For this reason, many large and small dams have been built in the region today. The increasing population in the region has led to an increase in the need for clean water. In recent years, the warm and dry winter months in the region have caused a decrease in water resources. The study of drought in this region has become essential. This is an important reason why this study focuses on this region.
Materials and methods
Study area
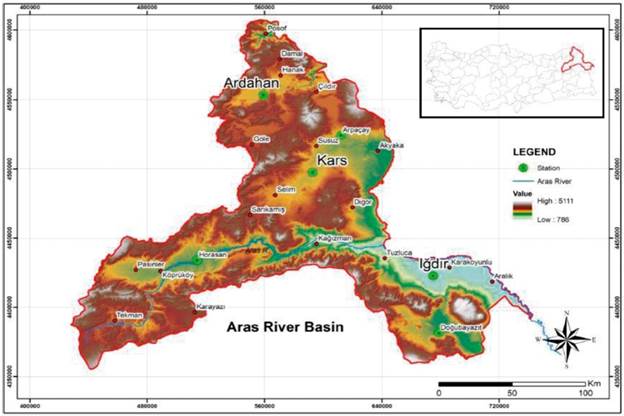
The study was performed in Aras River Basin, which is one of Turkey's 26 river basins. Aras River Basin in northeastern Turkey is the coldest part because of the altitude. Six meteorological stations within the basin with long annual precipitation data were selected. Some climatic and meteorological indexes for the years 1980-2020 were examined in the study. As for the study area, summer months are rainy and cool, except for the Iğdir station. It can be determined that Iğdir station is the driest station with conventional methods. However, drought analysis with climatic oscillations has not been performed before in the region. Precipitation data were obtained from the Directorate General of Meteorology. The characteristic features of the selected stations are shown in Table 1. The location of the study basin is shown in Figure 1.
Table 1 Geographical features of the stations
| Station/No | Elevation (m) | Latitude | Longitude | Period |
|---|---|---|---|---|
| Ardahan/17046 | 1827 | 41.1061 | 42.7055 | 1980-2020 |
| Arpaçay/17656 | 1720 | 40.8539 | 43.3178 | 1980-2020 |
| Doğubeyazit/17720 | 1640 | 39.5396 | 44.018 | 1980-2020 |
| Horasan/17690 | 1540 | 40.0383 | 42.1705 | 1980-2020 |
| Iğdir/17100 | 856 | 39.9227 | 44.0523 | 1980-2020 |
| Kars/17097 | 1777 | 40.6042 | 43.1073 | 1980-2020 |
Method
The most used atmospheric and oceanic indexes were chosen for this analysis. The Arctic Oscillation (AO) is a climate index of the atmospheric circulation condition over the Arctic. It comprises a positive stage, including below-average geopotential heights, known as negative geopotential height anomalies, and a negative stage wherein the opposite is valid (Daculaweather, 2021). MEI (Multivariate ENSO Index) is determined based on six fundamental observed factors over the tropical Pacific. These six factors are sea-level pressure, zonal and meridional components of the surface wind, sea surface temperature, surface air temperature, and total cloudiness fraction of the sky (Wolter & Timlin, 1993). A positive MEI is related to El Niño, and negative values show La Niña conditions. The NAO (North Atlantic Oscillation) index is specified as the normalized pressure difference between a station on the Azores and one in Iceland (Hurrell, 1995). Since it is calculated based on stations toward the north (Iceland) and south (Azores) of the middle latitude westerly flow, it might be considered as a measure of the strength of these winds. A positive value indicate a strong mid-latitude westerly flow while the negative values show the weak mid-latitude westerly flow (Hurrell, 1995). The Oceanic Niño Index (ONI) is the essential indicator for observing El Niño and La Niña, which are opposite phrases of the climate pattern called the El Niño-Southern Oscillation, or shortly "ENSO". El Niño conditions to be available when the Oceanic Niño Index is +0.5 or higher, demonstrating the east-central tropical Pacific is significantly warmer than expected. La Niña conditions exist when the Oceanic Niño Index is - 0.5 or lower revealing that the area is cooler than expected. (National Oceanic and Atmospheric Administration, 2021). The PDO (Pacific Decadal Oscillation) index is referred to as the main component ofNorth Pacific monthly sea surface temperature variability poleward of 20N (Francis & Hare, 1994). The positive values indicate the warm period of the North Pacific sea surface temperature, and the negative ones show the cold phase. The PNA (Pacific/North American) index indicates the upper atmosphere conditions (Overland et al. 2002). Monthly PNA averages are utilized in this analysis. The SOI (Southern Oscillation Index) is calculated through monthly sea level pressure average anomalies at Tahiti (T), French Polynesia, and Darwin (D), Australia. The normalized monthly average ocean level pressure anomaly SOI [T-D] is an index that combines the Southern Oscillation into one sequence (Trenberth & Hoar, 1996). A positive SOI implies La Niña and a negative SOI demonstrates El Niño conditions.
This study aims to present that inconstancy of the global atmospheric, and oceanic indexes can be utilized as an antecedent to local drought by formulation association rules regarding the drought index.
Agricultural Standardized Precipitation Index (a-SPI)
The SPI was formulated by McKee et al. (1993) for the classification and observation of drought. It is a comfortable, adaptable, global index, requiring just the precipitation data, which are the primary reasons behind its wide adaptability in different drought-related applications around the world. Despite the fact that it is basically considered as a meteorological drought index, it is also utilized in numerous examinations on hydrological and agricultural drought. The lack of a soil-water balance part in SPI is a restricting element for its utilization in vegetation-oriented applications. However, such a component is reasonably consolidated in the effective precipitation parameter. Accordingly, the replacement of the total precipitation with the effective precipitation prompts a more solid definition of SPI for agricultural drought and increases its adaptability for analyzing drought impacts on vegetation.
The effective precipitation can be evaluated through an array of methods, for example, assessing the soil moisture changes with lysimeters or through the simulation of the water dynamics (water balance models) (Bos et al., 2008; Ebrahimpour et al., 2015; Feddes et al., 1988; Patwardhan et al., 1990). In spite of their precision, such techniques primarily used in local or experimental applications since they require many input and estimation installations, not generally accessible for operational use or in long time series, as needed for drought characterization. Moreover, the effective precipitation assessment through the above mentioned techniques, in light of on the precipitation data only, offers the primary benefit of the original index permits to use even in regions with restricted information access. The most suitable strategy for effective precipitation assessment in the proposed updated index, specifically the Agricultural Standardized Precipitation Index (a-SPI), is based on the area and the analyzed framework. The a-SPI holds a similar standardization method to SPI, through the fitting of the effective precipitation time series to an appropriate statistical distribution, which is then transformed into normal distribution. This study applied a basic empirical methodology utilized by the FAO (Food and Agriculture Organization of the United Nations), which can be used in areas with a maximum slope of 4-5% (Tigkas et al., 2019). The a-SPI was analyzed in 1, 3, 6 and 12-month periods.
The Minimal Occurrences with Constraints and Time Lags (MOWCATL) Algorithm
MOWCATL algorithm was utilized to reveals the correlations between sequences in the multiple data sets, where a lag in time between the antecedent and the consequent exists. Besides the conventional frequency and support limitations in sequential data mining, MOWCATL utilizes separate antecedent and consequent inclusion constraints, separate antecedent and consequent maximum window widths, to determine the antecedent and consequent patterns that are isolated by a time lag (Harms et al., 2002). An association rule is characterized as "if X then Y," where X is the rule antecedent and Y is its consequent. The support of the antecedent, signified as Support {X}, is the number of events that every occasions in the antecedent episode X happen together within a user-defined window width. The antecedent support (Support {X}) is likewise called the rule coverage. An episode is regarded as frequent if its support meets or surpasses a user-identified threshold. The frequency and support of a consequent episode are also defined in this manner.
The MOWCATL algorithm primarily scans the data file in a database storing the occasions of the single events for the antecedent and consequent events individually. The algorithm only seeks for occurrences of events that meet the inclusion limitations. Then it excludes the episodes that do not satisfy the user-specified support threshold. The single-event episodes are paired into episodes of two events, for pairs of events that happen together within the specified window width, and event records of the episode in the dataset. If there are no more events to pair, this process is completed. The frequent episodes are specified with the antecedent and the consequent independently, then MOWCATL combines the frequent episodes to establish an episode rule (Harms et al., 2002).
The algorithm establishes episodic rules where the antecedent episode happens within a prescribed window width, the consequent episode occurs within a specified window width, and the start of the consequent follows an antecedent within a user-specified time lag. For instance, let's assume that episode X is the events A and B, and episode Y is the events C and D, the prescribed antecedent window width is 2 months, and the consequent window width is 3 months, with a time lag of 2 months. The parallel rule formed would indicate that if A and B occur within 2 months, then within 3 months C and D will occur together within 2 months (Tadesse et al., 2005).
In drought research, several climatic and oceanic datasets might be required to identify drought and associations of drought with specific values in these datasets. For example, the oceanic parameters referred to as the AO, MEI, NAO, ONI, PDO, PNA, SOI and several oceanic indexes can be generated in a database so that the algorithm might form the associations with the drought index to monitor it.
MOWCATL calculation is utilized in the current examination for extricating rules between extraordinary scenes and climatic files, since this calculation can be utilized for various groupings and furthermore, this will catch without anyone else the slack between the events of climatic records and precipitation occasions.
The data-mining context necessitates selecting the best rule in a certain model depending on the "interestingness measure." The concepts of "interestingness" or "goodness" of the rules are defined to select and compare the better rules among the generated ones (Bayardo & Agrawal, 1999; Silberschatz & Tuzhilin, 1995). Despite the support and confidence values' significance in selecting rules, there are alternative methods and algorithms to use in quantifying interestingness measures (Padmanabhan & Tuzhilin, 1999; Shokoohi-Yekta et al., 2015). These methods include Smyth and Goodman's J-measure (Smyth and Goodman, 1992) used in this study to quantify the interestingness of the rules for the MOWCATL algorithm.
Smyth and Goodman's J-measure is specified as the average information content of a probabilistic classification rule and applied to identify the best rules relating discrete-valued attributes. A probabilistic classification rule is a logical implication of "if X then Y" with some probability p (Hilderman & Hamilton, 1999). The J value interval is between 0 to 1. Higher J values indicate better measurements. MOWCATL is covered in detailed in (Harms & Deogun, 2004).
Experiment
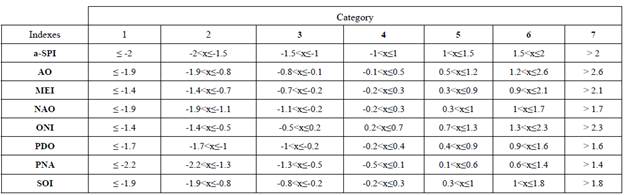
The drought was monitored as the time-series data of meteorological, climatological, and oceanic parameters generated rules that could detect the probable drought occurrence. The justification of oceanic parameter measurements to monitor drought relies on the general assumption that ocean-atmosphere relationships affect drought. As the fluctuations in oceanic parameters develop more slowly than surface meteorological parameters, the trend of the oceanic parameters better are more observable than the surface parameter trends such as precipitation deficits and surface temperature changes (Mcpadeh, 1998). Therefore, oceanic parameters might be regarded as antecedents and droughts as consequents in finding their correlation (Tadesse et al., 2004). The atmospheric and oceanic indexes applied in this paper include AO, NAO, ONI, MEI, PNA, PDA, SOI. A-SPI values for each station were also utilized to generate the rules. The monthly values from the ocean and a-SPI were converted into discrete representations and classified into seven categories. Assuming a normal distribution of this data for 40 years, each oceanic and atmospheric parameter value is divided into 0.5, 1, and 1.5 standard deviations from the normal frequency distribution. The drought index categories are: extremely dry (1), severely dry (2), moderately dry (3), normal (4), moderately wet (5), severely wet (6), and extremely wet (7). The drought classification thresholds of indexes are detailed in Table 2.
Discussion
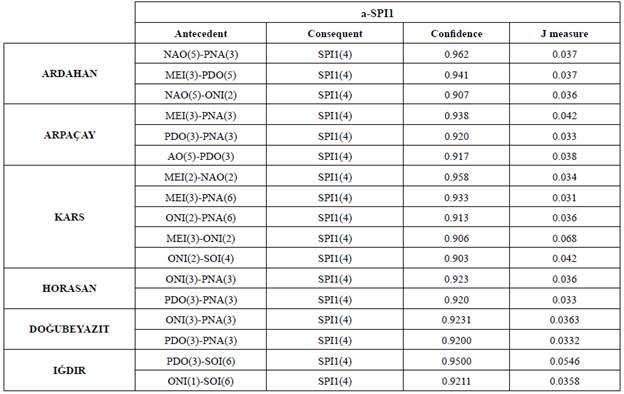
The rules in this study with a confidence level above 0.90 are presented in the tables. Since drought and flood are so sporadic, the J values are so small that all values greater than 0.025 are to be included. MOWCATL algorithm is utilized in the study for extracting rules between extreme episodes and climatic indexes. This algorithm's applicability to multiple sequences and its ability to capture the lag between the occurrences of climatic indexes and rainfall events by itself were the main reasons behind this preference. As presented in Table 3, the established rules determined neither dry nor wet conditions, but normal conditions, at all stations for 1 month a-SPI (a-SPI1) values. Arid conditions could not be detected in a-SPI1 consequent, as rules with lower levels of confidence were not included. A high level of confidence increases the validity of the rules. Table 3 shows that AO, MEI, PDA and PNA are more related in forming normal conditions. The other tables (Table 4, 5, 6, 7 and 8) shows that the standard situation, which is generally in the normal drought category, is observed.
Table 3 Sample rules generated for a-SPI1 using MOWCATL algorithm for serial episodes, antecedent and consequent windows of 2-months, and the 3-months maximum time lag between the start of the antecedent and the start of the consequent
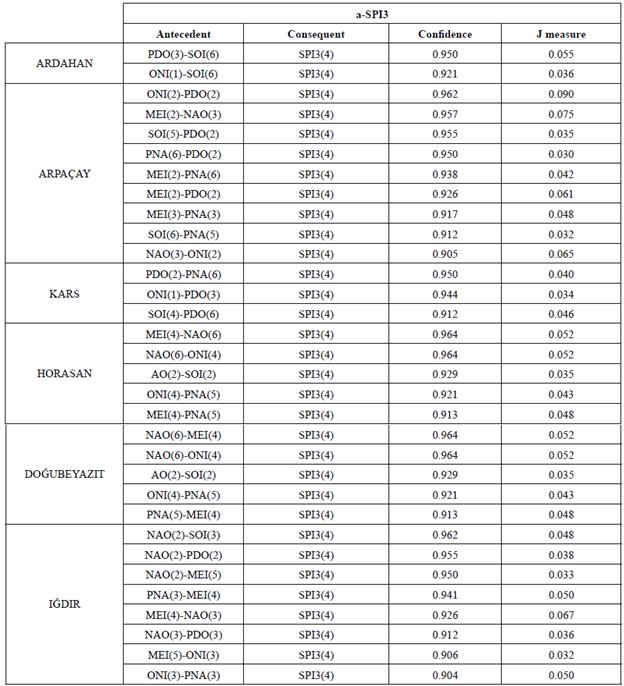
As presented in Table 4, it is determined that for a-SPI3, only normal conditions were found in all stations as a result of various algorithm rules.
Table 4 Sample rules generated for a-SPI3 using MOWCATL algorithm for serial episodes, antecedent and consequent windows of 2-months, and the 3 months maximum time lag between the start of the antecedent and the start of the consequent
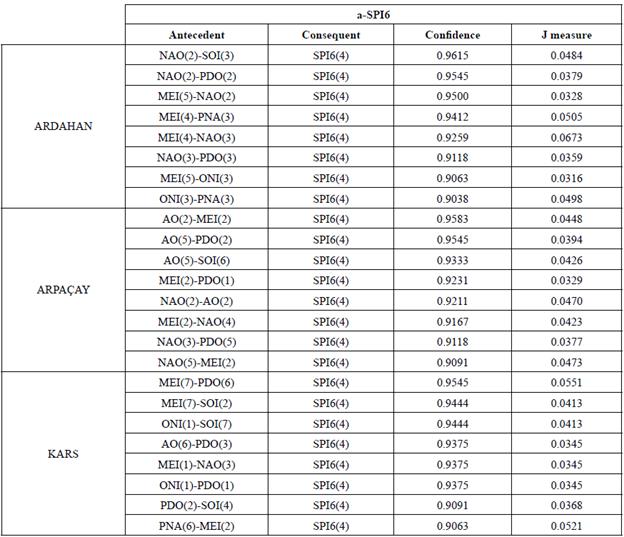
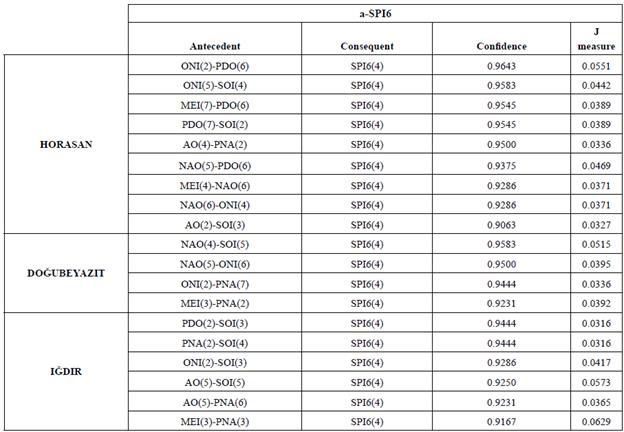
Looking at the rule of the antecedents and consequents in Table 5 and Table 6, AO, NAO, MEI and ONI were more effective in the occurrence of normal situations for a-SPI6.
Table 5 Sample rules generated for a-SPI6 using MOWCATL algorithm for serial episodes, antecedent and consequent windows of 2-months, and the 3 months maximum time lag between the start of the antecedent and the start of the consequent
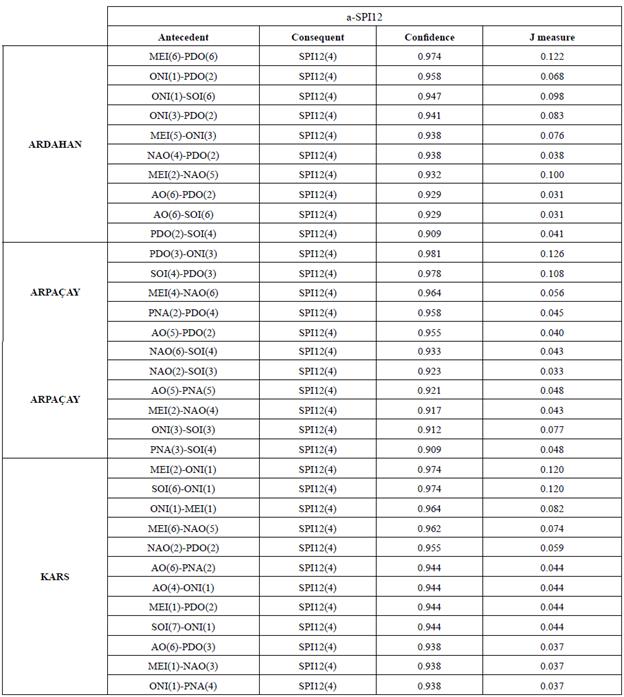
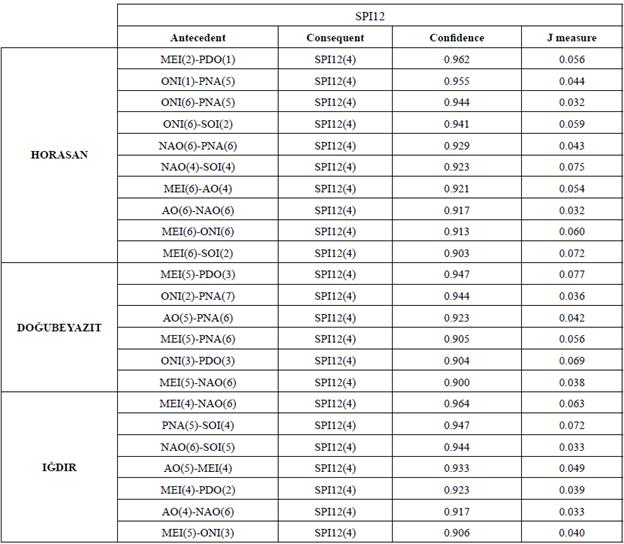
As presented in Table 7 and Table 8, normal conditions were detected for a-SPI12.
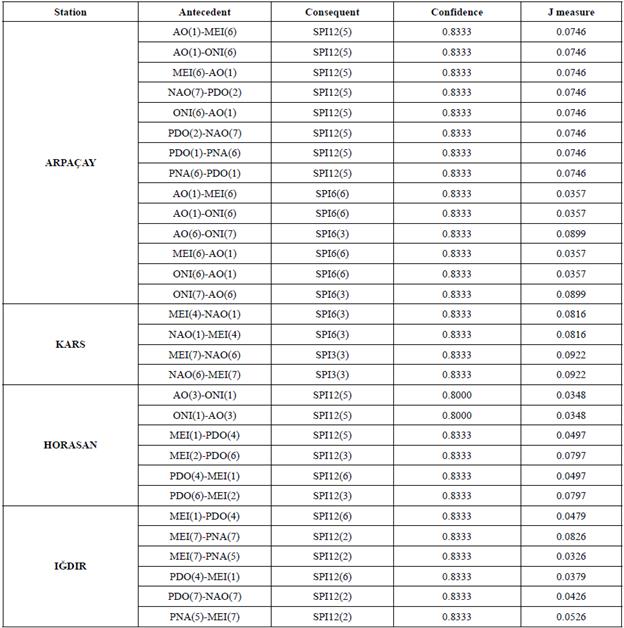
According to Table 9, only when the MEI (7) and NAO (6) conditions occur together at the Kars station, mildly severe drought may occur after 2 or 3 months. The confidence level for this rule is 0.83. This value is very close to 0.90. Both severe wet (category 6) and slightly arid (category 3) conditions could be determined for a-SPI6. A-SPI6 (6) result was obtained for AO (1) -MEI (6) and AO (1) -ONI (6) conditions, and a-SPI6 (3) result was obtained for AO (6) -ONI (7) conditions at Arpaçay station. a-SPI6 (3) result was found for MEI (4) -NAO (1) conditions at the Kars station. Slightly wet conditions for a-SPI12 were detected at Arpaçay station. AO, NAO, ONI, PDA and PNA were effective for the detection of this situation. Both severe wet, slightly wet and slightly arid conditions have been identified for Horasan station. While AO, ONI, MEI and PDO were effective in determining wet conditions, MEI and PDO were effective for dry conditions. Similar situations are also valid for Dogubeyazit station. Based on the a-SPI results, among the stations, the station experiencing the most severe drought was identified as Iğdir station. The formulated algorithm confirmed that the Iğdir station is dry according to classical methods. Severe drought has been observed under the influence of NAO, MEI, PDO and PNA. Especially in the seventh category of these oscillations, a severe drought occurred for a-SPI12 (category 2). It can be concluded that not all climatic oscillations cause drought or marshiness in all conditions based on the above tables. Drought or wet conditions can be determined only when the rules specified in the tables occur.
Similar rules occur in different meteorological stations are listed in Table 10. According to Table 10, the least common number of rules is seen at Arpacay-Kars supports (4 rules), while the highest number of similar rules is seen at Horasan-Dogubeyazit stations (22 rules). What is interesting here is that while the Arpaçay and Kars stations are close to each other, a low number of similar rules are obtained, while the Horasan and Dogubeyazit stations are far from each other, but a large number of similar rules are obtained. These stations are not very different in altitude, but may have different or similar precipitation regimes due to the surrounding mountains. Arpaçay, Horasan and Kars stations are relatively flat areas, but there are very high mountains near Dogubeyazit station and these mountains shape the climate of the region where they are located.
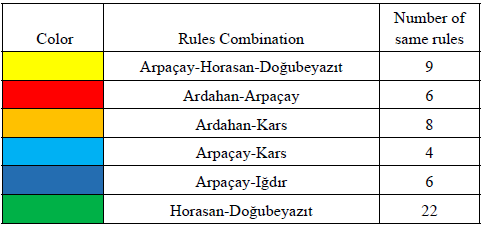
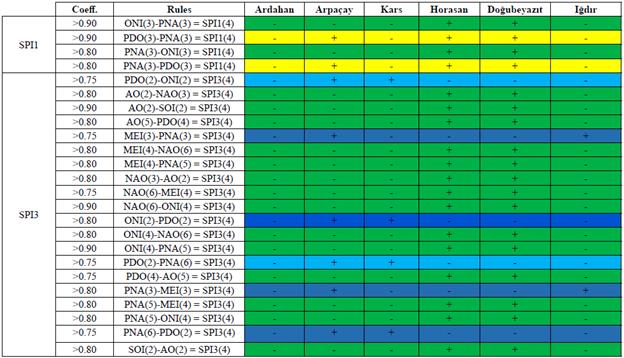
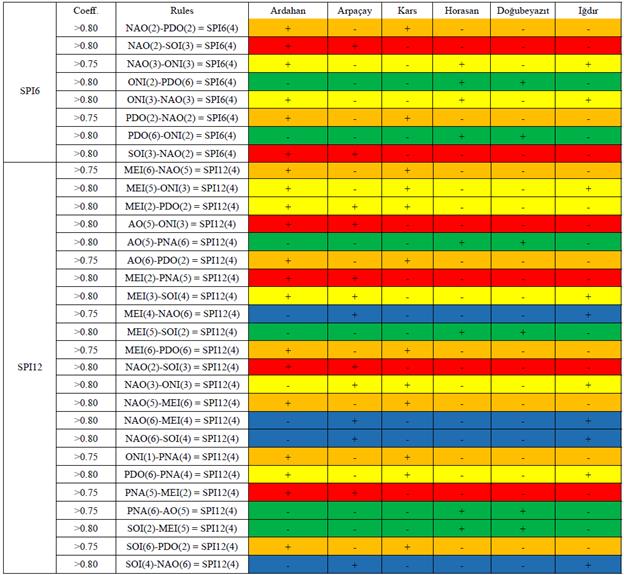
Table 11 and Table 12 show the frequency of occurrence of the same rule at different stations.
Support and lift values for MOWCATL algorithm for a-SPI12 (Category 4) are seen in Table 13. The support of the rule is the number of times the rule holds in the database (Harms and Deogun 2004). The lift was obtained from the confidence and the occurrence probability of the consequent.
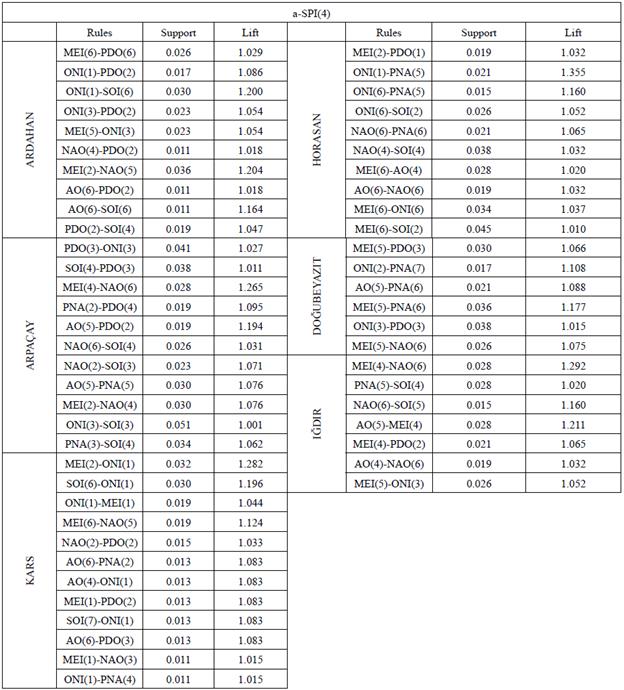
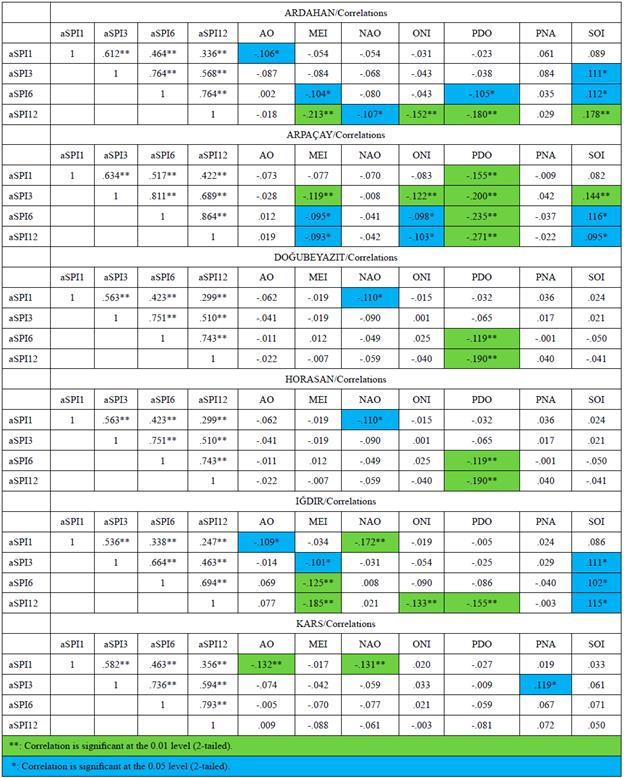
Table 14 shows the correlation values between some oscillation indexes and meteorological index in series for many years. Therefore, it can be understood whether there is a correlation between which meteorological series and climatic oscillation values at which station. For example, at Arpaçay station, PDO is the most relevant climatic oscillation, followed by MEI, ONI and SOI oscillations, respectively. MEI oscillation is apparent in Iğdir, which is the driest station.
Drought analysis studies using data mining method are becoming widespread today. Since several complex factors are involved in the emergence of drought, methods and indexes with many or few parameters are being developed. Sequential association analysis can be considered as an alternative to these conventional methods. The impact of climatic oscillation indexes on the meteorological index was investigated using many parameters in this study. A high level of confidence has resulted in detecting fewer drought and wetness situations.
Dry or wet conditions could not be revealed in Ardahan and Dogubeyazit stations. In the provinces of Ardahan and Dogubeyazit, dry periods do not occur due to the heavy rainfall in the past. For this reason, it has remained unanswered that drought does not occur at certain times and how many months later the wet time will come. Due to the higher altitudes of Ardahan and Dogubeyazit compared to other areas in the Aras region, it receives a lot of snowfall, so the regions are wet in many times of the year. Also in terms of analysis, this may be due to the high confidence level and the threshold values preferred in data discretization. However, climatic oscillations, which are frequently effective in determining climatic features at other stations, were revealed.
Conclusions
Drought can occur anywhere in the world from time to time. In this study, the MOWCATL algorithm developed by Harms et al., was used as an alternative to conventional drought methods for meteorological stations in the Aras Basin. Since it is difficult to fully analyze the drought due to the factors that constitute it, the algorithm used has been able to advance the study to a certain extent. The formulated algorithm confirmed that the Iğdir station is dry according to classical methods. However, the method applied in this study, more comprehensive studies can be performed by changing the antecedents and consequents. The arid and wetland situations that the data series have stored can be further illustrated. The result of the study also showed that stations with different geographical features may have similar climatic rules, while stations with similar geographical features may have different climatic features. This may be due to the partially unpredictable climatic parameters. This study conducted in the Aras Basin examined the effects of parameters such as climatic oscillations on the precipitation regime that causes drought. In the future, it is foreseen that the development of the region and the awareness of the local people will be engaged in more agriculture, and this type of work is important in Turkey regarding the climatic situation of the region. It is inevitable that the algorithm used in this study will contribute to the region and will shed light on the studies to be done with other methods and algorithms. This study shall contribute to the scholarship on the climate regarding the study area and its surroundings.

