


 Inglês (pdf)
 Artigo em XML
 Referências do artigo
 Enviar este artigo por email
 Citado por SciELO
  Citado por Google
  Similares em
SciELO
Similares em
SciELO  Similares em Google
 Permalink
1. Introduction
Permafrost is frozen ground in high latitudes formed by low sea-level stands during the ice ages (Overduin et al., 2019; Martens et al., 2020). The permafrost, the active layer on its top, and the underneath stratum hold complex ecosystems and are leading players in the complex study of climate change due to the release of greenhouse gases during its thaw. The data required for its research is typically time-consuming due to elaborated laboratory essays, sometimes field drilling, or complicated sampling collection.
Estimating permafrost's elastic properties is a scientific challenge that involves layers with in-depth contrasting behaviors, lateral variations in each layer's composition, inversion of velocities and densities, and diverse seismic inelastic performances. Besides, the permafrost seismic performance is involved in damages to the men-made infrastructure (see, e.g., Melvin et al.,2017; Raynolds et al., 2014; Hong et al., 2014), showing that there is a significant lack of information to diagnose its comportment appropriately and to promote proper hazard management. For instance, in some places, cryoturbation related to thawing produces seismic liquefaction, often accompanied by sand volcanoes (Vandenberghe et al., 2016), but sometimes with large-scale subsidence and potential changes in the drainage systems (Thienen-Visser et al., 2015).
In recent years, the permafrost's thickness and seismic properties have been mapped with seismic noise measurements. A good example is presented by Picotti et al. (2017), who corroborated estimations using radio-echo sounding, geoelectric, and active seismic methods in glacial environments such as the Adamello and Ortles-Cevedale massifs (Italy), the Bernese Oberland Alps (Switzerland), and the Whillans Ice Stream (West Antarctica). Their results suggested that the resonance frequency in the horizontal-to-vertical spectral ratio (HVSR) correlates well with the ice thickness at the site, in a wide range from a few tens of meters to more than 800 m, even allowing reliable estimations of the seismic properties.
On the other hand, in areas where large loads repeatedly impact the permafrost, some reports recognize their elastic and inelastic performance or allow the inference of the local seismic structure oriented to the infrastructure design care. Good examples constitute the aerial runways deployed near the scientific bases in the Antarctic continent. Thus, to provide valuable information regarding the seismic structure in these places, the authors collected seismic-noise information on Seymour-Marambio Island, approximately 80 km far the Antarctic Peninsula. The easy deployment, fast processing, and trusty results from similar sites suggest that the HVSR analyses may contribute to the knowledge of the Antarctic permafrost's elastic and inelastic properties (Bignardi et al., 2018; Köhler & Weidle, 2019). Sixty-seven seismic noise stations were deployed on the Island's plateau, where the runway is located (Figure 1). The study area corresponds to a topographic contrast of ~200 m altitude, located about 2 km from the shoreline. High slopes are observed with the shallower layers' surficial activity that triggers abundant landslides. In this scenario, the permafrost and the topographic contrast may offer information about the combined effect's seismic response.
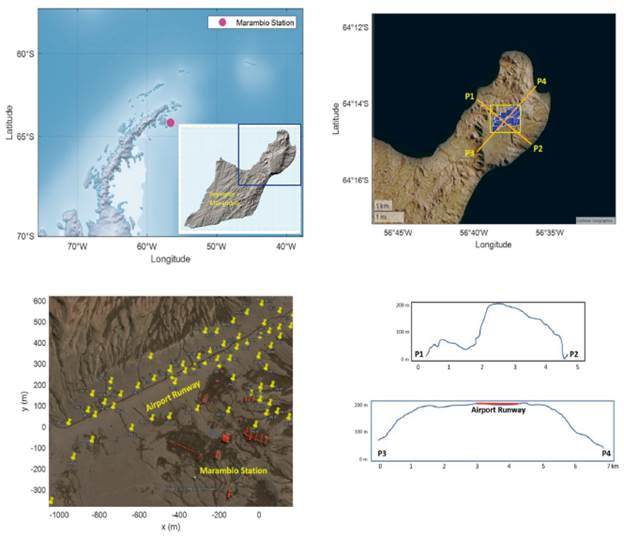
Figure 1 Location of the study area. a) Seymour-Marambio Island, approx. 80 km from the Antarctic Peninsula. The blue square represents the north part of the Island. b) Topographic image of the area where 67 seismic noise stations were recorded (blue squares). c) Marambio Scientific Base's runway is located on a narrow plateau. The map shows the scientific station's location (red houses) with 67 seismic-noise stations measured in the Colombian - Argentinean Antarctic summer field campaign in January 2020 (yellow pins). d) Perpendicular topographic profiles crossing the runway suggested in b).
In this work, the authors report the results of seismic site-response experiments made during the Colombian and Argentinean scientific teams' campaign in January 2020 near the Marambio Scientific Base of Argentina to evaluate the permafrost structure on the Island's plateau, the site response along the runway, and contrast these results with previous observations based on other geophysical approaches.
2. Geological setting
Marambio Island (also known as Seymour Island) is one of the 16 islands encompassing major islands on the Antarctic Peninsula. This Island is located in the westernmost Weddell Sea, and according to Fukuda et al. (1992), its ground has been frozen since the Holocene. At least three geomorphological terraces are recognized in the north of the Island, with depths of the permafrost estimated to be 200m (upper terrace), 105m (middle terrace), and 35m (lower terrace).
According to Montes et al. (2013), the north of the Island outcrops Miocene to Quaternary formations related to surficial and glacier processes such as the Weddell and Hobbs formations that rest on La Meseta Formation of Eocene-Oligocene age. This sequence reaches 600 m in thickness. Tectonic faults with vergence eastward and westward limit those sedimentary sequences with older sedimentary units dated from Maastrichtian to Paleocene, such as Snow Hill Island, Lopez de Bertonado, Sombral, and Cross Valley-Wiman formations (Figure 2).
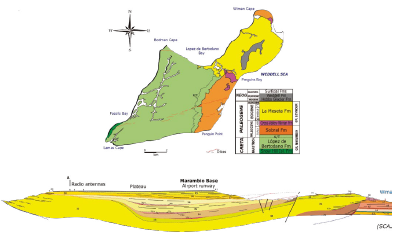
Figure 2 Geologic map of the Seymour-Marambio Island (After Montes et al., 2013). The HVSR study was done at the northern sector of the Island, located on the Marambio Scientific Base's runway. Profile A-A' is a representative section of the uppermost basin in the study area, suggesting a graben structure filled with Paleogene to Neogene sediments.
The Eocene to Quaternary strata underneath the airport runway suggests a graben structure filled at different sedimentary rates. Besides, annual climate seasons favor permanent erosive activity, mainly at the runway's north, west, and east, where surficial runoff is observed. Along the runway, the active layer was removed or compacted. This layer of < 1 m thick is only observed around the runway.
3. Materials and methods
Nogoshi and Igarashi (1971) and later Nakamura (1989, 2000) introduced the HVSR or 'H/V' method, which is based on the processing of microtremors or the ambient seismic noise generated under natural or anthropogenic perturbations, e.g., by the incidence of wind, sea waves, traffic of vehicles or industrial processes on sedimentary sequences. Acquisition and processing of the seismic noise's orthogonal components are used to estimate the power spectra ratio of the horizontal (H) over vertical (V) components to infer the strata's elastic structure below the subsurface. Thus, resonance peaks of various frequencies are then related to the thickness (h) and shear wave velocity (V s ) of each layer under the hypothesis of lateral homogeneity. Under this assumption, the following expression is used to analyze the direct problem of the soft sedimentary cover resting on a rigid basement (Nakamura, 1989):

Equation 1 suggests that different physical properties in the sedimentary sequence incorporate one harmonic in the spectra. Therefore, the HVSR curve presents as many peaks as layers, with amplitudes linked to each impedance contrast. Diverse strategies have been proposed to estimate the inverse problem to infer the elastic structure of the soft sedimentary cover resting on a rigid basement using the HSVR curve (see, e.g., Castellaro and Mulargia, 2009; Herak, 2008; Sánchez-Sesma et al., 2011; Priolo et al., 2012; Abu-Zeid et al., 2014; Lunedei & Albarello, 2015; Mantovani et al., 2015; Bignardi et al., 2016; Carcione et al., 2017). In this work, the authors have used the program OpenHVSR (Bignardi et al., 2018), based on the previous program ModelHVSR (Herak, 2008). This code computes theoretical transfer functions for layered soil models based on the fast recursive algorithm proposed by Tsai (1970) and modified to take frequency-dependent attenuation and body-wave dispersion into account, as was suggested by Tsai and Housner (1970). In this case, the soil model consists of any number of horizontal, homogeneous, isotropic, and viscoelastic layers stacked over a halfspace, each of which is defined by thickness (h), the velocity of propagation of the body wave (V and V s ), density, Poisson's ratio, and the frequency-dependent seismic Q-factor (Q and Q s ), which controls the anelastic properties. The theoretical transfer functions are calculated using a simple and guided Monte Carlo search in the model space. Those estimations are compared with the observed HVSR curves to minimize a misfit function. Details of this procedure can be consulted by Tsai (1970), Tsai and Housner (1970), and Herak (2008). The initial model for starting the inversion (Table 1) was inferred from the detailed stratigraphy reported by Montes et al. (2013). After several tests, the best fit was reached using a one-layer model with parameter values based on the average of the seven layers of Table 1. The range of values used as input parameters in the OpenHVSR code was: V p = 80 - 4500 m/s; Vp/ Vs= 1.6 - 4.0; density = 1.4 - 2.8 g/cm3, thickness =0.5 - 999 m,Q s = 5 - 500, and Q p/ Q s =1.5 - 4.5.
Table 1 The initial model of elastic and anelastic parameters used for stating the inversion. The model is based on seven sedimentary layers on a rigid basement inferred from the stratigraphy reported by Montes et al. (2013). After several tests, a best-fit was reached using a one-layer model with parameter values based on the average of the seven layers.
| Layer | (m/s) | (m/s) | ρ (S cm3) | Thickness (m) | ||
|---|---|---|---|---|---|---|
| 1 | 881 | 509 | 1.69 | 12 | 59 | 30 |
| 2 | 855 | 494 | 1.71 | 82 | 30 | 10 |
| 3 | 961 | 556 | 1.74 | 45 | 58 | 31 |
| 4 | 1006 | 581 | 1.75 | 58 | 30 | 10 |
| 5 | 1032 | 597 | 1.79 | 177 | 32 | 11 |
| 6 | 1031 | 596 | 1.82 | 60 | 58 | 31 |
| 7 | 1332 | 770 | 1.87 | 359 | 37 | 15 |
| Average | 1014 | 586 | 1.77 | 113 | 43 | 20 |
The study area's operational and access restrictions limited the experiment to be carried out between January 10 and 24, 2020. During this period of the austral summer, the intensity and direction of winds were stable. Once the authors recognized the terrain, functionality of the seismic instrument, and field logistics, 67 continuous seismic noise stations, 20-30 min-long, were recorded. Signals recorded were not discriminated from or excluded by possible noise sources, which were expected to be mainly related to wind and oceanic tides. Signals were acquired using a three-component seismometer with a natural frequency f n = 0.45Hz. The seismometer was directly installed on the ground using spikes under the base to guarantee a proper soil-sensor coupling. The seismographic system is composed of a 24-bit digitizer to 200 sps and was set up with an anti-aliasing filter at 50 Hz, which, in this particular case, guaranteed sample frequencies below the noise associated with the electrical system frequency that powers the infrastructure of the scientific base in the Seymour-Marambio Island. The seismograph is synchronized by a GPS with 5 microseconds resolution and receives analogic signals from a triaxial seismometer at 4.5 Hz. Those analogic signals were coupled to an operational amplifier with negative feedback and a buffer amplifier to extend the bandwidth to 0.45 Hz (e.g., Vitale et al., 2018). According to Parolai and Galiana-Merino (2006), transients into the seismic noise record do not affect the H/V ratio. Hence, original signals need not be filtered or have anti-triggering procedures. Geopsy was the open software used for signal processing (Wathelet et al., 2020). Figure 3 shows a flow diagram of the procedure used, starting with 1) acquisition of >20 min three-components seismic record; 2) split the record in windows of 30 s with overlaps of 50%; 3) estimation of a Weighted Hanning window and then FFT for each 30 s record; 4) smoothed of the spectrum of each component using the Konno-Ohmachi filter with a b-value of 40 (Konno & Ohmachi, 1998); 5) The horizontal specter was computed by Euclidian norm using the north and east components (H=√n 2 + E 2 ) and then estimated the H/V spectral ratio. 6) Stacking those spectral ratios for all the 30-second segments allowed the calculation of an average and standard deviation in each station for the frequency range 0.5-10.0 Hz. The same figure presents an example of one >20 min three-component seismic record, its H/V spectral ratios for all 30 second-long windows, the stacked spectral ratio, and the estimations of the elastic and anelastic properties using the OpenHVSR code. In general, the authors observed that even having momentary and abrupt changes in the seismic noise records' energy, the best 1D model found is like that estimated without the abrupt changes.
Two conditions were assumed along with all estimations:
1) the seismic ambient noise field is homogeneous across all azimuths, and 2) the soil model has several viscoelastic layers laterally homogeneous stacked over a halfspace. Strictly those restrictions are not satisfied owing to:
the diverse intensity of the Antarctic weather in the study zone, with wind trend NNE throughout the year (Yu et al., 2020);
varied interactions between ocean currents and the Island;
the effect of material damping on the expected noise wavefield as a consequence of sources relatively distant from the receivers (e.g., Lunedei and Albarello, 2009);
complex geology inside a steep topographic contrasting (Figures 1 and 2);
inversion of viscoelastic parameters due to an active upper layer, the rigid permafrost, which is over sedimentary layers with and without water, and the deeper bedrock.
All those factors make the HVSR curves challenging to invert and interpret. Carcione et al. (2017) studied soft-layers and bedrock anelasticity on the S-wave amplification to evaluate the impact of attenuation and elasticity of bedrock on the amplitude and frequency of the resonance peaks in two glaciers located in Northern Italy and the Antarctic continent. They concluded that the attenuation and bedrock elasticity must be considered to obtain reliable layer thickness estimations. Hence, the combined interpretation of the thickness and viscoelastic parameters (V p V s , Q p and Q s ) is necessary to understand the permafrost structure in the study area.
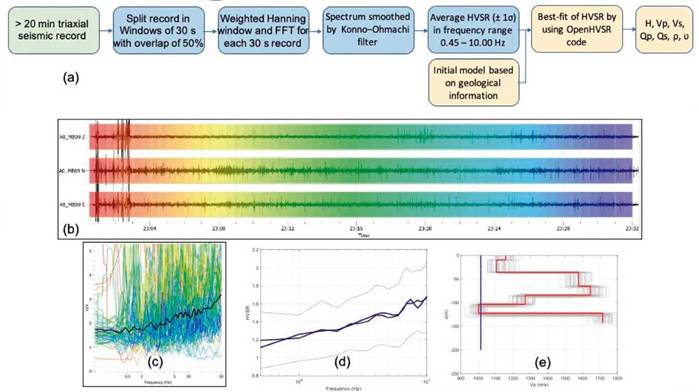
Figure 3 Procedure used to estimate elastic and anelastic parameters using stacked HVSR records. (a) Flow diagram describing different preprocessing stages, processing, and estimation of elastic and anelastic parameters. (b) Original seismic-noise recording of the SN-09 station (>20 min duration). (c) Amplitude spectrum every 30-seconds. (d) The average H/V ratio and its standard deviation for a frequency range of 0.5-10.0 Hz. (e) Example of best-fit of the H/V averaged spectral ratio, used to calculate changes in depth for elastic (V p V s , and V p /V s ), and anelastic (Q P Q s and Q/Q : ) parameters using the program OpenHVSR (Bignardi et al., 2016, 2018).
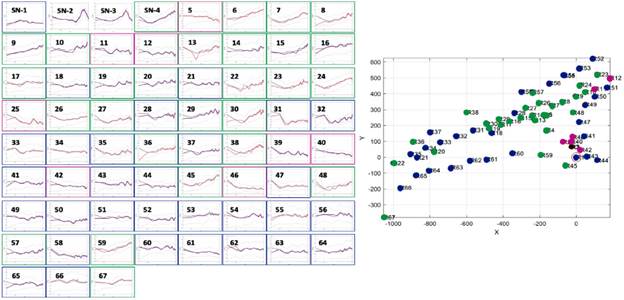
Figure 4 HVSR curves of 67 seismic noise stations were recorded in the Seymour-Marambio Island, classified in three main trends: (a) with almost flat HVSR response (blue frame), (b) presenting a growing-up HVSR response (green frame), and (c) showing a decreasingly HVSR response (purple frame). Only two stations offer a dominant peak in the frequency range analyzed (SN-2 and SN-3). The map shows the spatial distribution of these patterns. The decreasingly HVSR response stations and the two previously mentioned stations with a dominant peak are close to active landslides.
4. Results
Due to the H/V ratio does not discriminate the horizontal incidence direction of the perturbations, and each station may be analyzed from the point of view of a 1D model with limited seismic energy influencing its surrounding area, the authors hypothesize that results may show trends related to the seismic response of the underneath sedimentary structure. Figure 4 shows the 67 HVSR stations classified in three main trends: (a) with almost flat HVSR response, (b) presenting a growing-up HVSR response, and (c) showing a decreasing HVSR response. Only two stations offer a dominant peak in the frequency range analyzed (SN-2 and SN-3). Comparatively, the spectral response along the runway does not present dominant peaks, with trend responses (a) and (b) suggesting that the permanent interaction of these layers throughout impacts, movements of high loads (e.g., the permanent landing and taxi of large aircraft on the runway), and maintenance works contributed to permanent changes in the dynamic response of this ground. The dataset impedes exploring if this activity may contribute to permanent changes in the seismic dynamic response beyond the first meters. Those stations with dominant peaks or related to trend (c) are on the eastern steepest side of the runway, near active landslides, indicating a seismic response linked with not well-consolidated materials. A related observation concerning changes in the ground's dynamic response by human activity is reported by Abu Zeid et al. (2017). Those authors suggest that long-term trampling results in sediment stiffening, increasing the density and velocity of seismic shear waves.
The authors found that V and V have a broad range of values (Figure 5 and Table S1). Several authors have suggested that in permafrost, V reaches high values (e.g., Timur, 1968; Carcione & Seriani, 1998; Krautblatter & Draebing, 2014). According to these authors, high velocities of the seismic wave's propagation respond to the pore space occupied by ice and the velocities of the rock matrix, interstitial ice, and available water in an extensive range of temperatures. Nevertheless, the present study's authors observe that our fitting of observed and theoretical spectra at low frequencies is poor (also reported in other works, e.g., Talha Qadri et al., 2015; Abu Zeid et al., 2017; Bignardi et al., 2018). This uncertainty may suggest artifacts in the solution of the velocity structure, for instance, large velocity values. The authors want to encourage developing future works to contrast the estimated range of velocities reported in this paper.
It draws attention that plotting values of Q p vs V and Q s vs V at depths ranges of z ≥ -35m, -35 m ≤ z < -100 m, and z ≤ 100 m appear to be trends of low attenuation-high velocity in shallow depths, and converse, high attenuation-low velocities in deeper layers (Figure 5). Following Barton (2007), this trend could be interpreted as increasing fluid saturation in deeper layers. Indeed, the authors consider that the shallow frozen and rigid permafrost observed in the field presents low attenuation, high velocity, and, consequently, low fluid saturation, except in the thinner active layer. They also interpret that the incremental geothermal gradient promotes melting ice, generating high attenuation and low velocities in deeper layers. Prasad (2002) suggested that the relationship between ratios (V p /V s )2 and Q p /Q s offers an idea of increasing pore pressure by reducing effective stress in saturated or partially saturated rocks. The dataset (Figure 5) indicates a broad range of pore pressure conditions that dominate in surficial layers, probably due to permafrost but are still observed in deeper layers. Besides, in the wide range of densities detected, around -100 m, it was found find high V p /V s ratio with low-density values indicating high-pressure fluids' potential presence (see, e.g., Vargas & Torres, 2015; Koulakov & Vargas, 2018), probably related to the high concentration of gases in the permafrost.
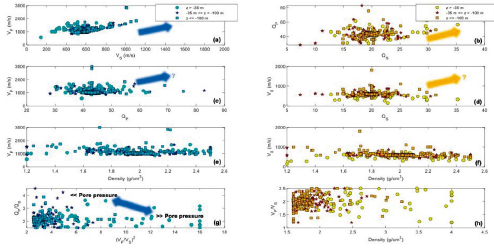
Figure 5 Elastic and anelastic parameters were estimated in the uppermost strata north of the Seymour-Marambio Island. The parameters were interpolated at three depths from the surface: z ≥ -35 m (cyan circle), -35 m ≤ z < -100 m (blue star), and z ≤ -100 m (light blue square). Arrows suggest general trends of parameters.
5. Discussion
In the fieldwork activities during the austral summer of2020, the authors observed high mobility of the active layer, accompanied by runoff in the northern sector of Seymour-Marambio Island, probably linked to the Weddell, Hobbs, and La Meseta formations. These processes made it possible to detect landslides, mainly in some areas of high slopes. Thanks to these events and the accessibility to two surficial trenches, the permafrost's presence at approx. 50100 cm depth was verified. This upper permafrost surface may offer keys to its spatial distribution. Fukuda et al. (1992), using one reference site in Seymour-Marambio Island with a mean annual temperature of approx. -10°C at the surface, a thermal profile up to 2.5 m depth, and assuming a yearly temperature gradient of 0.19°C/m in steady-state conditions, estimated the permafrost base with 0°C at a depth of~34 m. They also contrasted other geoelectrical resistivity measurements acquired by Fournier et al. (1990), which reported the permafrost thickness between 28.6 m and 127.5 m. Beneath the rigid permafrost base, the abundance of melted water and other precipitated minerals may promote viscoelastic inversions in the stratigraphy profile, at least from the runway (summit at approx. 200 m.a.s.l.) up to sea level. Besides, Kato et al. (1990) found high concentrations of CaCO3 and Na2SO4 in ice wedges, indicating percolation processes of molten water on this Island under an extremely arid environment. All those observations may explain the diverse viscoelastic profiles and inversions of properties presented in this paper's Supplementary Material. For instance, according to the V profiles, in general, the authors observed the first inversion at depths ranging between 5 and 110 m. There are up to three inversions in some places, suggesting a variable thick of the permafrost and the possibility of lateral and vertical variations of porosity that allow more significant ice concentrations, mainly in the Neogene Quaternary formations. On the other hand, the inversions of and do not coincide with those of and , suggesting that seismic attenuation mechanisms may be observed in the permafrost in response to the presence of gases or under the permafrost base, probably related to formations with water deposits. Thereby, V p , V s , and V p / V s ratios were mapped at two depths: at 1.0 m to observe the lateral variations of the permafrost under the active layer and at 35.0 m in the first permafrost base reported (Fukuda et al., 1992). As the most profound resolution reached in this work is approx. 200 m, it guarantees to observe the possible cases of permafrost up to the sea level and the role of the Paleogene to Quaternary formations (almost flat) in the lateral distribution of this layer (Supplementary Material). Figure 6 presents the horizontal sections, showing lateral variations of the seismic velocity structure in the study area. Laboratory and field experiments have associated high values of V to permafrost layers (Krautblatter & Hauck, 2007; Krautblatter & Draebing, 2014; Skvortsov et al., 2014), meaning in this case that permafrost is emplaced at 35 m-depth and highlighting patches of high values of elastic properties. High P-wave velocities are widespread except in high-slope areas. Similar patterns are observed with the S-wave velocities (Vs). N-S and E-W profiles of the same figure suggest lateral variation in the permafrost layer's elastic properties. Consequently, the V p / V s ratio is distributed in a broad range of values (1.6 - 4.0), indicating rocks with various porosities. Many are probably saturated with fluids in different phases and/or critical points (e.g., Lee, 2003). The authors do not discard that these high V p / V s ratio patches represent the permafrost with anomalous saturated accumulations of gases such as CH4 and/or CO2. Hence, they inferred that Paleogene to Quaternary formations reported by Montes et al. (2013) have high petrophysical properties heterogeneity. Consequently, they also should be associated with high lateral variation in ice concentrations.
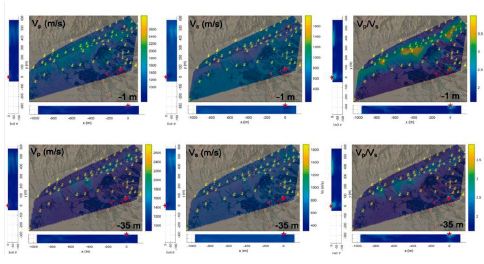
Figure 6 Maps of V p V S , and V p / V S ratios estimated at 1.0 m and 35.0 m - depth. High values of could V p be related to permafrost layers. Permafrost could be associated at 35 m-depth with patches of high values of elastic properties.
Beyond observations of the HVSR curves in three trends (Figure 4), it is difficult to discern the topographic effect on the distribution of the mapped elastic parameters. Low values of and in the peripheral part of the maps (Figure 6) could be interpreted as the seismic response of non-compacted material associated with landslides. Future work could collect data on hillside areas, even by more extended sampling periods and instruments with more bandwidth, to verify if the combined effect of topography and permafrost presence introduces imprints in the seismic response.
Discarding the topographic effect in the study area, the almost-horizontal stratigraphy in the northern sector of the Island offers an interesting constraining to validate the HVSR method's hypothesis regarding a subsurface structure composed of viscoelastic layers laterally homogeneous. In addition, the trends of V p vs. V s showed in Figure 5 illustrate that in shallow strata persist saturation of gases, something not observed in the plot Q p vs.Q s . It means that gas saturation mainly affects the elastic properties and, in a lesser proportion, the anelastic properties. In contrast, in deeper strata, under the permafrost base, where the water reservoir's location is calculated (Kneisel & Hauck, 2008), the primary mechanism of seismic dissipation is anelastic. The plot of (V p /V s ) 2 vs. Q p /Q s shows these effects nicely.
According to Borzotta and Trombotto (2004), the abundance of unfrozen water in frozen soils promotes variation in subsurface geophysical properties. Hence, having detected the possible interface where permafrost's basement has a temperature assumed as 0°C, the authors speculate as an additional worth of the HVSR method applied in the study area that the spatial distribution of elastic and anelastic properties may reflect the thermal structure of this layer in the study area.
6. Conclusions
Using the estimates of H/V ratios on 67 seismic-noise stations, we calculated elastic and anelastic properties in the uppermost layers at the north sector of Seymour-Marambio Island. The H/V spectral ratios distribution suggests the permanent interaction on the uppermost sedimentary layers due to maintenance works, trampling, impacts, and high loads (e.g., the permanent landing and taxi of large aircraft on the runway during decades) may contribute to changes in the seismic dynamic response.
The mapping of elastic properties at 1.0 m and 35.0 m depth allowed identifying lateral variations of the study area's permafrost seismic properties. At those depths, we hypothesize that permafrost is emplaced in rocks with patches of porosities saturated with fluids in different phases and critical points, e.g., with abnormal saturated accumulations of gases like CH4 and CO2.
In shallow strata, the saturation of gases affects mainly the elastic properties. In contrast, in deeper strata, where the location of water reservoirs is expected, the primary mechanism of seismic dissipation is anelastic.
7. Data and resources
This study is based on seismic microtremors' data acquired during the Colombian and Argentinean scientific teams' campaign in January 2020 near the Marambio Scientific Base of Argentina. For more information and access to the dataset, contact to authors of this paper. All data processing and plotting were done using the open software Geopsy (Wathelet et al., 2020), OpenHVSR (Bignardi et al., 2016, 2018), and the academic license of MatLab® R2020B of MathWorks.

