


 English (pdf)
 Article in xml format
 Article references
 Send this article by e-mail
 Cited by SciELO
  Cited by Google
  Similars in
SciELO
Similars in
SciELO  Similars in Google
 Permalink
1. Introduction
Watersheds are contiguous areas of land that share natural drainage (Tang and Adesina, 2022) and, when large watersheds contain many smaller ones, they can be considered contiguous hydrological response units, biophysical units, and holistic ecosystems as they are parts of the drainage network (Liu and Zhao, 2022). But also, watersheds have discrete physical boundaries or can be discretized to be suitable for statistical, comparative, and analytical studies (Band et al., 2000; Obeidat et al., 2021), so countless ways to describe them numerically and qualitatively have been proposed (Fenta et al., 2017; Li et al., 2021). Its management for the conservation of natural resources requires information on surface runoff, which plays an important role in biogeochemical cycles, provides favorable environmental conditions for multiple ecosystems (Ruiz-Luna et al., 2014), and is essential for many applications; in agriculture as a source for irrigation (Essaid and Caldwell, 2017), for the generation of energy in hydroelectric plants (Reichl and Hack, 2017), in the design of hydraulic infrastructure (Verma et al., 2018), in the evaluation of vulnerability to floods (Ogarekpe et al., 2020), and in the assessment of soil erosion (Sooryamol et al., 2022). It is relevant to know the precipitation-runoff relationship since it allows estimating the effects of floods in extreme events and evaluating how the water tables are recharged by rain events.
Among the different methods for evaluating surface runoff is the runoff curve number (CN) methodology proposed by the Natural Resources Conservation Service (NRCS) of the United States Department of Agriculture [USDA] (1986), widely accepted and frequently used in the scientific literature. The application of this method is attractive in the study of ungauged watersheds because it is based on the recognition of characteristics that can be measured in the basin, such as land use and land cover, and the soil type (Hernández-Guzmán and Ruiz-Luna, 2013).
In addition, drainage morphometry of watershed is essentially quantitative and involves numerical variables whose values can be retrieved from digital elevation models (DEM) with the help of Geographic Information Systems (GIS) (Mahala, 2020; Ogarekpe et al., 2020; Kumari et al., 2021; Obeidat et al., 2021). The importance of morphometric variables lies in their usefulness for statistical analysis as well as for comparisons, and they are fundamentals to understand the hydrological and morphological characteristics of any watershed (Thomas et al., 2010; Raux et al., 2011; Odiji et al., 2021; Singh and Singh, 2022). It is evident that the response of a watershed to precipitation events is influenced by its drainage morphometric parameters. These responses can include, an increase in the peak flow and in the frequency of floods, increase in erosion, degradation of the surface water quality, reduction in the groundwater recharge, among others (Hernández-Guzmán et al., 2008). Even without estimating surface runoff, morphometric characteristics are very important for planning irrigation, water supply, and flood control projects (Rao, 2020). Despite the fact that the availability of spatial data has fostered a significant increase in its use in hydrological applications (Satheeshkumar et al., 2017), there are few studies that relate the morphometric characteristics of the basin with the estimation of the potential for surface runoff (Satheeshkumar et al., 2017; Abdulkareem et al., 2018; Prabhakar et al., 2019).
The Chamela region, located in the coastal zone of the state of Jalisco, Mexico, is a biologically important area because the heterogeneity of the landscape ofthe region has caused not only a high diversity of species belonging to various taxonomic groups but also a high beta diversity, which indicates high levels of endemism and local patterns of diversification (Suazo-Ortuño et al., 2018). Biologically, it is one of the most studied areas of Mexico, especially the Chamela-Cuixmala Biosphere Reserve, a natural area of preserved tropical deciduous forest of about 131 km2. However, the conversion of natural cover to cultivated land has been recurrent in the surrounding area as shown by previous studies (Sánchez-Azofeifa et al., 2009; Flores-Casas and Ortega-Huerta, 2019).
The studies found at a basin scale, as well as for the coastal zone of the state of Jalisco (Sánchez-Azofeifa et al., 2009; Martínez-Harms et al., 2016; Flores-Casas and Ortega-Huerta, 2019), have not tackled an analysis of how the morphometric parameters of the basin influence the routes and rates of water flow that may be useful in the prevention of natural disasters in vulnerable areas of the region. Based on the above considerations, the aim of this study was to make landscape characterization and estimate the surface runoff applying the runoff curve number method in the Río Cuitzmala watershed, Jalisco, Mexico and evaluate the drainage characteristics that govern surface runoff in the watershed.
2. Study area
The study area corresponds to the Río Cuitzmala watershed, located in the coastal zone of the state of Jalisco, Mexico (between 19° 17' and 19°52' N, and from 104°34' to 105°04' W), comprising a total area of 1,120 km2. The sub-basin has an elevation gradient that ranges from 0 to 1,769 meters above sea level with an average annual temperature that ranges between 20.8 °C and 32.8 °C with an average of 25.9 °C. The area is characterized by having a marked seasonality (almost 80% of the precipitation occurs between July and November) with an average annual precipitation of 963 mm measured in the automatic weather station 16A106E4 (Fig. 1a). In the lower part of the study area is the Chamela-Cuixmala Biosphere Reserve, which protects a system of tropical dry forest known for its high biodiversity. Geologically, 67% of the watershed is characterized by Granite - Granodiorite (97.5-108.5 million years) and 18% Volcano-sedimentary rocks (91-112 million years), both derived from the lower Cretaceous. Quaternary alluvium deposits (0.01 million years) are along the river banks in the lower part of the watershed (Fig. 1b).
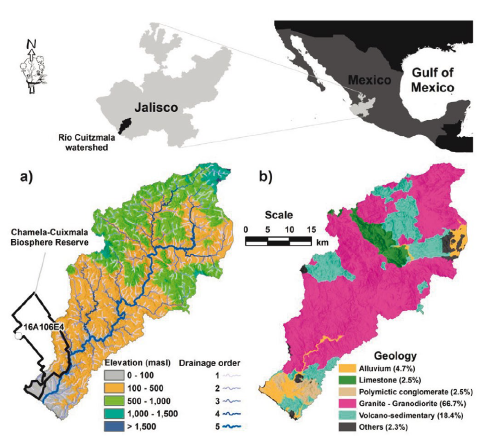
Figure 1 Geographic location of the Rio Cuitzmala watershed in the coastal zone of Jalisco, Mexico showing the topographic variability. a) Drainage order obtained from the Mexican Continuous Elevation 3.0 (CEM 3.0) produced by the National Institute of Statistics and Geography (INEGI). b) Geology map digitized from the Mexican Geological Survey charts (SGM).
3. Methods
Drainage morphometry of watershed
A total of 19 linear, shape, and relief parameters of the study area were determined from the Continuo de Elevaciones Mexicano (Mexican Continuous Elevation, or CEM) at15m pixel size developed by Mexico's National Institute of Statistics and Geography (INEGI; https://www.inegi.org.mx/app/geo2/elevacionesmex/). We used the D8 algorithm to derive the flow direction (Jenson and Domingue, 1988). Using this layer, the flow accumulation was derived, and using a constant threshold value of 2,225 cells (~ 0.5 km2) the drainage network was defined according to Strahler (Carraro et al., 2020).
Land use and land cover
The land use and land cover map for the year 2019 was derived from a Sentinel-2 scene with bands at 10 m spatial resolution using an unsupervised classification technique with the K-means algorithm on the TerrSet software (Eastman, 2016). This algorithm partitioned the satellite image into 50 spectral classes, which were subsequently reclassified into the following land use and land cover classes: aquatic surfaces, mangrove, evergreen forest, tropical dry forest, agriculture, and grassland. The littoral and human settlement classes were digitized on-screen over infrared false color combinations and added to the final thematic map. The small fringe of the littoral class was digitized because generated spectral confusion with the grassland class. Regarding the human settlements class, the study area maintains a rural profile, with a low-density population. There are only three small towns with more than 500 inhabitants. Houses in this area are generally separated and have big backyards with orchard trees that create spectral confusion with the agricultural and evergreen forest classes.
The accuracy assessment was based on 160 points collected in the field and registered with the help of a global positioning system (GPS) unit in 2019. These points were compared with the classification and the results were plotted in a confusion matrix, which compares the relationship between classification results and field verification data. From this numerical arrangement, the global accuracy and the Kappa coefficient were estimated, in addition to the Producer (EP) and User (EU) accuracies (Congalton and Green, 2009).
Surface runoff
Runoff calculation with the CN method depends mainly on the precipitation, the land cover characteristics of the area, and the hydrologic soil groups. Based on the combination of these attributes, a CN value was defined for each resulting polygon. The results were processed with the SARA v1.0 (Hernández-Guzmán and Ruiz-Luna, 2013), a GIS tool that makes use of the NRCS-CN equation to estimate surface runoff:
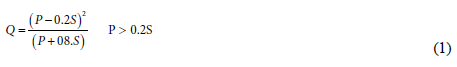
The value of S is the maximum potential water retention and depends on the capacity of the soil to produce runoff, given a value of precipitation (P). Only when the precipitation value exceeds the initial abstraction value (0.2S) runoff (Q) occur. The value of S can be estimated based on the value of CN by the following expression (USDA, 1986):
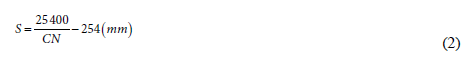
The CN is an empirical parameter based on the hydrologic soil group (HSG), land use, treatment, and hydrological conditions. The CN is a dimensionless index that ranges from 0 to 100 representing extreme conditions between total infiltration (runoff = 0) and impermeable surfaces (precipitation = runoff). These CN values were assigned according to the USDA TR55 manual (1986).
Soil types were defined based on the Soil Vector Data Set scale 1: 250,000 series II (National Continuum). These polygons were classified by INEGI following the criteria of the FAO's World Reference Base for Soil Resources (2014). In this work, these polygons were reclassified into four hydrologic soil groups (HSG) using the CN method (USDA, 1986). This spatial database was available in vector format and was projected to the Universal Transversal Mercator system (UTM), zone 13 N, using the WGS84 datum.
The precipitation data were acquired from the Climate Information Platform (PIC) of the National Commission of Protected Natural Areas (CONANP) for the automatic meteorological station with identification 16A106E4 Chamela-Cuixmala (Geographic coordinates: -105.045, 19.499; Datum WGS84; Fig. 1). The runoff response was evaluated for each storm event during the 2013-2019 period. Only those precipitation events greater than one inch were considered as generating runoff. The antecedent moisture condition for each storm was assigned from the accumulated precipitation for the five days before each event.
Finally, and for comparison purposes, we calculated the runoff coefficient (CQ). This value is presented as a percentage and is calculated by the ratio of the amount of precipitation received and the amount of runoff.
Results
Drainage morphometry of watershed
The drainage system of the Río Cuitzmala watershed corresponds to a fifth-order network. It presents a total of 2,068 streams mainly of the first order and the total length of channels is estimated at 1,201 km (Table 1). The values of the geomorphological parameters suggest a watershed with areas of a gentle slope, as well as a moderate to high permeability with dense vegetation. The low value of the stream frequency agrees with this and also indicates that the gentle terrain slopes confer a high infiltration. The shape parameters place the watershed in a young stage of the streams, well-drained and with a low potential for flooding. The channel maintenance constant indicates that the sub-basin is under conditions of few structural disturbances and low runoff.
Land use and land cover
The confusion matrix of the thematic map yielded an overall accuracy of 82% (95% CI = 75% - 90%) and a Kappa estimator = 0.76 (95% CI = 0.67 - 0.86). All user accuracies were above 80%. Only the producer accuracies of the agriculture and evergreen forest classes presented low values of 71% and 78%, respectively. The landscape of the study area presented a predominance of natural vegetation. From the approximately 1,120 km2, the tropical dry forest (TDF) and the evergreen forest (EF) covered 435 km2 and 333 km2, respectively. The area covered by TDF was mainly distributed in the lower parts of the study area, while the EF was located in the upper parts of the sub-basin. The grassland, another important land cover in terms of its extension (326 km2) was present in the middle part of the sub-basin (Fig. 2).
Surface runoff
The four HSG (A, B, C, and D) with their description and soil types associated with each of them is shown in Table S1. Seven soil units were identified in the study area, Regosol being the dominant soil, occupying 62.6% (700 km2) of the total area. This soil type is generally mineral, and very weakly developed with low moisture retention capacity. In order of importance, Phaeozem and Cambisol represent about 17.5% and 9.5% of the area, respectively. Phaeozem corresponds to fertile porous soils while Cambisol corresponds to soils developed in medium and fine textures.
Table 1 Morphometric parameters of the Río Cuitzmala watershed obtained through the processing of the Mexican Continuous Elevation at 15 m resolution.
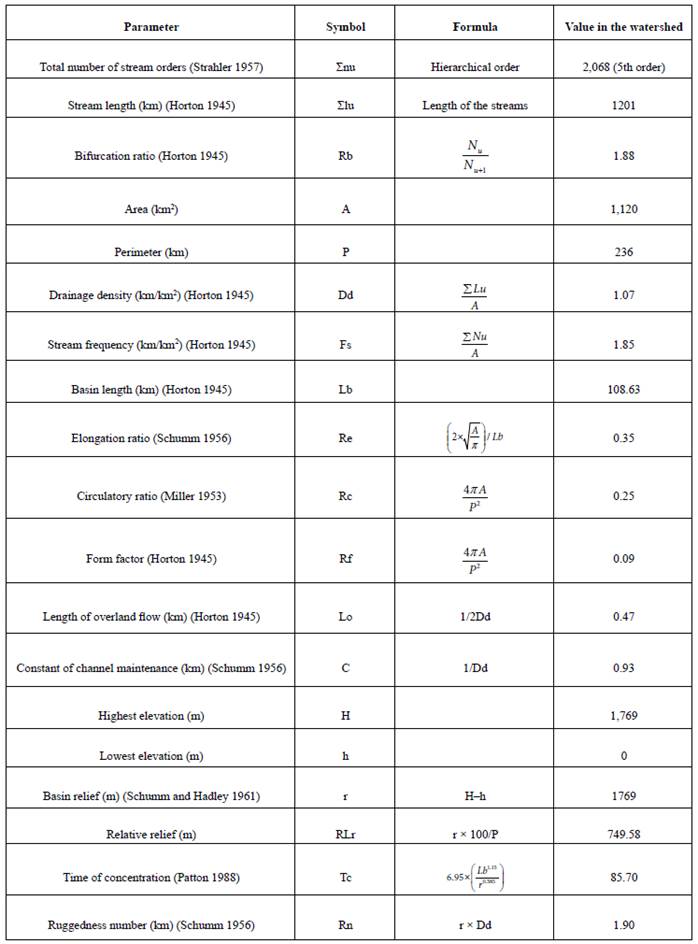
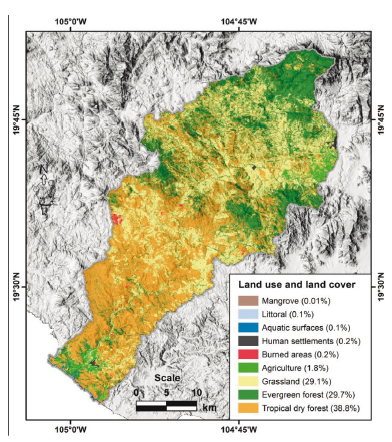
Figure 2 Land use and land cover of the Río Cuitzmala watershed in the coastal zone of Jalisco, Mexico, obtained with the unsupervised classification of a Sentinel-2 image from 2019.
All of the hydrologic soil groups described in the runoff curve number method were present in the study area (Fig. 3). Soils with moderate runoff potential (B) were the most representative in the area (79.9%). The soils of hydrological group C (19.9%), with high runoff potential, followed in order of importance, while soils with low runoff potential (high infiltration, represented by hydrological group A), occupied the least extent.
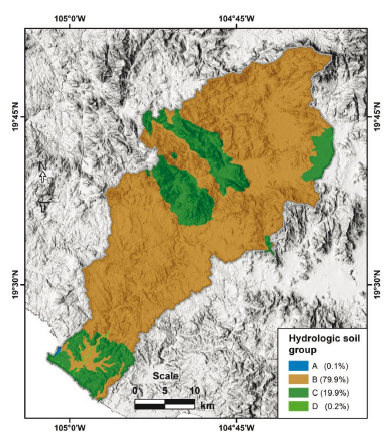
Figure 3 Hydrologic soil groups of the Rio Cuitzmala watershed in the coastal zone of Jalisco, Mexico.
The intersect geoprocessing between Land cover vs. Hydrologic soil group produced 30 categories to which the corresponding CN was assigned. Excluding water bodies (to which a CN value = 98 was assigned), agricultural lands under any hydrological soil group are those that presented the highest CN values; therefore, they present a greater potential for runoff per unit area (Table 2).
Table 2 Land use and land covers (Area in square kilometers) with the associated curve numbers for the three antecedent moisture conditions (AMC).
| Land use and land cover | HSG | CN II | CN I | CN III | Area (km2) |
| Agriculture | B | 86 | 72 | 93 | 10.60 |
| C | 91 | 81 | 96 | 9.29 | |
| D | 94 | 87 | 97 | 0.25 | |
| Burned areas | B | 69 | 48 | 84 | 2.17 |
| C | 79 | 61 | 90 | 0.27 | |
| Evergreen forest | A | 40 | 22 | 61 | 0.13 |
| B | 66 | 45 | 82 | 275.20 | |
| C | 77 | 58 | 89 | 56.58 | |
| D | 85 | 70 | 93 | 0.74 | |
| Grassland | A | 49 | 29 | 69 | 0.13 |
| B | 69 | 48 | 84 | 269.50 | |
| C | 79 | 61 | 90 | 55.63 | |
| D | 84 | 69 | 92 | 0.29 | |
| Littoral | A | 50 | 30 | 70 | 0.27 |
| B | 50 | 30 | 70 | 0.05 | |
| C | 50 | 30 | 70 | 0.49 | |
| D | 50 | 30 | 70 | 0.21 | |
| Mangrove | C | 70 | 49 | 84 | 0.07 |
| D | 77 | 58 | 89 | 0.02 | |
| Tropical dry forest | A | 36 | 19 | 56 | 0.10 |
| B | 60 | 39 | 78 | 336.10 | |
| C | 73 | 53 | 86 | 98.42 | |
| D | 79 | 61 | 90 | 0.21 | |
| Human settlements | B | 65 | 44 | 81 | 1.02 |
| C | 77 | 58 | 89 | 1.04 | |
| D | 82 | 66 | 91 | 0.26 | |
| Aquatic surfaces | A | 98 | 95 | 99 | 0.01 |
| B | 98 | 95 | 99 | 0.33 | |
| C | 98 | 95 | 99 | 0.65 | |
| D | 98 | 95 | 99 | 0.37 |
With the previous information, the runoff volume was estimated for each of the selected storm events (Table S2). Annual accumulated precipitation ranged from 658 to 1,083 mm from 2013 to 2019. An average of 963 mm was found with 82% of this precipitation concentrating from July to November, with sporadic storm events from January to March. A total of 77 storm events were identified, of which 60% corresponded to the AMC I. The total runoff volume ranged between 0.05 and 227.2 Mm3. September and October were the months with the most intense rainfall and therefore when the highest runoff volumes occurred. The low values in the runoff volume from December to February are due to the scarce precipitation received, and the fact that the antecedent precipitation is relatively low (AMC I). The average runoff was 14.52 Mm3 and the average runoff coefficient was 12.86%.
Discussions
Determining the order of the streams is critical to understanding the drainage characteristics of the catchment area (Horton, 1945; Strahler, 1957). The Rio Cuitzmala watershed presented a total of 2,068 streams of which 922 (44.6%), 494 (23.9%), 313 (15.1%), 83 (4.0%), and 256 (12.4%) belong to the orders 1st, 2nd, 3rd, 4th, and 5th, respectively. The high frequency of first-order streams in the upper part of the watershed indicates a young topography and highlights the compact nature of the bedrock lithology (Granite - Granodiorite of 97.5-108.5 million years belonging to the lower Cretaceous period). The constant decrease in the number of streams in relation to the drainage order (Nu) (except the fifth-order) indicates the predominance of the erosive landform throughout the watershed. This result coincided with Pande and Moharir (2017), who indicate that the total number of streams gradually decreases as the order of streams increases.
Regarding the bifurcation ratio (Rb), this parameter denotes the water transport capacity and the potential for flash flooding during prolonged rains in any watershed (Bhat et al., 2019). Although Horton (1945) indicates that the Rb value ranges from a minimum of 2 in "flat drainage basins" to 3 or 4 in " mountainous or highly dissected drainage basins", Resmi et al. (2019) suggest the Rb value is in a range between 3 and 5 for basins in which geological structures deform the drainage pattern. In this study, the Rb values ranged between 0.32 and 3.77 (average of 1.8) positioning our watershed as a well-drained area, with flat terrain, and a permeable and soft bedrock where most water infiltrates. This indicates a basin with a low potential for flooding and an area with a higher potential for water recharge. Strahler (1964) states that low Rb values are characteristic of watersheds that have suffered fewer structural disturbances. This low value of Rb is due to the presence of a large number of first and second-order streams, and imply a flat area with a flowing drainage system (Bharath et al., 2021; Haokip et al., 2021).
Drainage density (Dd) is useful to understand the potential for runoff or travel time of water in a basin as well as the infiltration capacity of the land, relief, and vegetation cover of the basin (Bhat et al., 2019). According to Pallard et al. (2009) and Bhat et al. (2019), Dd values (high/low) are obtained due to sub-surface material (impermeable/permeable), vegetation (sparse/good), relief (high/low), runoff/infiltration (high/low) and flood volumes (high/low). Horton (1945) stated a well-drained basin has a drainage density of 0.73, whereas a poorly drained one has a drainage density of 2.74 (Bogale, 2021; Obeidat et al., 2021). The low drainage density (Dd) value of 1.07 km/km2 indicated moderate to high permeability with dense vegetation and low relief, which suggests low runoff during flood periods. Smith (1950) categorized the drainage density into five different textures classes, i.e., very coarse (<2), coarse (2-4), moderate (4-6), fine (6-8), and very fine (>8) (Alam et al., 2021; Ghosh et al., 2021; Khan et al., 2021). Thus, the Dd value in the study area is less than 2, which characterizes a coarse drainage system.
The morphometric analysis indicated that it is a young watershed with gentle slopes, soils that confer high infiltration, and rocks with high permeability, which concur with the results of the assignment of hydrological groups. Considering the runoff curve number method, 80% of the watershed presented soils that have low to moderate runoff potential (B) that, together with the main covers found in the watershed obtained through the classification of satellite images, confirms the low values in Dd.
Regarding the precipitation in the watershed, most of it occurs during the rainy season (July - November), which results in maximum flows in streams and the river. Tropical storms are common during August, September, and October. The hurricanes and storms that have affected directly or indirectly, as well as the precipitation recorded in the meteorological station near the study area, were: Hurricane Norbert (September 2-8, 2014; 198.4 mm), Hurricane Patricia (October 20-24, 2015; 123.4 mm), Tropical Storm Lidia (August 29 -September 3, 2017; 267.2 mm), Tropical Storm Pilar (September 23-25, 2017; 110.6 mm), Hurricane Willa (October 20-24, 2018; 275.4mm); Tropical Storm Lorena (September 17-22, 2019; 340.6 mm), Tropical Storm Narda (September 28 - October 1, 2019; 103.8 mm). During these events, most of the precipitated water becomes surface runoff. It is important to mention that, during the dry season, the rain is almost nil. Despite some storm events during the dry season, most of the rain is used to saturate the soil, which is completely dry. Comparing the results obtained on the runoff coefficient (12.86%) with the value of 11.25% reported by INEGI (2000) for the San Nicolás-Cuitzmala river basin, the value estimated in the present work is slightly higher. However, this difference could be considered negligible.
Conclusions
The Río Cuitzmala watershed is an area of low slope, with a moderate to high permeability, dominated in a greater proportion by a forest cover and low relief. It is a watershed in the young stage of the streams whose runoff drains rapidly, it does not present large floods of flow, which indicates a low potential for flooding. Under current conditions, its runoff coefficient was estimated at 12.86%.
Morphometric parameters are stable indicators and offer a relatively rapid way to characterize a drainage unit. However, it is important to complement this information using other methods such as paired watersheds and direct measurement of the components that influence the generation of surface runoff. The CN method incorporating remote sensing and GIS techniques in ungauged basins provides useful results for outlining conservation strategies and implementing management practices at the watershed level, helping to solve specific environmental problems and maximizing the use of economic and social resources.

