


 Inglês (pdf)
 Artigo em XML
 Referências do artigo
 Enviar este artigo por email
 Citado por SciELO
  Citado por Google
  Similares em
SciELO
Similares em
SciELO  Similares em Google
 Permalink
1. Introduction
An array of hydrothermal mineral deposits, including porphyry Cu deposits (Sillitoe, 1972; Sillitoe, 2010) are conventionally thought to be controlled structurally (Pirajno, 2012). That is, structural features, ranging from faults to fractures, act as major corridors for migration of mineral-bearing fluids (Pirajno, 2012; Parsa and Maghsoudi, 2018). Although distribution and emplacement of hydrothermal mineral systems are inextricably linked to fault systems, not all fault systems are associated with this type of mineralization (cf. Faulkner et al., 2010). It is, therefore, crucial to answer the question of how is the distribution of hydrothermal mineral deposits associated with faults? The answer to this question is important in that the fault systems that exhibit spatial and genetic link with mineral deposits can serve as exploration criteria for the delineation of exploration targets (e.g., Carranza, 2009; Carranza and Sadeghi, 2014; Adib et al, 2017a; Adib et al, 2017b; Parsa et al, 2018a; Parsa and Maghsoudi, 2018).
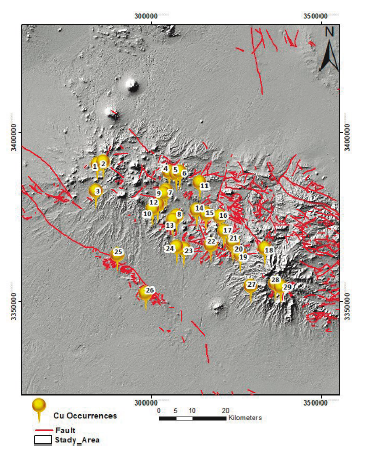
Located in the southern part of Urmia-Dokhtar magmatic belt (Fig. 1), Dahej Area is dominated by magmatic sequences. In this area, the magmatism is known to have been commenced by the deposition of acidic-to-intermediate extrusions in Eocene, and then lasted till Quaternary when basaltic outcrops have been emplaced. The acidic-to-intermediate plutonic sequences have been then intruded by shallow Oligocene-Miocene dioritic and granitic intrusions. Not only did these intrusions trigger the development of extensive alteration zones, but they hosted a number of metallic deposits (Feizi et al, 2017a) such as porphyry Cu mineralization in the area (Feizi et al., 2017b); that is, these intrusions are spatially and temporally associated with mineralization (Zarasvandi et al, 2016). Although many studies have been conducted on these deposits (e.g., Khoie et al, 1999; Bazin and Hubner, 1969; Dehghani, 2000; Zarasvandi, 2004; Mehrabi et al, 2005; Zarasvandi et al, 2016), their spatial link with structural features remains unanswered. Accordingly, the present research aimed at tackling the foregoing caveat gap through spatial and numerical techniques.
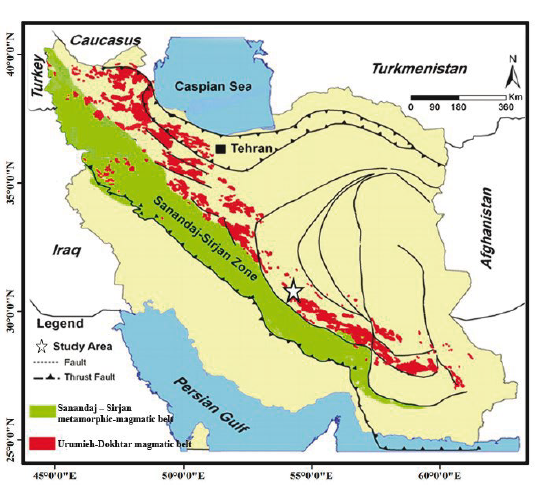
Figure 1 Location map of the study area along the Urmia-Dokhtar magmatic belt (modified from Alavi, 1994)
Faults, fractures, shear zones, and various spatial stresses tend to concentrate the magma and trigger its movement through shallow zones of the crust, indicating their crucial role in the distribution of magmatic fluids (Ryan and Dewey, 1990). Therefore, investigation of the geometry of the fault mechanisms associated with porphyry Cu orebodies can lead to very significant insights into the choice of proper locations for exploring porphyry bodies (Walker, 2006). Different analyses have been conducted to assess spatial distribution of mineral deposits; however, the most profound methods of analysis are seemingly the fractal (Mandelbrot, 1983) and fry analyses (Fry, 1979), which we were used in this study. In addition, there are myriad numerical techniques available for assessing spatial association of faults systems with mineralization. These include, for example, the t-student spatial statistics (Zuo et al., 2009; Xiao et al, 2012; Zuo and Wang, 2015; Parsa et al., 2017a; Parsa et al., 2017b; Parsa et al., 2017c), success-rate curves (Agterberg and Bonham-Carter, 2005; Mirzababaei, 2016; Parsa et al, 2016a; Parsa et al, 2016b), distance-distribution analysis, and receiver operating characteristics (ROC) curves (Berman, 1977; Berman, 1986; Haddad-Martim et al., 2017; Parsa et al, 2018b). Among others, ROC curves provide for superior robustness and visual assessment of the relationship between structures and mineral deposits (cf. Carranza, 2009; Agterberg, 2013; Lisitsin, 2015; Haddad-Martim et al., 2017; Parsa et al, 2018a; Ramezanali et al, 2019). In Iran, ROC analysis has been used to investigate spatial distribution of chromite (Yaghoubpour and Hassan Nezhad., 2006), Pb-Zn (Hassannejad et al., 2001), iron (Najafi et al., 2010) and Cu deposits (Tanhaei et al., 2010, Zarasvandi et al., 2016). In this paper, two principal objectives were followed: (1) to investigate structural elements and (2) to identify relationship between these structures and mineralization. In this regard, fry (Fry, 1979), fractal (Mandelbrot, 1983) and distance-distribution (Berman, 1977, 1978) analyses were utilized to investigate structural controllers. As a result of these analyses, we could develop a suitable method for determining the main directions of dispersion of deposits with respect to linear structures. A combination of these methods has rarely been devised to investigate the spatial pattern of porphyry Cu deposits, with the results contributing to delineation of prospective areas for exploration activities.
2. Geological setting
Study area is located in the southwest of Central Iran, covering parts of the Sanandaj - Sirjan Zone and Urmia-Dokhtar magmatic belt (Dimitrijevic, 1973).
2.1. Stratigraphy
On the surface, the study area is covered by sedimentary, igneous, and metamorphic rock units that have been dated back to Palaeozoicto the present age, generally trending along a NW - SE direction. Dated back to Palaeozoic, the oldest deposits constitute the bedrock and are, in most cases, metamorphized. Exposed in parts of the Sanandaj - Sirjan Zone and Central Iran, these rocks are separated from the Sahebabad - Marvast Desert Embayment by the Marvast - Herat Fault which strikes along an NNW - SSE direction. This fault has remained active during the quaternary, leading to a drop down of the eastern wall with respect to the western wall. Metamorphized and non-metamorphized Permian rocks represent the youngest units of Palaeozoicage in this area. The rock units in this area have been subjected to two phases of metamorphism; one during the Triassic and another one during the Upper Jurassic. Various zones are separated from one another by faults in the NW-SE direction, some of which are further inclined toward an E-W direction (Soheili, 1981; khakzad and Jaafari, 2002).
An Upper Cretaceous colouredmélange zone is developed in the form of a narrow stripe with a width of about 3 -17 km and a length of about 125 km along the general trend of the region. This zone is mainly composed of basalt, split rock, green tuff, tuffy sandstone, ultra-basaltic rocks, limestone, and radiolaria, which are exposed in the tectonic zone. Adjacent to this zone, multiple faults are developed along a NW - SE direction, which together comprise a part of the Naein - Baft Main Fault. In between this zone and the Marvast - Herat Fault, there is an extensive embayment in the form of a graben, which includes the Sahebabad - Marvast Desert, that is itself a part of the greater embayment of Gavkhooni - Sirjan and hosts quaternary deposits. Besides the colouredmélange unit, there are Eocene volcanic rocks, indicating that the mentioned tectonic zone has been partly active in Eocene as well (Soheili, 1981).
The Urmia - Dokhtar Zone includes the highlands in the west, centre, and north of the mapped area. In this zone, limestones comprise the oldest rock unit, while the Upper Cretaceous densely folded flysches are ended up located at the centreof an anticline in the east. Due to the continental drift in Eocene, large amounts of lava and volcanoclastic rocks with basic and alkaline composition were emitted through deep paleo-fractures, with the Eocene sedimentary deposits formed at the same time. Following the Eocene, the compressive force melted the continental crust, developing intrusive rocks with the general composition of granodioritic and monzonitic quartz that cut through the Eocene rocks. During the Neogene, another round of extensive volcanic activities occurred with a moderate to acidic composition, and associated lava and volcanoclastic rocks covered the older rock units. An example of such volcanic activities occurred at Mozahem Volcano in the NE of Shahr-e-Babak (Soheili, 1981).
In Quaternary, a semi-deep mass of porphyry and dacitic micro-granodioritic rocks cut through the older strata, forming some light-coloured uplifts in mountainous areas. Intrusion of these semi-deep rock units and associated metamorphism have contributed to the formation of porphyry Cu orebodies and veins and minor accumulations of lead and zinc in this area. In the NW corner of the mapped area, the Upper Cretaceous is represented by highly folded and partly metamorphized flysches, and a NW-SE-trending syncline is seen in this area. The syncline is followed by Kerman Conglomerates and hosts some Middle Eocene lavas in the middle. The Anar Embayment is seen as a graben in between the Badbakhtkooh and mountain ranges in the central part of the mapped area, encapsulating the quaternary deposits. Rock bodies of granite, andesite, granodiorite, and diorite are dispersed as intrusions into the space between the main rock units of region (Fig. 2) (Soheili, 1981; Mirzababaei, 2016).
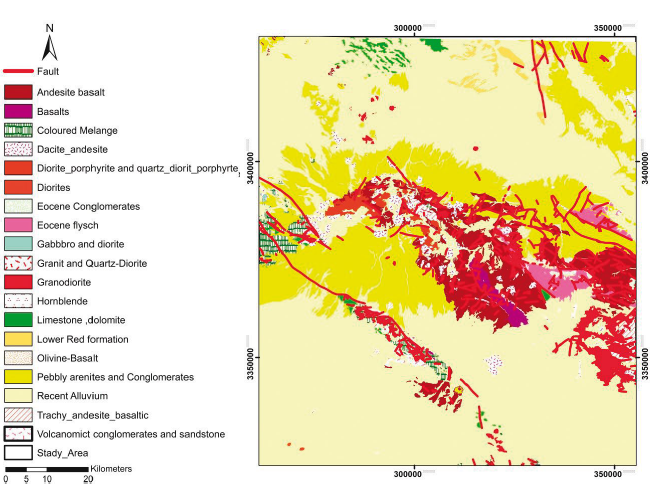
Figure 2 Simplified geologic map of the study area which is classified by age (modified from Soheili, 1981)
A total of 130 metallic and non-metallic mineralization occurrences are reported in this study area, including metallic reserves of Cu, Cu- gold, iron, and lead-zinc and non-metallic reserves of bentonite, stone, gypsum- anhydrite, industrial, phosphate, kaolin, soils, perlith, silica and pozzolan.
22 Structural geology
In addition to the Marvast - Herat Fault, there are three other faults in the mapped area, namely Anar, Shahr-e-Babak, and Rafsanjan faults. A major part of Anar Fault is extended beyond this area, but its southern end passesthrough the west of Anar City. Shahr-e-Babak is a dextral strike-slip fault with a length of 235 km that is developed along a NW-SE trend. Seemingly, Anar and Rafsanjan faults intersect on the west of the area (Soheili, 1981; Zarasvandi et al., 2016).
3. Materials and methods
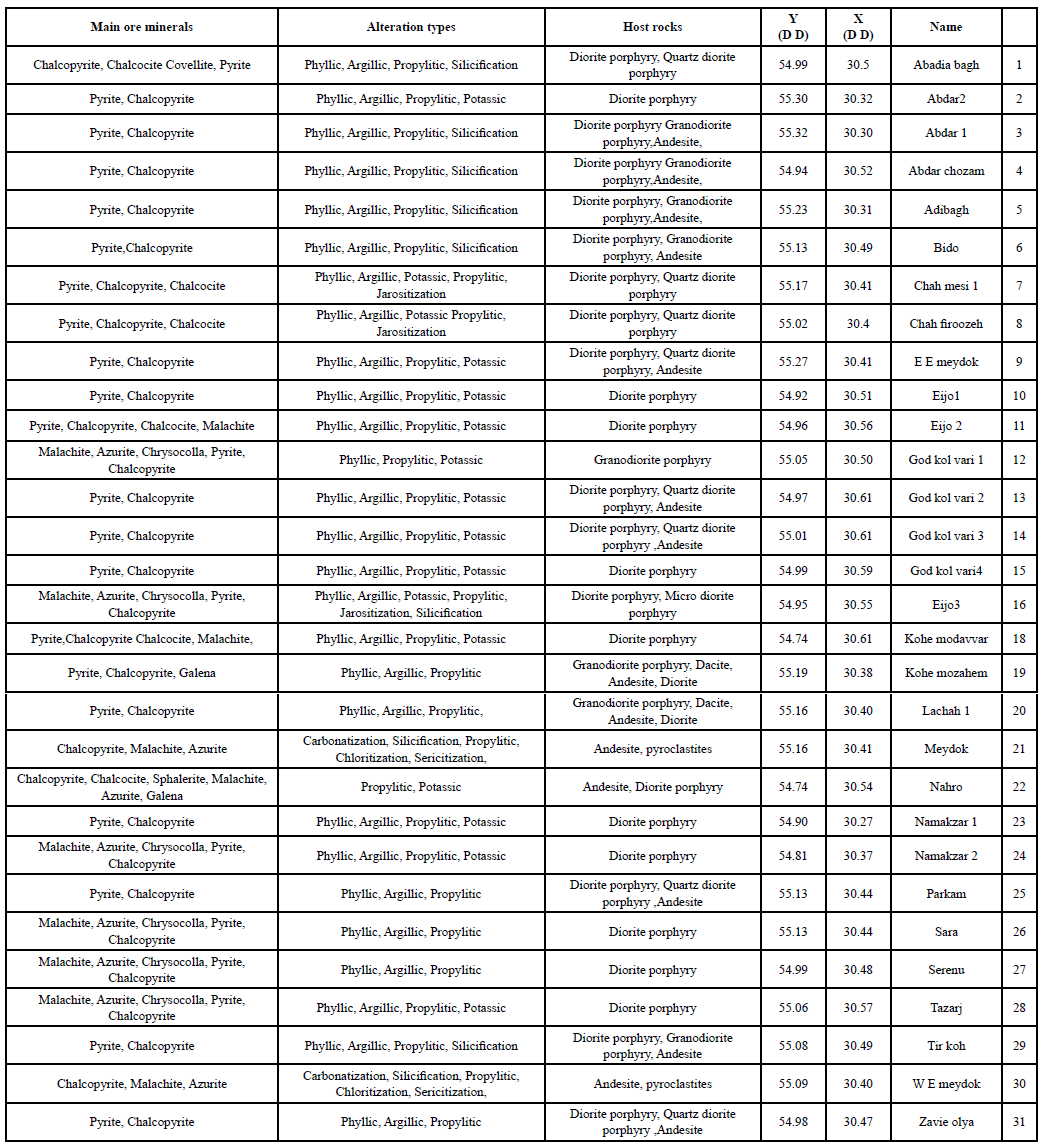
There are a total of 31 porphyry Cu deposits distributed in the area (Table 1). Here, we applied fry, fractal, and distance-distribution analyses in a row to achieve the objectives of our study.
3.1. Fry analysis
As a visual tool for understanding the distribution of mineral deposits, fry analysis considers mineral deposits as points (Vearncombe and Vearncombe, 1999; Hassan Nezhad et al, 2001; Najafi et al, 2010; Zuo, 2015; Parsa et al., 2016b) to represent their spatial distribution (e.g., Kreuzer et al., 2007; Carranza, 2009; Parsa et al., 2018a). The method has been thoroughly described by Carranza (2009).
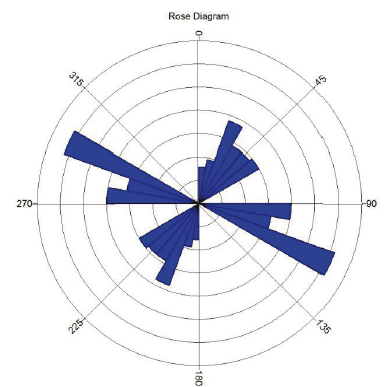
Fry analysis is a geometrical method for evaluating conformity of a geological point structure. It has been used by many geologists to analyse geological controllers of deposits (Kreuzer, et al, 2007 - Zuo, et al, 2009 -Carranza, 2009). It works by a transparent paper with horizontal and vertical axes intersecting at the centre of the paper. The centre point, marked by a sign, is superimposed on the corresponding point to a particular deposit and locations of other points are marked on the paper. The process is iterated for all points. Overall, the method leads to a total of n2-n fry points, or the so-called translated points, from the analysis of n mineral deposit locations. The translated points are then demonstrated on rose diagrams manifesting the directions through which deposits are distributed. The rose diagrams are developed using the length and trend of the obtained points (Carranza, 2009). Dominant trends on the rose diagram demonstrate the trend of probable mineralization controllers, which needs to be confirmed with the help of local structural geology of the area, deposit type, and geological conditions of the deposits (Haddad- Martim et al., 2017). The rose diagrams can be produced in two different ways, namely using all points or a given set of them. If the former is the case, the rose diagram will serve as a visual aid for interpreting regional-scale distribution of mineral deposits. In contrast, the latter case shows the distribution of mineral deposits on a larger scale, depending on the selected intervals (Carranza, 2009; Haddad-Martim et al., 2017). Interested readers are referred to Carranza (2009) for further discussion.
The processes can be easily implemented using relevant software tools such as Geo Fry Plot, given probable linear trends as output.
3.2. Fractal analysis
Fractal measures have been frequently applied in different branches of earth sciences (e.g., Afcal et al., 2011; Mansouri et al, 2015; Yousefi et al., 2015; Yousefi et al, 2016; Parsa et al, 2017a; Parsa et al, 2017d), especially for understanding the subtle patterns embedded in the spatial distribution of mineral deposits (e.g., Carlson, 1991; Raines, 2008; Carranza, 2008; Carranza, 2009; Carranza and Sadeghi, 2014). Among a whole host of fractal measures proposed, the s-called box-counting (Pruess, 1995) and radial-density (Mandelbort, 1983) approaches can be used to assess spatial distribution of deposits, on which we will elaborate here.
3.2.1. Box-counting (B-C) measure
Fractal dimension of mineral deposits can be determined by the box-counting (B-C) method. In this method, a sheet is divided into a mesh of square cells of the size ε, and the cells with known mineralization points N (ε) are counted. In order for the distribution pattern of the counted points to follow the fractal geometry, the conditions of the below power-law function have to be satisfied (Mandelbort, 1983; Feder, 1988; Pruess, 1995; Carranza, 2008; Carranza, 2009; Carranza and Sadeghi, 2014).
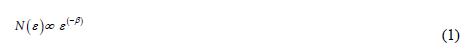
In the above equation, œ means proportion and ß is the fractal dimension, which either ranges between 0 and 2, or is equal to 2. The latter case shows a complete spatial randomness. In a log-log plot, the equation will be a linear relationship, or (Carranza, 2008):

Where α is the intercept and ß is the slope of the linear log-log plots of N (ε) versus ε.
3.2.2. Radial-density (R-D) measure
The Radial- Density (R-D) measure of fractality is expressed by the below equation (Mandelbrot, 1983):

In which d is the point density within a given location, C is a constant, r is the circle radius, and D is the fractal dimension. The foregoing function means that spatial distribution of points around a reference point is fractal should the point density decreases with distance from the reference point (Haddad-Martim et al., 2017). Actually, this method calculates the deposit density (i.e., the number of deposits / unit circle area) from a reference point. Interested readers are referred to Agterberg (2013) for further discussion.
3.3. Distance-distribution analysis
This method is perhaps the most popular method for measuring the spatial association of mineral deposits with geological structures (Berman, 1977, Berman, 1978 Berman, 1986) in a quantitative way (Carranza, 2008). Details about this method have been extensively explained by Carranza (2009), precluding us from further explanation. It works on the basis of three curves, namely, D1, D2, and the contrast curve (i.e., C = D2 - D1) measures the distance from each point to deposit locations, manifesting a complete spatial randomness. D2, however, measures the distance of each structure from different deposit locations. Positive and negative values of C show positive and negative spatial associations of structures with mineralization, respectively (Carranza, 2008).
4. Results
Since Eocene, joints of the region have been among the oldest geological features and significantly contributed to forming regional faults. Joints play a crucial role in providing dikes with the required space for intrusion. Formation and concertation of joints into regional intrusive bodies have been affected by shearing mechanisms, geothermal solution pressure, and intrusive process of rock mass emplacement.
In order to determine the relationship between Cu mineralization and geological structures, data of faults and deposits across the study area was drawn (Fig. 3) and subjected to independent fractal analysis.
4.1. Fractal analysis of faults
Acting as controlling factors to orebodies, patterns of local and regional fractures and geology of the area are of paramount importance. Satellite images enable geologists to identify associations between orebodies and regional lineaments. In a mineralization zone, the frequency of fractures and lineaments can lead exploration activities as they serve as channels for fluid flow.
Lineaments and fractures in a mineral zone may not be easily identifiable from satellite images. Accordingly, filtering is used to detect these features on the satellite images. The most popular kernels for feature detection are 3 * 3, 5 * 5, and 7 * 7 kernels. Knowing that the band 8 of the ETM+ sensor provides for a higher spatial resolution than the other bands of the same sensor, we herein used band-8 data to detect lineaments, followed by applying three oriented filters at 00, 450, and 315° with a 3 * 3 kernel to identify regional fractures along N-S, NE-SW, and NW-SE directions, respectively.
Once finished with extracting the faults and fractures by means of the mentioned methodologies and correlating them to the fractures indicated on 1:100,000 map of the region, a new map of fractures was prepared. Afterwards rose diagrams of fractures and faults were plotted. The map of spatial distribution of faults, determined by the analysis of remotely sensed data, shows three major NE-SW, NS, and NW-SE- trending fault systems (Fig. 4). While NW-trending faults run parallel to magmatism in the area, NE-trending faults, that are younger than the first group (Mirzababaei, 2016; Zarasvandi et al,, 2016), intersect with older geological units. The NS-trending faults, however, are apparently the youngest reportedly active faults on a local scale (Meshkani et al., 2013).
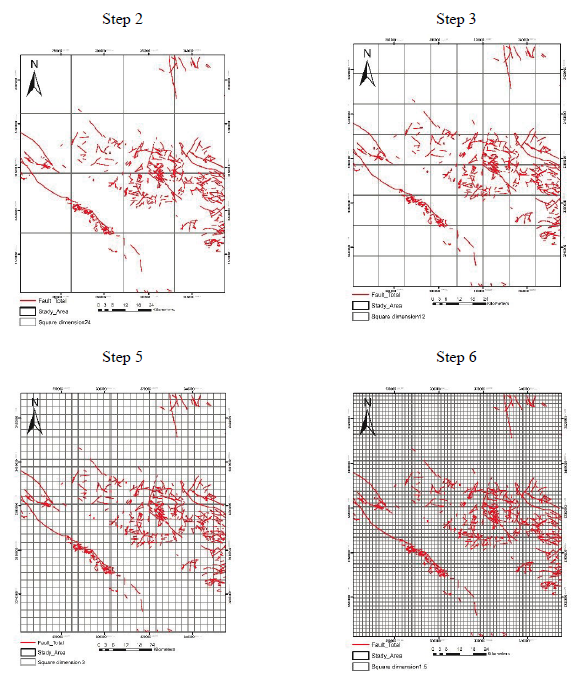
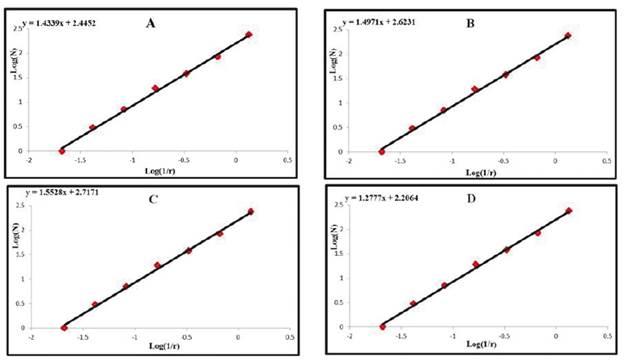
To determine fractal dimension of the faults, first, fracture maps of the area were divided into 4 squares grids of 48 km in side length (grids a, b, c, and d), with each grid sub divided into four identical squares. This process was iterated 6 times to come up with different numbers of squares and square sizes r at each iteration. Then, each square was analysed separately and a fractal dimension was calculated for each square grid (a, b, c, and d) (Fig. 5). Figure 5 shows a stepwise presentation of the box-counting method for measuring the fault fractal dimension (D). At each stage, the cells with the size r containing faults were counted and considered as N (r) in Equations 1 and 2 (Table 2). On the basis of the logarithmic graphs plotted (Fig. 6), four fractal dimensions were calculated for the four grids a, b, c, and d (Fig. 6). The calculated values are D α = 1.4339, Db= 1.4971, D c =1.5528, and Dd= 1.2777.
Table 2 Square dimension (r) and the number of cells containing faults (N) for 4 square grids a, b, c and d.
| Level | r (km) | Box Count (Na ) | Box Count (Nb ) | Box Count (Nc) | Box Count (Nd ) |
|---|---|---|---|---|---|
| 1 | 48 | 1 | 1 | 1 | 1 |
| 2 | 24 | 3 | 4 | 4 | 3 |
| 3 | 12 | 8 | 12 | 13 | 7 |
| 4 | 6 | 23 | 31 | 35 | 19 |
| 5 | 3 | 61 | 88 | 110 | 38 |
| 6 | 1.5 | 150 | 205 | 260 | 84 |
According to the results, the square grid c exhibits the largest fractal dimension, implying that it hosts the largest number of intersecting faults and hence, making it the most favourable part of the study area for prospecting further porphyry Cu deposits (cf. Carranza, 2009). Interestingly, deposits are more frequent in this region, showing the efficacy of the fractal method adopted. In other regions, however, the fractal dimension declines as they host fewer faults.
4.2. Fractal analysis for deposits
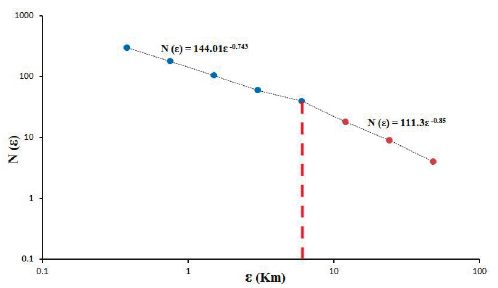
In order to implement the box-counting procedure, the study area was divided into a grid of cells with different dimensions in several steps and those that were superimposed by the deposits were counted. The log-log plot of the number of cells containing deposits N (e) versus the square length was prepared (Fig. 7). The B-C analysis exhibits that the pattern of the Cu deposits has two fractal dimensions, i.e., ß = (D 1 = 0.74, and D 2 = 0.85) and determined by one breakpoint on the plot (= 6 km).
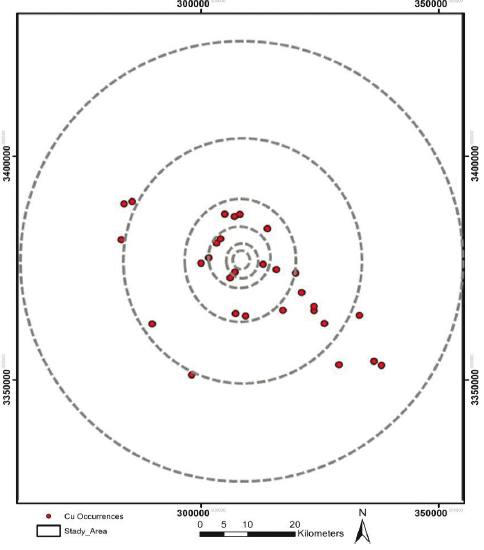
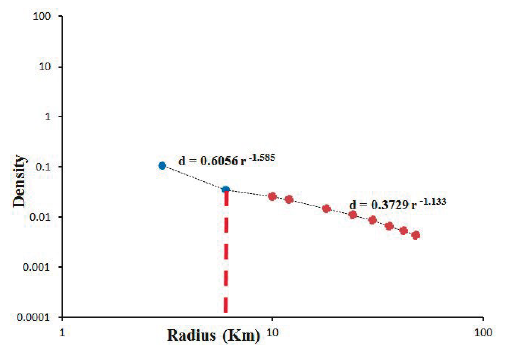
Authors also used the R-D fractal modelling (Fig. 8) to further investigate spatial distribution of the porphyry Cu deposits in Dehaj Area. For this purpose, the r-radius circles hosting Cu occurrences were counted. The result was, then divided by the area to obtain d in Equation 3 (Table 3). Figure 9 shows the loglog plot of radius (r) versus the density (d). As it can be observed in this figure, two fractal dimensions were observed, which were separated at around 6 km.
Table 3 Radius (r) and density (d = number of Cu occurrences in the circle/circle area).
| Level | r (km) | number of Cu occurrences |
|---|---|---|
| 1 | 48 | 31 |
| 2 | 24 | 23 |
| 3 | 12 | 17 |
| 4 | 6 | 6 |
| 5 | 3 | 1 |
| 6 | 1.5 | 0 |
Results of the two fractal methods (B-C, R-D) are almost identical, showing that two structural processes at different scales (< 6 km and > 6 km from the deposit locations) have controlled the emplacement of porphyry Cu deposits in Dehaj Area (Figs. 7 and 9).
4.3. Fry analysis for deposits
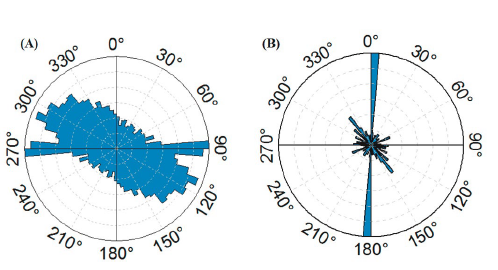
The fry analysis was applied on the 31 known porphyry Cu deposits in Dehaj Area, resulting in 930 fry points (Fig. 10). Initially, we used a rose diagram to show the trends of all fry points (Fig. 11a). This method sheds lights on the structural controls on mineralization that have acted on a regional scale (e.g., Parsa et al., 2018a). According to Fig. 10a, the regional controls on mineralization have plausibly operated in a major NW-SE and a minor E-W direction. Furthermore, with reference to the breakpoints separating fractal dimensions in Figs. 6 and 9, which are 6 km apart, we further developed a rose diagram for fry points that are within 6 km of one another (Fig. 11b). This figure shows a general N-S inclination, manifesting that local-scale controls on mineralization have probably contributed to the development of mineralization in an N-S direction.
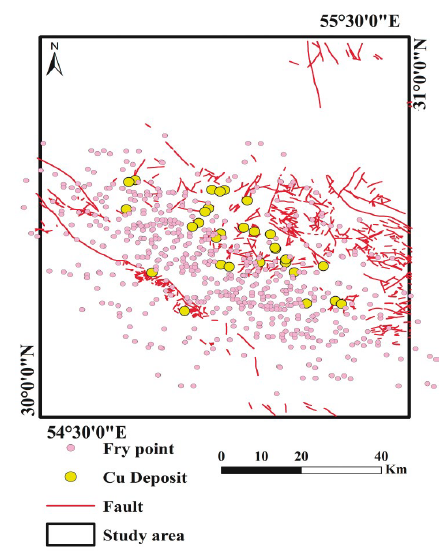
Local investigation of Cu indices shows that, for the most part, Cu mineralization has occurred within intersection of faults with the mentioned trends. The fry pattern of the region and rose diagram of Cu index orientations indicate a general NW-SE trend, which is in good agreement with the trend of dominant fractures in the region.
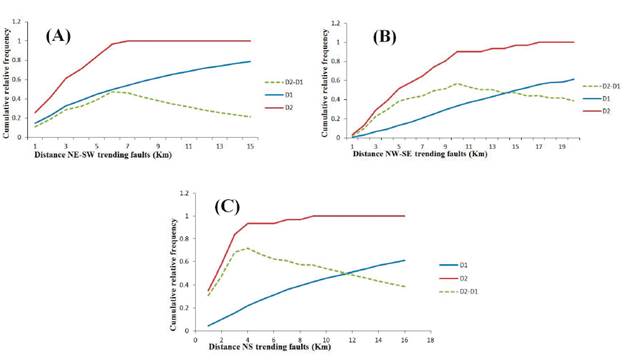
4.4. Distaance-Distribution analysis
Various structures, including faults with diverse directions, are resulted from different tectonic processes; however, only a limited number of tectonic processes are associated with mineralization (Faulkner et al., 2010). Therefore, mineralization-related tectonic processes should be identified. One way for recognizing mineralization-related fault systems is through measuring their spatial association with mineral deposits by the distance-distribution analysis; a positive relationship manifests a mineralization-related fault system while a negative relationship shows fault systems that are not associated with mineralization (Carranza, 2008). In this study, three distances -distribution graphs were plotted for three fault systems in the area, NW-, NE-, and N-trending faults (Fig. 12). According to this figure, all of these three fault systems are associated with porphyry Cu mineralization, as indicated by their positive association with mineral deposit locations. The highest positive spatial association between the NE-trending faults and mineralization was seen for the deposits within 6 km of the faults (Fig. 12a). Likewise, the highest positive spatial association was observed within a distance of about 10 km from the NW-trending faults (Fig. 12b). However, the most significant spatial correlation between mineralization and the N-trending faults is observed within a distance of merely 4 km from these faults (Fig. 12c). This shows that the NW- and NEtrending fault systems have controlled the distribution of faults on a regional scale while the N-trending faults have controlled the distribution of faults on a local scale.
5. Discussion
Porphyry Cu deposits are structurally controlled (Sillitoe, 1972, 2010; Padilla et al., 2001). Therefore, recognition of structural controls of this type of deposits is very important in exploration surveys. Analyses of spatial distribution of mineral deposits and spatial association of mineral deposits with fault systems can pave the way for addressing this challenge (Vearncombe and Vearncombe, 1999; Kreuzer et al., 2007; Lisitsin, 2015).
In order to investigate the regional fractures, an analysis was performed on the faults (including continuous and discontinuous faults) and the joints systems. Regional faults are dominantly strike-slip in nature (accompanied with small thrust or graben components in some cases) and follow different trends. Investigations showed that the regional faults have been formed as a result of the shearing effect applied to the Urmia-Dokhtar magmatic belt. Upon continuing the shearing mechanism and the resultant progressive deformation, alterations occurred to the faults and their geometrical associations. Regional joints systems are also developed as a result of the shearing mechanism and/ or folding process. The progressive deformation within the shear zone has further affected the joints systems. A large number of jointed tuff strata have been rotated, with the other intrusive tuff bodies further experiencing shearing-induced changes. Another factor contributing to deformation of the region is the small shearing zones developed between the regional faults. Such shearing zones tend to further complicate the joints systems, mix up the strata, etc. Since the study area is located on the Urmia - Dokhtar igneous belt within the dextral shearing zone delimited by Rafsanjan Fault in the north and Shahr-e-Bakak Fault in the south (both of which are dextral strike-slip faults with some dip-slip components), then reginal fault analysis was performed on the basis of shearing mechanism. Existing literature have shown that NW-SE faults are the oldest in the region. For most part, these faults are longer than the other faults in the region, being observed along the longitudinal axis of intrusive bodies. Due to erosion and lack of visible evidence of the fault surface to ensure reactivation of these faults, they seem to be primary faults in the region, which are formed sometime after the Eocene. If the amount of fault gouge along the fault surface is zero or negligible, the fault is said to be a periodic fault. This feature is seen for most of the faults in the region. Another characteristic of the faults in the region is the absence of fractures on the fault surface, which is another indication of faulted joints. Dominant trend of joints in the region is well in agreement with the trend of adjacent faults. Last but not the least, in-fills of chlorite and calcite can be seen on the fault surfaces for most of the faults in the region. The fact that the lithology of these in-fills is identical to that of near-fault periods further confirms that the mentioned faults are faulted joints.
The fractal analysis of the fault systems (e.g., Zhao et al., 2011), showed that the faults are significantly associated with mineralization (Figs. 5 and 6). In other words, an abundance of mineral deposits and fault systems is observable in the SE part of the area (grid C in Fig. 6) in which the fractal dimension is at its peak (1.748). These results are significant as fault systems are corridors for raising magmatic and hydrothermal fluids that develop mineralization (Pirajno, 2012).
Results of fry analysis (Fig. 11), fractal analysis (Figs. 7-9), and distance-distribution analysis (Fig. 12) were in agreement with one another showing that the NW- and NE- trending faults were responsible for regional-scale processes that have contributed to the development of mineralization. Furthermore, these analyses demonstrated that the N-trending faults are the local-scale controls on mineralization. These results have been achieved by numerical techniques in this paper and comply with the previous results achieved by other studies in Dehaj Area (Meshkani et al., 2013; Zarasvandi et al, 2016). In these studies, it has been reported that the NW-trending Dehshir-Baft strike-slip fault is the major structural control on the magmatism and the development of porphyry Cu deposits in the study area.
6. Conclusion
In this study, a range of numerical techniques were applied, including fry, fractal, and distance-distribution analyses, for the recognition of structural controls on porphyry Cu mineralization in Dehaj Area. By combining these methods, useful results were obtained to help understand the processes contributing to the formation of mineral deposits. Indeed, porphyry Cu masses were found to be more probable to intrude and accumulate along the margins of huge faults and shear zones. It was further indicated that evaluation of mineralization direction with respect to fault direction can provide insights into the role of faults in emplacement of Cu mineralization. Based on the results of spatial analysis, mineralization direction was conformed to faults directions in most parts of the study area. The fry analysis demonstrated that the study area had three intersecting fault mechanisms.
Fractal analysis of the fault systems revealed that the fractal dimension reaches its peak in the SE part of the area where there is an abundance of faults and mineral deposits, showing that faults are inextricably linked with porphyry Cu mineralization. In addition, the results of fry, fractal, and distance-distribution analyses of mineral deposit locations were in agreement with findings of previous geological studies of the area. These techniques demonstrated that whilst the NW- and NE-trending faults are responsible for the regional-scale deposition of mineralization in the area, the N-trending faults have probably acted as the local-scale controllers of mineralization in the area.

