


 English (pdf)
 Article in xml format
 Article references
 Send this article by e-mail
 Cited by SciELO
  Cited by Google
  Similars in
SciELO
Similars in
SciELO  Similars in Google
 Permalink
1. Introduction
In a previous study under agreement #06 between the Colombian Geological Service (from now as CGS) and the Universidad Nacional de Colombia, mesoproterozoic gneisses, quartz veins, and pegmatitic dykes that cut granitic bodies belonging to the Mitú Migmatitic Complex unit, were found and extracted along the Guainía River (Guerrero et al., 2017). The translucent minerals presented are mainly quartz, tourmaline, microcline, plagioclase, biotite, and muscovite. While the opaque minerals are magnetite, ilmenite, hematite, chalcopyrite, and pyrite in low content. The presence of ilmenorutile was also reported (Guerrero et al., 2017), hosted especially on pegmatites with considerable percentages of niobium and tantalum, mainly due to the occurrence of columbite inclusions.
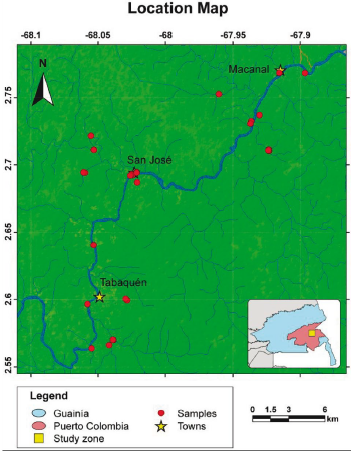
Figure 1 Location map of the study area presenting where the samples were taken and the municipalities of Tabaquén, San José, and Macanal. In the lower right map, the department of Guainía and in red, the corregimiento of Puerto Colombia. The map is modified from geoportal.igac.gov.co.
Magnetite and ilmenite are petrogenetic indicators that allow calculating genetic parameters such as temperature and oxygen fugacity for a more thorough understanding of the magmatic-hydrothermal fluid evolution and thereby, contribute to the geological knowledge of the Colombian Amazonian Craton, a core objective of this work. Additionally, based on magnetic petrology concepts, these parameters allow identifying the behavior of the trace elements reflected in the crystallization of the oxides. Petrography and metallography methods were used to analyze twenty-five thin polished sections provided by the CGS, complemented with magnetic susceptibility values measured in hand samples, to establish possible petrological relationships for the area evaluated. The results obtained from this work were also complemented by a microthermometry and translucent minerals chemistry analysis, provided by the other participants of the agreement.
2. Methodology
Using a reflected/transmitted light Olympus CX31 microscopy, twenty-five thin sections of granites, pegmatites, quartz veins, and gneisses were used in petrography and metallography for identifying mineralogy, textural variations, the occurrence of oxides, secondary processes and paragenetic relations. Eleven samples were selected for chemical analysis distributed in three samples of the granitic host-rock, seven pegmatite dykes, and one quartz vein.
Due to the secondary processes' degree like oxidations or exsolutions, magnetite, ilmenite and ilmenorutile crystals with the less alterations were used to obtain the most accurate results. This is because those secondary processes can modify the trace element content due to their partition coefficient. Additionally, the magnetite and ilmenite crystals were paired and classified into five types optically defined as in paragenesis (Figure 2), ensuring that both minerals are in chemical equilibrium:
Types I and II (24 samples) pairs are in paragenesis, the difference is that in type I none present alteration while in type 2, one or both encounter a lower degree of alteration processes
Type III (2 samples) and type IV (4 samples) pairs are not in contact but remarkably close; in type III, none of the crystals are altered, while in type IV, either one or both are altered.
Type V (2 samples) are crystals whose occurrence is unique; they are not in paragenesis, they appear oxidized and therefore do not contribute to the study's conclusions
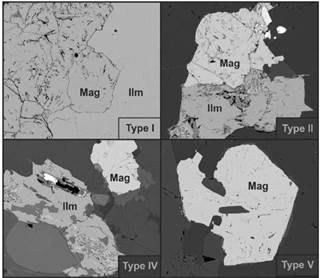
Figure 2 Backscattered electrons (BSE) photographs showing four of the five types of magnetite-ilmenite pairs classified.
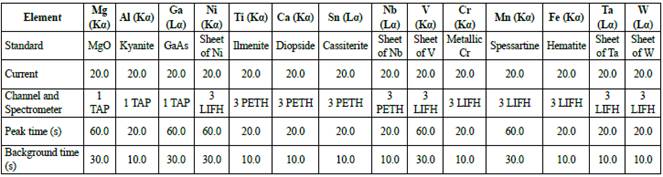
The 215 quantitative analyzes measured with a Wavelength-Dispersive Spectrometer (WDS) were taken at the edge, center, and an intermediate point of each crystal to identify zoning. The compositional maps were obtained by qualitative measures with the Energy Dispersive Spectrometer (EDS) of Fe, Ti, Sn and W, distributed in one magnetite, two ilmenite, and one ilmenorutile. Both data types were collected with the Electron Probe Microanalyzer (EPMA) JEOL JXA-8230 in the Department of Geosciences of the Universidad Nacional de Colombia, with a current of 20 A. The other measurement parameters are described in Table 1.
The original FeO values were recalculated with the ILMAT program (Lepage, 2003) to get both Fe2+ and Fe3+ content. It should be considered that the formulas used for magnetite are different for ilmenite and hematite since they are part of different isomorphic series and their Fe2+/Fe3+ ratio are different. Considering the average of three measures for each crystal, once the ferric and ferrous ion values were recalculated, an average was calculated and the crystals whose total compositional closure is between 99.0 and 101.0% were used for further calculations.
The magnetic susceptibility of each sample was measured to determine correlations between the abundance of magnetic minerals and their composition. For this purpose, three measurements were obtained in different surfaces for each sample to obtain an average. The data was obtained with a ZH Instrument SM30 device with a sensitivity of 1x10⁻⁷ SI units (ZH Instruments, 2008)
3. Geological framework
3.1 Regional Geology
The Amazonian Craton is part of the nucleus of the South American continent. It is geographically divided by the Guiana Shield located at the north and the Guapore Shield at the south. Based on dating from multiple methods, several authors have divided the craton into various geological provinces, including a six provinces model by Tassinari and Macambira (1999) and an eight provinces model by Santos et al. (2008) (figure 3A); the eight provinces model is currently accepted and used by the geological service of Brazil (Hasui et al., 2012), hence is the one based for this work.
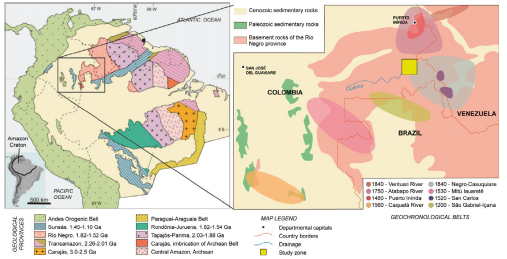
Figure 3 A. Map of geological provinces, taken from Santos et al. (2008). B. Geochronological belts in the Rio Negro province between Colombia, Venezuela, and Brazil, proposed by Cordani et al. (2016).
The rocks hosted in the Guyana Shield show a mylonitization event generated by sinistral efforts, an oblique compression, and intense failure produced during the Sunsas orogeny (1450-1100 Ma). This transpression phenomenon has been identified as the K'mudku Mylonitic event or Orinoquiense event known in Venezuela. Samples collected in this area show dynamic metamorphism that might be related to this K'Mudku event (Santos et al., 2008).
Rio Negro Province
Defined as Rio Negro-Juruena by Tassinari and Macambira (1999), Santos et al. (2008) later subdivided it into the Rio Negro province, in the north of Brazil, and the Rondonia-Juruena province, in the south. Was accrued in the Mesoproterozoic (1.5-1.3 Ga ago) and outcrops between eastern Colombia, specifically in Guainia and Vaupes departments, southwest Venezuela and northwest of Brazil.
It is constituted by the Paleoproterozoic Tiquie Suite unit composed of monzogranites, syenogranites, and alkaline granites of 1750 Ma; the metamorphic Tunui Group of 1700-1520 Ma, and the Cumati Complex consisting of orthogneisses, granodiorites, and tonalites of 1700 Ma. These units are intruded by the granitic Inhamoim and Rio Içana Suite of 1540 Ma (Hasui et al., 2012). Anorogenic A-type granites with rapakivi texture have also been reported, with syenites, mangerites, and charnockites with great economic interest due to the occurrence of strategic minerals composed of niobium and tantalum (Tassinari & Macambira, 1999).
Based on U-Pb, Sm-Nd, and Rb-Sr datings, Cordani et al. (2016) separated the Rio Negro province in geochronological belts, including the Atapabo and Vaupes belts. The Atapabo Belt consists of granitoid formed between 1800 - 1740 Ma and is intruded by 1.5 Ga granitic bodies. The Vaupes Belt is constated of granitoid, syntectonic gneisses, and migmatites in amphibolite facies, with an age of 1580-1520 Ma (Figure 3B).
3.2 Local geology: Mitu Migmatitic Complex
The granitic rocks outcropping in the study area belong to the Mitu Migmatitic Complex, whom genesis is associated with the Rio Negro province accretion and is subsequently affected by an anorogenic magmatism between 1575 and 1450 Ma (Cordani et al., 2016; Lopez & Cramer, 2014).
This complex is divided into the Pringamosa Granite, which presents granitic composition with biotite and migmatitic structures; the Gneiss del Yi with migmatitic texture and alkaline eye-shaped feldspar surrounded by biotite and quartz; and the Monzogranite of Mitu that presents phanerite-like, inequigranular texture, and a slight orientation (Rodríguez et al., 2011). Gneisses of the complex present Rb-Sr ages between 1557 and 1758 Ma, and U-Pb ages between 1480±70 and 1846±45 Ma (Bonilla, 1981; Rodriguez et al., 2011).
During the fieldwork, granitic rocks with inequigranular to equigranular texture were found. The composition varies between monzogranite, syenogranite, and alkaline feldspar granite, with medium to thick crystals of alkaline feldspar, quartz, plagioclase, biotite, ilmenite, and magnetite. The pegmatites cut the granites along discontinuous dykes with diffuse edges; some have lenticular geometries with thicknesses less than 35 cm and a length between 2 cm to 4-5 m. Do not present visible zoning and their texture is uneven with crystals up to 3 cm. Its composition is similar as granitic rocks; however, they contain more quartz, tourmaline and ilmenorutile. Structurally, have an N-S, E-W, and NW-SE orientation, where N-S orientation dikes have a higher ilmenorutile content, which means a more significant economic interest.
Those discontinuous dikes of up to 3 m and thicknesses between 3 and 50 cm present quartz veins. They are predominantly composed of hyaline and milky quartz, tourmaline, hematite, epidote, and in some cases, plagioclase, muscovite, and ilmenite. Some have drusy or massive growth textures. Finally, metamorphic rocks also emerge, such as granitic orthogneisses and paragneisses with micas, tourmaline, and quartz in boudinage structure.
4. Geochemistry of iron-titanium Oxides
The iron-titanium oxide system is represented in a ternary diagram with TiO2 (rutile), Fe2O3 (hematite/maghemite), and FeO (wustite). This group of minerals has a significant petrological value since they are good as geothermometers and geobarometers.
There are three isomorphic series in this ternary system: titanomagnetite, titanohematite/titanomaghemite, and pseudobrookite. The titanomagnetite varies from magnetite to ulvó'spinel, ranging from ferromagnetic to antiferromagnetic, while titanohematites from hematite to ilmenite and are antiferromagnetic. The ilmenorutile can be considered as a variety of rutile enriched in niobium or a mineral belonging to the strüverit series, the compositional extreme with tantalum.
4.1 Magnetite
Trace elements in magnetite can be used to discriminate its origin thanks to their partition during crystallization in magmas or hydrothermal fluids (Dare et al., 2014). The coexistence of a crystal from the magnetite-ulvó'spinel series with a crystal from the ilmenite-hematite series, are utilized as a petrogenetic indicator because function as geothermometers and geobarometers. It also allows obtaining oxygen fugacity (fO2) values. Seen in a T-fO2 diagram, a pair of crystals from the two genetically related mineral series will obtain an intersection of their respective isopleths at a specific temperature and oxygen fugacity point (Bowles et al., 2011).
Magnetic Petrology
Magnetic petrology represents the union between conventional petrology and magnetic susceptibility of rocks, focused on characterizing composition, abundance, microstructure, and paragenesis of magnetic minerals. It also contributes the knowledge of those processes that give rise to genesis, alteration, and destruction of magnetic minerals in rocks (Clark, 1997).
The confidence level of the results will depend on the pair of crystals' equilibrium. Therefore, three factors must be considered: (1) the paragenesis and textures of the crystals. (2) Identifying characteristics that determine a change in chemistry and infer changes of temperature and oxygen fugacity of the system such as multiple mineralizing events, alterations and exsolutions such as martitization, mushketovitization, or oxy-exsolution. These can be identified in the petrography. (3) The ratio of the log calculated on magnetite and ilmenite (Mg/Mn).
The magnesium and manganese partition in both minerals are independent of the oxygen fugacity, therefore, allow to graphically identify if both minerals are in equilibrium if the regression of a continuous line with a positive slope is closest to 1. Bacon & Hirschmann (1988) found this relationship and stated that commonly occurs in fresh volcanic rocks. This work also applies the Bacon & Hirschmann method in pegmatitic rock.
The iron will have an affinity to occur as a native mineral, silicate, or oxide. There are three primary buffers reactions that control this behavior: HM, FMQ, and QIF (equations 1, 2, and 3). These do not occur in nature but explain the behavior of iron depending on the T and fO2 of the environment (Frost, 1991; Nadoll et al., 2014).
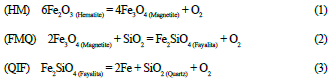
When the temperature of the fluid decreases, rebalancing reactions occur. These define the partition of the minerals, the behavior of the elements, and the processes of exsolution or oxidation (Frost, 1991b). The rebalancing processes can be the oxide-oxide type, where a titanium exchange occurs; the inter-oxide type, creating an oxyexysolution process which is seen as the exsolution of ilmenite lamellae within the titanomagnetite; an oxide-silicate type described by the reactions QUILF, QUILO and KUILB (equations 4, 5 and 6 respectively) (Frost et al., 1988; Ghiorso & Sack, 1991; Lindsley et al., 1990).
6. Results
6.1 Petrography and Metallography
The petrography presented general and specific textures, composition, oxidation processes, occurrence, and characteristics of the oxides were identified (Table 3). The percentages of the rock-forming minerals were complemented with those presented in Bayona-Valderrama (2023), Mora-Galindo (2023), and Cardona (2023), and then, used in the Streckeisen (1967) ternary diagram of the classification of igneous rocks.
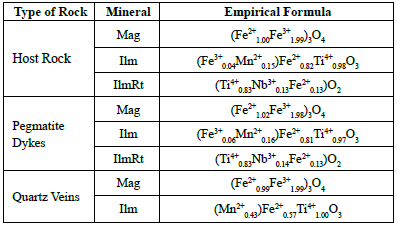
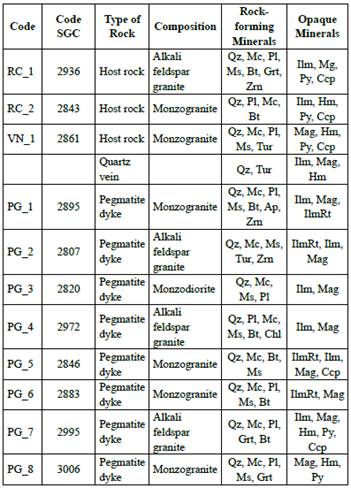
Table 3 Mineralogical distribution of the 11 samples analyzed with EPMA; the data was obtained by petrography. Qz: quartz; Mc: microcline; Pl: plagioclase; Ms: muscovite; Bt: biotite; Grt: garnet; Tur: tourmaline; Zrn: zircon; Ilm: ilmenite; Mg: magnetite; Py: pyrite; Ccp: chalcopyrite; Hm: hematite, IlmRt: ilmenorutile.
The variation in host rocks' composition allows classifying them into two types. Type 1 rocks vary between monzodiorite and monzogranite, outcrop in the north part of the study area, have smaller crystal sizes, and may contain subordinate ilmenorutile. The chalcopyrite is altered to covelline. The type 2 rocks vary from monzogranite to alkali feldspar granite composition, with larger crystals and are mainly composed by plagioclase. Biotite and magnetite appear in smaller sizes and may include monazite.
The composition of the pegmatitic dykes is mainly monzogranitic to alkali feldspar granite. The microcline is the principal translucent mineral, appearing as subhedral crystals of thick size grains. It has a slight degree of alteration, perthitic texture, plagioclase inclusions, and no zoning. The plagioclase is less abundant, may show polysynthetic or Carlsbad twinning and has a greater alteration degree into sericite. The biotite has euhedral forms and is predominantly chloritized. Tourmaline is from the black variety, appearing scattered in the pegmatites and towards the contact between quartz vein and the host rock. Accessory minerals include apatite and zircon, which are usually in paragenesis with micas and oxides.
The composition of quartz veins is monzogranitic. Is important to highlight that, according to the information collected during the field phase, rocks found in veins with a high quartz content, some with drusy texture, are called "veins". However, both in macro and petrography, those quartz veins can present subordinate crystals of plagioclase, muscovite, or microcline.
Most oxides appear very related to micas. In general, ilmenorutile is not in contact with magnetite or ilmenite. The occurrence of oxides varies according to the type of rock:
Magnetite is the principal oxide, with an average of 2.39% in host rock and 2.24% in pegmatites. Both in the host rock and the pegmatite, it appears partially oxidized to hematite, mainly around fractures and exfoliation planes. Within the quartz veins, magnetite is turned into hematite, which indicates that in the evolution of the fluid, the oxygen fugacity has increased. In most cases, it does present subhedral to anhedral geometries and does not present inclusions or exsolutions.
The abundance of ilmenite is 2.46% in the host rock, 1.11% in pegmatites, and 0.75% in quartz veins. It presents subhedral to anhedral shapes, usually elongated. Most crystals contain hematite exsolution and, to a lesser extent, rutile. This exsolution process is presented either with sub-parallel oval shapes or disorderly (Figure 5D). In some cases, it can be perceived that hematite exsolutions present one more exsolution of another mineral that may correspond to ilmenite-hematite (McEnroe et al., 2007).
Ilmenorutile appears mainly in pegmatites with a 1.25% abundance, while in the host rock, it is 0.04%. It has subhedral to euhedral geometries, with no alterations or exsolutions. 0ccasionally, presents columbite inclusions.
All hematite crystals found are secondary, coming from the magnetite oxidation or ilmenite exsolution. The rate of hematite crystals is 1.26% in the host rock, 1.50% in pegmatites, and 0.75% in quartz veins. The magnetite/hematite ratio is lower in the quartz veins because of high oxidation.
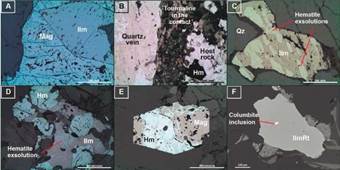
Figure 5 Micro-pictures of the oxides. Hm: hematite, Mag: magnetite, IlmRt: ilmenorutile, Qz: quartz. A: (sample PG_2) Magnetite-ilmenite pair type II, the hematite is around the edges and fractures due to oxidation, in XPR. B: (sample VN_1) Tourmaline and hematite located in the contact between the quartz vein (left) that cuts the monzogranite (right), in PPL. C: (sample PG_2) Hematite exsolution with elongated and subparallel shapes, in XPR. D: (Sample RC_3) Disorderly hematite exsolution in ilmenite in paragenesis with magnetite completely oxidized to hematite, in XPR. E: (sample RC_3) Magnetite crystal with a high degree martitization, in XPR. F: (sample PG_5) Back Scattered Electron (BSE) image of columbite included on ilmenorutile.
6.2. Electron Probe Micro-analyzer (EPMA)
From the 215 points analyzed at the center, edge, and intermediate point for each crystal, 123 fell in the closing range between 99.0 and 101.0%, which is the one accepted for this work. The results are reported in tables 4 to 10. Since this analytical technique does not discriminate iron ions, the ferrous and ferric iron values were recalculated from the FeO data obtained. Then, those values were used for petrological calculations in the ILMAT program and the measure of empirical formulas of oxides (Table 2).
Table 4 Quantitative results of magnetites in host rock samples. The oxides content is in wt%, and the Fe2O3 and FeO valúes are recalculated from FeO*. B: edge; C: center; M: intermediate point.
Table 5 Quantitative results of magnetites in pegmatite samples. The oxides appear in wt%. For the total valúe calculation, both Fe2O3 and FeO recalculated were used. B: edge; C: center; M: intermediate point.
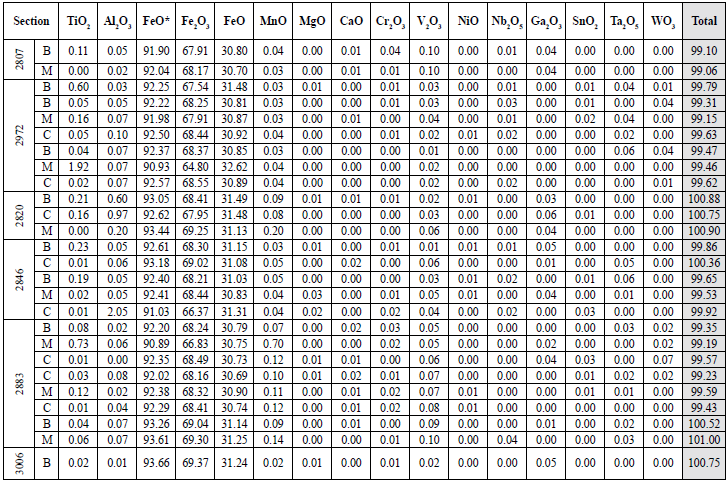
Table 6 Quantitative results of ilmenites in host rock samples. The oxides appear in wt%. For the total value calculation, both Fe2O3 and FeO recalculated were used. B: edge; C: center; M: intermediate point.
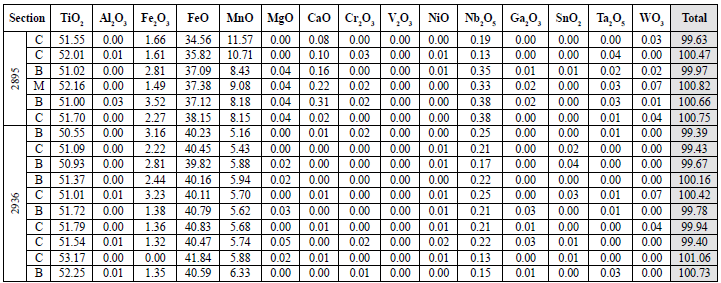
Table 7 Quantitative results of ilmenites in pegmatite samples. The oxides appear in wt%. For the total value calculation, both Fe2O3 and FeO recalculated were used. B: edge; C: center; M: intermediate point.
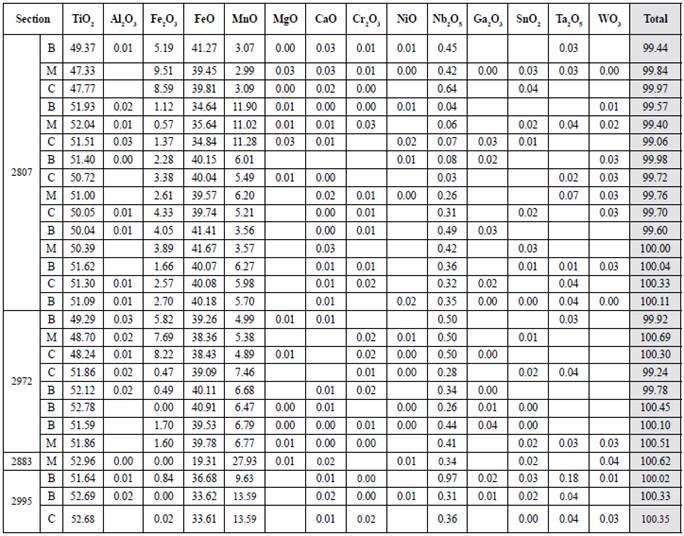
Table 8 Quantitative results of ilmenorutile in a sample of the host rock (2895) and two samples of pegmatites (2846 and 2883). All the FeO content obtained from the microwave was taken for Fe2+ due to the absence of Fe3+ in the ilmenorutile. B: edge; C: center; M: intermediate point.
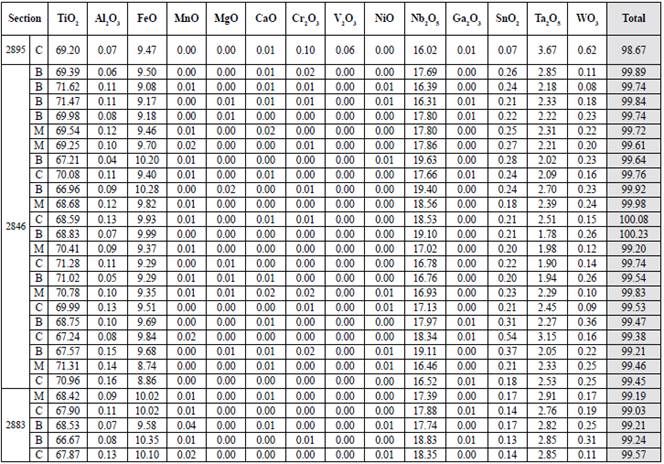
Table 9 Quantitative results of magnetites and ilmenites in a quartz vein sample. The oxides appear in wt%. For the total value calculation, both Fe2O3 and FeO recalculated were used. B: edge; C: center; M: intermediate point.
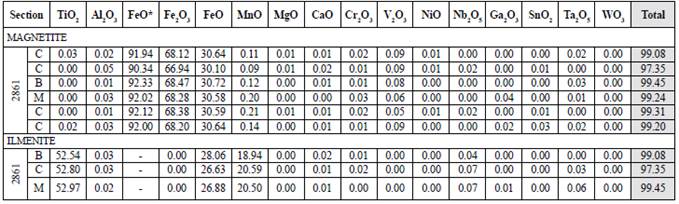
Table 10 Quantitative results of columbite included in ilmenorutile and oxide characterized as samarskite in pegmatite (Bayonne-Valderrama, 2018).

With the compositional maps, no zoning of the oxides was identified (figure 6). Therefore, the average of the edge, center and intermedíate point per crystal was measured to calcúlate the petrological parameters. As the trace elements concentration on the three oxides is not relevant, they are unrepresented in the stoichiometric formula (table 2). The oxidation of magnetite can be observed only optically; it was not identified on the compositional maps. It happens for the martitization process, whose reaction does not involve the mobilization of cations (Nadoll et al., 2014). In ilmenite, both in petrography and in the compositional maps of iron, titanium, and manganese, the exsolution can be observed because iron cations are mobilized to produce hematite as titanium are mobilized for rutile.
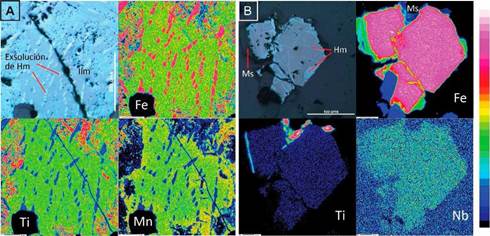
Figure 6 A. Compositional maps of ilmenite with hematite exsolutions. B. Compositional maps of magnetite with hematite oxidation to the edges and exfoliation planes. It was found in paragenesis with muscovite. The color scale is qualitative: blue and dark colors denote a low proportion, while the pinkest and white colors represent a high proportion ofthe element. Ilm: ilmenite; Ms: muscovite; Hm: hematite; Fe: iron; Ti: titanium; Mn: manganese; Nb: niobium.
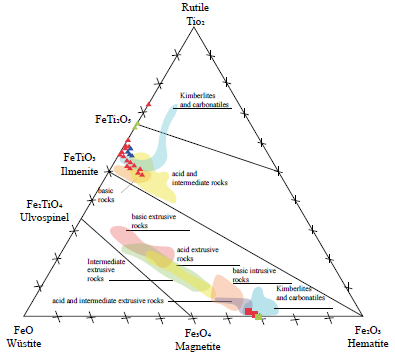
Figure 7 Ternary diagram of the wüstite-rutile-hematite system for iron and titanium oxides. In red, the host rocks; blue, the pegmatites, and green, the quartz veins (Lanza & Meloni, 2006).
The major elements analysis in the wüstite-rutile-hematite ternary system shows that magnetite has an invariable and almost puré composition, with a more elevated ferric ion concentration than ferrous ion. At the same time, ilmenite contains the most notable variation in titanium and ferric ion content. Although the ternary diagram of Lanza and Meloni (2006) shows the ilmenorutile forming an isomorphic series with the pseudobrookite, the data for this mineral was not plotted because the content of niobium and tantalum must be measured.
6.3 Petrology
Bacon and Hirschmann (1988) explained that the Mg/Mn ratio behavior allows identifying whether the magnetite-ilmenite series is in balance or not. The balance is in the ±2o range; out of this range, fugacity and temperature valúes will not be accurate. They also explained that this ratio behavior is best applied for volcanic rocks and crystals without alteration or secondary processes. In this case, studied samples are pegmatites, intrusive rocks with magnetite, reporting martitization process, and ilmenite crystals, tracing rutile and hematite exsolution process. For this reason, the regression valúes obtained are low. In host rocks, those valúes are 0.0054, and in pegmatites are 0.246, indicating that other types of analysis must corrobórate the data obtained from this methodology to establish the equilibrium of the pairs.
After the treatment and filtering of the data, eight magnetite-ilmenite pairs were obtained for the temperature and oxygen fugacity calculation. The authors used the methodology proposed by Spencer and Lindsley (1981) and Andersen and Lindsley (1985). The formation temperature of the samples of host rock and pegmatitic dykes is 358 at 414 °C and 402 at 499 °C, respectively, with abnormal values for pegmatites of 572, 580, and 277 °C. These obtained temperature data are not reasonably coherent since a decrease in temperature should be expected from the granitic host rock evolution to the pegmatites later phase, which is possibly due to the log (Mn/Mg) test result; these results mean the magnetite-ilmenite pairs were not in equilibrium. Entrapment minimum temperatures for inclusions rich in CO2 were obtained between 270-450°C and 175-375°C for those inclusions rich in H2O.
The oxygen fugacity values in the host rock range between -28 and -30 using both methods, and in pegmatites between -24 and -33 with anomalous data of -18, -19, and -47 (Figure 8). Most data are located above the FMQ buffer. In this area, the oxygen fugacity and temperature conditions allow stabilization of ferric and ferrous ions in a proportion that facilitates the crystallization of magnetite (Bowles et al., 2011; Frost, 1991a). Below the FMQ buffer, the conditions increase the partition of iron in silicates. In the fO 2 vs. T diagram (figure 8), two anomalous values are also presented: a product of the low correlation (2o) in the Mn/Mg equilibrium test.
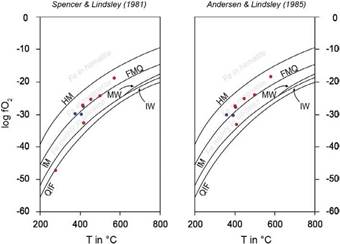
Figure 8 Diagrams offO2 vs. T for the magnetite-ilmenite pairs in granite (blue) and pegmatite samples (red). The results were obtained with ILMAT program based on Spencer and Lindsley (1981) (right) and Andersen and Lindsley (1985) (left). The lines represent the buffer reactions HM, FMQ, MW, IM, IW, and QIF.
According to composition, mineralogy, and geological environment, the pegmatites respond to an anorogenic environment genesis (Mora-Galindo, 2023) from the NYF family because, in the system, niobium is present within the ilmenorutile and the columbite, with thick-sized apatite crystals containing fluoride and yttrium; also, an iron oxide with niobium and rare earth elements as samarskite was characterized (Bayona-Valderrama, 2023).
6.4. Chemistry of Magnetite and Pegmatite Characterization
The trace elements within the magnetite allow distinguishing whether it has an igneous or hydrothermal origin. It also identifies the type of deposit and temperatures in which they were assembled (Nadoll et al., 2014).
Various elements' relationships have been used to discriminate whether magnetite has a magmatic or hydrothermal origin, including the V vs. Ti (Knipping et al., 2015) or Ni/Cr vs. Ti ratio (Dare et al., 2014). However, these relations do not distinguish the signature of the magnetite from the rocks worked but for the V vs. Cr ratio (Figure 9), which is not enough for the discrimination of magnetite origin. The formation of pegmatites implies a high fluid evolution, going from a magmatic phase to a mixed magmatic-hydrothermal stage. The granitic host rocks studied represent the magmatic phase; the pegmatites represent the magmatic-hydrothermal phase, and the quartz veins represent a hydrothermal phase. This evolution can be identified with the V vs. Cr ratio since, as expected, the host rocks have a magmatic origin and the quartz veins have a hydrothermal origin. The pegmatites show a predominantly hydrothermal origin signature, which is valid for a mixed phase.
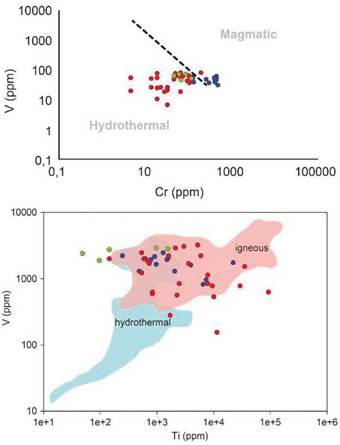
Figure 9 Left: Ratio between V vs. Cr (ppm) for magnetite. The dashed line represents the possible boundary between hydrothermal and igneous magnetite (Aronsson, 2016). Right: Concentration of V vs. Ti (ppm) in magnetite. The red area includes igneous formed magnetite, while blue corresponds to hydrothermal origin (Knipping et al., 2015). In blue the host rock values, in red the pegmatites, and green for the quartz vein.
The Ti+V vs. Al+Mn diagram by Dupuis & Beaudoin (2011) and Nadoll (2011) about deposit type discrimination was also conducted. Most of the data are located within the Ag-Pb-Zn hydrothermal veins field. This area was defined by Nadoll et al. (2014) using 30 magnetite samples extracted from the Lucky Friday mine (figure 10). Despite having a similar Ti+V vs. Al+Mn ratio between magnetites from the studied pegmatites and hydrothermal veins from Lucky Friday, a statistical study is carried out relating the magnetite's trace elements concentration and petrological factors of both environments to determine a possible genetic and petrological correlation and postulate a new field for these pegmatitic anorogenic rocks.
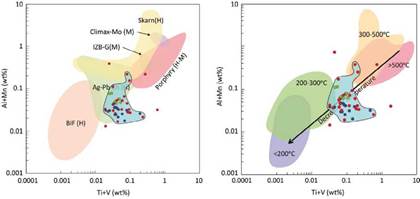
Figure 10 Ti+V vs. Al+Mn (wt%) diagrams proposed by Dupuis and Beaudoin (2011) and Nadoll et al. (2011) for magnetite distinction according to the type of deposit (left) and approximate ranges of temperature formation of magnetite (right). The granitic samples are in blue, pegmatites in red and quartz veins in green.
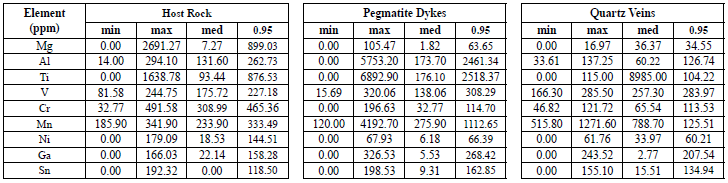
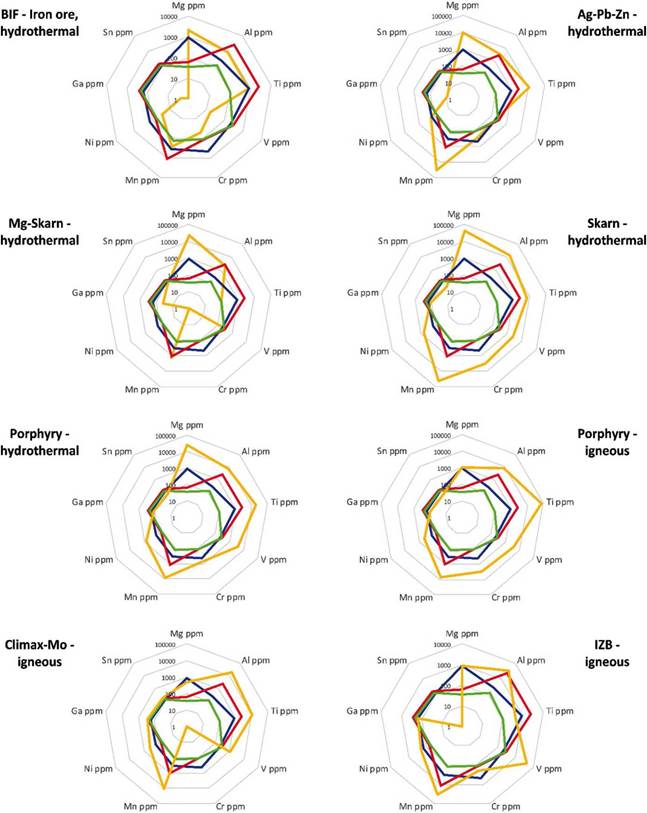
For the statistical analysis, the same treatment worked by Nadoll et al. (2014) was used. It consists of utilizing the 95th percentile of the data (table 11) and drawing it in radial diagrams to be easily compared with the deposits studied in Nadoll et al. (2014) (figure 20). The radial diagram of the Lucky Friday magnetites (Ag-Pb-Zn) presents differences, especially with Mg, Mn, Ga, and Sn.
Table 11 Compilation of the data obtained from the statistical analysis of the trace elements concentration (ppm) in magnetite. Data processed with R2. Their corresponding graphs are found in Figure 12
6.5 Magnetic Susceptibility
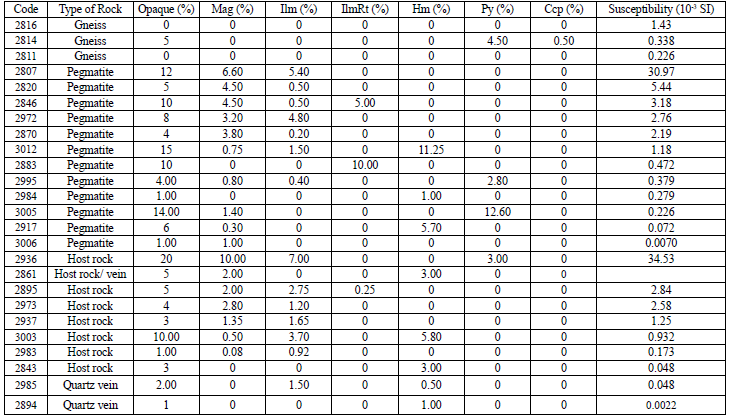
The magnetic susceptibility of the twenty-five samples was measured, including the four types of lithologies found: gneisses, granites, pegmatitic dykes, and quartz veins. It should be considered that the magnetic susceptibility not only depends on the magnetic response of the materials but also on the composition, which is the crystalline structure related to magnetic anisotropy and is also proportional to the size of the crystals (Hunt et al., 1995). For this reason, three measurements were obtained on varied surfaces of the sample to calculate an average with their respective standard deviation.
The average magnetic susceptibility value is 0.665 in gneisses, 6.05 in the granites, 3.93 in pegmatites, and 0.0251 in the quartz veins. For the average and standard deviation calculation, the quartz vein sample VN_1 was not taken into account since it corresponds to a tourmaline contact between monzogranite cut by a quartz vein. Then, the susceptibility of the sample will correspond to the sum of both lithologies. No correlation was observed between the samples and the magnetite abundance in the three lithologies; then, a comparison was considered with the opaque mineral content (Table 12). With this comparison, a 76% correlation between susceptibility and magnetite content was identified. Samples with higher susceptibility tend to contain a high ilmenite content; however, the relationship is not conclusive (Table 12).
Table 12 The relation between opaque mineral abundance with the magnetic susceptibility of all the samples studied.
Despite establishing a numerical correlation, it is not possible to determine interesting areas based on the susceptibility values mapping. Additionally, in the map drawn in this work, the data density is shallow, and the site is extensive for just 25 samples. Nonetheless, suppose that the granitic rocks in the sector have a similar susceptibility behavior to that obtained in this work. In that case, it might be possible that, in a subsequent magnetometric study, the areas with lower values present a higher pegmatite dikes density. Therefore, it could allow the identification of potential attractive areas.
It is recommended that for subsequent exploration or pegmatitic dykes characterization studies, the magnetic susceptibility measurement be performed by following a systematic method, measuring the pegmatitic dike and its immediate host rock, and obtaining a vast number of samples to eliminate this ambiguity and identify more accurate interesting areas.
Discussion
Variations in abundance, degree of alteration, and composition of these oxides studied all together contribute to a better understanding of the fluid evolution and genetic conditions that resulted in the granites and pegmatitic rocks crystallization outcropping around San Jose, Guainia.
The temperatures obtained with the petrological analysis of Fe-Ti oxides are consistent with the microthermometry results in primary fluid inclusions. Cardona (2018) showed that the minimum entrapment temperatures in CO2-enriched primary fluid inclusions are between 260° to 460°C and between 150° to 400°C in water enriched inclusions; a similar range as obtained with the petrology method. Fluctuations on the results employing those two methods might also be explained by the log(Mg/Mn) relationship, which showed signs that the magnetite-ilmenite pairs were not completely in equilibrium, and the results might not be completely accurate. However, it is crucial to consider that according to Bacon & Hirschmann (1988), the method is valid for volcanic rocks and was not conclusive in intrusive rocks.
Although the temperature data were not totally precise or consistent enough, the fO2 values calculated in the ILMAT show a trend where the fO in pegmatites is higher than in host rocks. Additionally, four characteristics allow authors to conclude an increase in oxygen fugacity:
Martitization of magnetite, a reaction that occurs in oxidizing environments.
The increase in fO controls the Mn2+ and Fe2+ concentration in magnetite and ilmenite. This is explained by the ionic radius of the elements and the crystalline spaces. Mn2+ and Fe3+ have fairly similar properties; therefore, the Mn2+ will try to occupy the tetrahedral space within the inverse magnetite structure, but since this space is only occupied by the Fe3+ and trivalent cations, it does not allow the entrance of the Mn2+ ion, causing it to concentrate on ilmenite (Czamanske & Mihálik, 1972). The Mn2+ concentration reported by the microprobe is between 92 and 170 times higher in ilmenite concerning magnetite, corroborating the typical behavior of Mn2+ in a system where fO2 increases (Figure 12A)
In oxidizing conditions, the ilmenite is enriched in Mn2+ concerning Fe2+ as the fluid evolves.
According to the iron compositional map in ilmenite (Figure 6A), elevated concentration is found in hematite exsolutions within ilmenite. The highest values of Mn2+ are in ilmenite instead of the hematite exsolutions. This behavior shows the absent mobility of manganese during the exsolution and complements the preference of Fe with hematite. In addition, the average value of Mn2+ in ilmenites is 7.09 wt% in granites, 7.61 wt% in pegmatites, and 20.01 wt% in quartz veins, indicating an increase of the concentration of Mn2+ as the system evolves from magmatic to hydrothermal, accompanied by the oxygen fugacity increase.
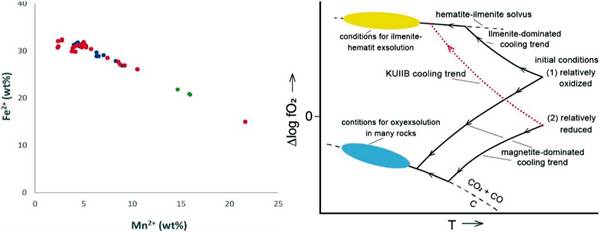
Figure 12: A (Left): Fe2+ vs. Mn2+ (wt%) plot representing the Mn enrichment within the ilmenite, while the content of Fe2+ decreases because of oxidation of the system. Host rocks are represented by blue values, pegmatites in red and quartz veins in green. B (Right): fO vs. temperature diagram that shows the cooling trend of the system with an increase of oxidating conditions according to the petrological results. The path taken by the analyzed samples is shown in red (Frost, 1991).
To determine the evolution and behavior pattern between T and fO2 is essential to consider the following parameters: the initial fO2, the abundance of titanomagnetite and ilmenite before and after the fluid evolves, the composition of the fluid, and the rebalancing reactions that may take place, either oxide-silicate, oxide-oxide or intra-oxide type (Frost, 1991). In an intraoxide rebalancing, the oxyexysolution reaction is found because of oxidizing conditions, consisting of titanomagnetite transformed into ilmenite and magnetite forming a lamellar texture. But neither the microprobe analysis showed a titanomagnetite signature nor the texture was identified during the petrography. In an oxide-oxide rebalancing, the Ti migrates from the titanomagnetite to the ilmenite, but there is no presence of titanomagnetites or more evidence to infer is occurring. Finally, Frost (1991) shows that in an oxide-silicate rebalancing, QUILF and QUILO reactions may occur; however, these occur at high temperatures in basic rocks with olivine or pyroxene; but those are not part of this study. Contrarily, the KUILB reaction occurs thanks to H2O enrichment of the fluid generating an oxidizing tendency during cooling that allows the hematite exsolution within the ilmenite (Frost, 1991).
The KUILB rebalancing reaction is the one that best fits the evidence in the rocks studied due to the presence of hematite exsolutions within ilmenite, the Mn2+ and Fe2+ correlation in ilmenite, the increase in fO2 at the T vs. log fO2 diagram. Also, because pegmatites are a magmatic-hydrothermal phase of a highly evolved, differentiated, and supersaturated volatile fluid, with H2O among them. This evolution of the system is denoted with a red dotted line in Figure 12B.
The magnetite signature does not present unusual concentrations in rare earth elements, and their Al+Mn vs. Ti+V (wt%) ratio is similar to the Ag-Pb-Zn hydrothermal deposit that belongs to the Lucky Friday Mine, located in the Coeur d'Alene, USA, which has been studied and characterized by Nadoll and Mauk (2011). However, the genetic conditions differ from each other. Lucky Friday's hydrothermal present a pressure between 1-3 kPa and a formation temperature from 250 to 350°C, while the pressure in the pegmatitic dykes studied is between 0.426 to 1.206 kbar with a higher temperature (Cardona, 2023).Additionally, the mineralogy differs from both the Lucky Friday Mine and the pegmatites studied. In Lucky Friday, the pyrrhotite, magnetite, and wüstite are presented. The pyrrhotite indicates a reducing environment, and wüstite, being an unstable mineral below 570°C, is metastable thanks to the low fO2 (Nadoll & Mauk, 2011). Conditions that are in opposition to those found in the pegmatites studied. Due to the Lucky Friday mine characteristics, a correlation cannot be established with this work's pegmatites and host rocks.
For this reason, a new field is proposed in the Al+Mn vs. Ti+V (wt%) plot proposed by Dupuis and Beaudoin (2011) and Nadoll et al. (2014) (Figure 10). The authors strongly recommend using this proposal to differentiate the magnetites from this magmatic-hydrothermal environmental for future studies in magnetites formed in the NYF-type pegmatites.
Conclusions
The magnetic petrology technique allows us to obtain accurate oxygen fugacity and temperature values. This information is consistent with the data obtained from primary fluid inclusions microthermometry. Despite implementing a systematic and carefully filtering process of the results obtained by EPMA, some temperature values from pegmatites were higher than granites, an unexpected behavior. It would be related to the low log(Mg/Mn) ratio calculated in magnetite-ilmenite pairs.
The KUILB oxide-silicate rebalancing process is the model that best fits the evidence and results. This rebalancing is accompanied by a fO2 increase as the fluid decreases its temperature, controlling the enrichment of Mn2+ in ilmenite and allowing appropriate conditions for hematite exsolution within ilmenite, features supported in petrography and EPMA data.
A new field is proposed to discriminate the magnetite related to NYF-type pegmatites from anorogenic environment. It happens because the pressure, fO2, and mineralogy between pegmatites and the hydrothermal veins from Lucky Friday are different. In the Lucky Friday veins, pyrrhotite and wüstite metastable are present coexisting with magnetite due to the low fO2 value; meanwhile, in the pegmatites studied for this work, the fO2 rates are high. Ultimately, it is recommended that further studies complement a more appropriate adjustment and definition of the proposed field.
Magnetic susceptibility is proportional to the magnetite content found on the three lithologies studied, but it was not possible to correlate with magnetite's composition. Granitic host rocks present the higher susceptibility values, followed by the pegmatite dykes, quartz veins, and gneisses, which show a susceptibility close to 0. A more systematic method for the fieldwork is recommended, measuring the susceptibility values of the pegmatite dyke or quartz veins and its immediate host rock, for being able to identify a possible correlation or trend.

