


Services on Demand
Journal
Article
 English (pdf)
 Article in xml format
 Article references
 Send this article by e-mail
Indicators
-
 Cited by SciELO
 -
 Access statistics
Related links
-
 Cited by Google
 -
 Similars in
SciELO
Similars in
SciELO -
 Similars in Google
Share

 Permalink
Ingeniería y Ciencia
Print version ISSN 1794-9165
ing.cienc. vol.8 no.16 Medellín July/Dec. 2012
ARTÍCULO ORIGINAL Time-Frequency Energy Features for Articulator Position Inference on Stop Consonants Características de tiempo-frecuencia para la estimación de la posición de los órganos articuladores en consonantes explosivas Alexander Sepulveda-Sepulveda1 y German Castellanos-Domínguez2 1 Magíster en Automatización, PhD(c) en Ingeniería-Automática, Universidad Nacional, Manizales, Colombia, alexander.sepulveda.sepulveda@gmail.com. 2 PhD en Telecomunicaciones, gcastell9@gmail.com, profesor, Universidad Nacional, Manizales, Colombia Received:25-may-2012, Acepted: 28-oct-2012 Available online: 30-nov-2012 MSC: 68T10 / PACS: 87.85Ng
Abstract
Acoustic-to-Articulatory inversion offers new perspectives and interesting applications in the speech processing field; however, it remains an open issue. This paper presents a method to estimate the distribution of the articulatory information contained in the stop consonants' acoustics, whose parametrization is achieved by using the wavelet packet transform. The main focus is on measuring the relevant acoustic information, in terms of statistical association, for the inference of the position of critical articulators involved in stop consonants production. The rank correlation Kendall coefficient is used as the relevance measure. The maps of relevant time–frequency features are calculated for the MOCHA–TIMIT database; from which, stop consonants are extracted and analysed. The proposed method obtains a set of time–frequency components closely related to articulatory phenemenon, which offers a deeper understanding into the relationship between the articulatory and acoustical phenomena. The relevant maps are tested into an acoustic–to–articulatory mapping system based on Gaussian mixture models, where it is shown they are suitable for improving the performance of such a systems over stop consonants. The method could be extended to other manner of articulation categories, e.g. fricatives, in order to adapt present method to acoustic-to-articulatory mapping systems over whole speech.
Key words: acoustic-to-Articulatory inversion, Gaussian mixture models, articulatory phonetics, time-frequency features.
Resumen
La inversión articulatoria ofrece nuevas perspectivas y aplicaciones interesantes en el campo de la voz; sin embargo, es aún un problema por resolver. El presente trabajo ofrece un método para la estimación de la distribución de la información articulatoria contenida en la acústica de consonantes explosivas, cuya parametrización se realiza mediante la transformada wavelet packet. El trabajo se centra principalmente en estimar la información acústica relevante, en términos de asociación estadística, para la inferencia de la posición de los órganos articuladores críticos involucrados en la producción de consonantes explosivas. Se usa el coeficiente de Kendall a modo de medida de relevancia. Los mapas de relevancia de tiempo-frecuencia se calculan para la base de datos MOCHA–TIMIT; de la cual, las zonas correspondientes a las consonantes explosivas son analizados. El método propuesto entrega un conjunto de componentes de tiempo-frecuencia intimamente relacionados al fenómeno articulatorio, lo cual ofrece un entendimiento más profundo de la relación existente entre los fenómenos articulatorio y acústico. Los mapas de relevancia se prueban en un sistema de inversión articulatoria basado en modelos de mezclas gausianas, donde se muestra que mejoran el desempeño de los mencionados sistemas aplicados sobre consonantes explosivas. El método se puede extender a otras categorías articulatorias, p.e. fricativas, con el fin de adaptar el presente método a sistemas de inversión articulatoria sobre voz continua
Palabras claves: inversión articulatoria, modelos de mezclas Gaussianas, fonética articulatoria, características de tiempo-frecuencia.
1 Introduction
Articulators position inference, from the acoustic information contained in the speech signal, offers new perspectives and interesting applications in the speech processing field. An adequate system for recovering the articulatory configurations, from the acoustic speech signal, might be used in several applications: visual aids in articulatory training tasks for hearing or speech impaired people; computer guided second language learning programs to show correct and incorrect pronunciation [1]; low-bit rate coding since articulators move relatively slowly [2]; and complementing representation in speech recognition systems to improve their performance since articulatory parameters represent co-articulatory related phenomena in a better way [3].
Speech gestures are planned movements in a coordinated sequence, whose actions are relatively slow and overlapping. This circumstances causes the human speech articulators (jaw, tongue, lips, etc.) to have limited freedom of movement and to be interrelated and ruled by inertia. As a consequence, in the production of a specified sequence of phonemes, articulators spread their influence outside the phoneme range so that substitution of one phoneme by another alters the neighboring segments [4]. That is, the information about a phoneme is not localized just on a single phoneme's region, but is spread over a substantial segment of the speech signal. Recent experiments support this affirmation, specially in [5],[6], the use of the mutual information applied to estimation of the distribution of the phonetic information in frequency as well as in time is discussed. On the other hand, the distribution of the articulatory information on the acoustic speech signal is also important; however, its estimation remains unresolved issue. The question of how the articulatory information, which come from Electro-Magnetic Articulograph (EMA) systems in present work, is coded in the speech signal remains of practical and theoretical relevance. In particular, the knowledge of the distribution of the articulatory influence on the acoustic speech signal is useful in those applications involving articulatory inversion tasks, whose main goal is to infer the articulators position based on the information immersed in the acoustic speech signal [7],[8].
It is shown in [9] that certain articulators play more significant role to the production of a given phone than others. These articulators are called critical articulators. When one articulator constricts for a phoneme, the others are relatively free to coarticulate (if they do not cause an additional constriction). This work deals with the critical articulators position inference of stop consonants, which are produced by blocking the oral cavity at some point. The constriction can be formed by the lips, in case of bilabials /p, b/, the tongue tip for alveolars /t; d/; and tongue dorsum when producing velars /k; g/. Thus, these are the critical articulators for those sets of phonemes.
This study aims to estimate the influence zones of the critical articulators movement, in case of stop consonants, of speakers over time and frequency domains of speech signals. For this purpose, statistical dependence between the articulatory and the acoustic variables is measured by using the Kendall τ coefficient, which is a measure implemented by robust and simple algorithms. Because non–critical articulators are free to move, the statistical association measure could be affected by the intrinsic movements of these articulators. Furthermore, non-critical articulators may not been influencing in a consistent way the acoustics of the speech signal. As a result, the maps of most relevant zones in time and in frequency for critical articulators movement estimation of the stops in MOCHA-TIMIT speakers database are achieved. The benefit of the achieved relevant zone maps is tested in an acoustic-to-articulatory regression system based on Gaussian mixture models (GMMs). It must be noted that the acoustic speech signal is represented using the wavelet packet transform (WPT) that allows a flexible choice of time–frequency bands and can be efficiently implemented, as shown in [10],[11].
2 Method
2.1 Acoustic representation based on wavelet packet transform
It must be highlighted that the acoustic features can be represented by using different known time–frequency approaches. Nonetheless, the main motivation for using wavelet packets is that they can be efficiently implemented with relatively low computational cost [11]. In addition, they offer an alternative for detecting sudden bursts in slowly varying signals [12], which is a phenomenon observed in stop consonants. Through this study, the acoustic speech signal is parameterized using the wavelet packet transform [13], whereas the articulatory information is represented by trajectories extracted from an EMA system that measures the movement of specific points of speech articulators, where each channel becomes a single articulatory dimension.
The wavelet packet transform is a generalization of the discrete wavelet transform that is iteratively estimated by means of the filter–bank–based procedure, as follows [14]:
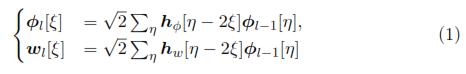
where Φl and wl are the coefficients of approximation and detail at a decomposition level l; respectively. ξ and η are integers. Furthermore, hw and hΦ are related to filtering coefficients associated to detail and approximation components, respectively.
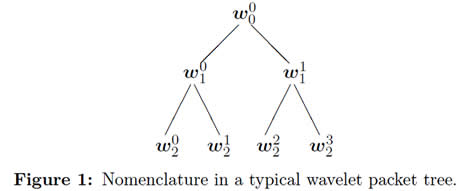
Calculation of Eq. (1) is carried out over the coarse coefficients Φl[ξ] and detail coefficients wl[ξ], in such way that a binary tree is obtained like the one depicted in figure 1. Each node of a binary tree is labeled by its depth l; and by the number p of nodes that are on its left side at the depth l. The coefficients of the wavelet packet tree for each node (l, p) are estimated with the following expressions:
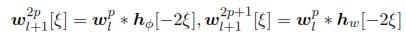
where the notation * stands for the convolution operator.
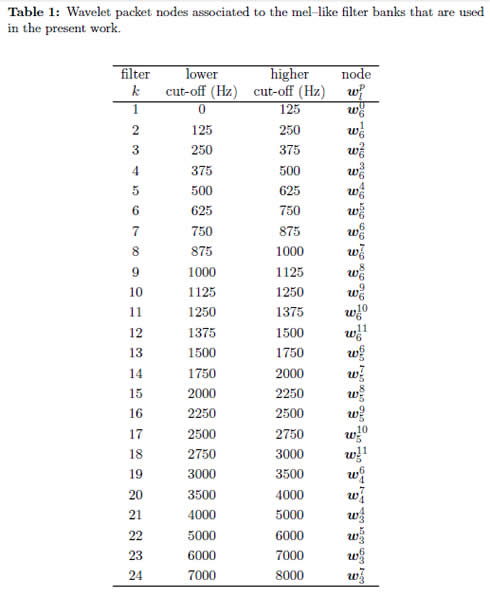
In this study, frequency splitting of the time-frequency plane is generated with the WPT having frequency bands spacing similar to the Mel scale, as proposed in [15]. In the first place, a full three level WPT decomposition is performed, which splits the frequency components within the range [0, 8] kHz into eight bands; where each is of 1 kHz bandwidth approximately. Then, energy localized in the bands [4, 5] kHz, [5, 6] kHz, [6, 7] kHz, and [7, 8] kHz produce the coefficients 21st, 22nd, 23rd, and 24th, respectively. The band within [3, 4] kHz is decomposed once to achieve a couple of bands, ([3, 3,5] kHz and [3,5, 4] kHz), that generate the 19th and 20th filter banks. Next, the [2, 3] kHz band is selected and split out into 4 bands of 250 Hz bandwidth each. The frequency band of 1−2 kHz is further decomposed applying two level WPT decomposition, thus resulting in four 250 Hz subbands. The frequency bands of [1, 1,25] kHz and [1,25, 1,5] kHz are once more further decomposed, thus increasing the number of bands to six in the [1, 2] kHz range. Finally, the lowest band of [0, 1] kHz is decomposed by applying a full three level WPT decomposition, and therefore, dividing the [0, 1] kHz band into eight subbands (1st to 8th filter banks), where each one is 125 Hz bandwidth, approximately. Likewise, to accomplish the time plane partition, the acoustic speech signal is parameterized using 20 ms frames and Δt = 10 ms steps, so a rate frame of 100 Hz is performed [16]. Acoustic information within time interval ranging from t − ta = t − 200 ms to t + tb = t + 300 ms is parameterized.
As a result, the time–frequency information is represented by the scalar valued logarithmic energy features x(t + d, fk) ∈  , where the set {fk : k = 1, ... , nf} appraises the nf = 24 frequency components, where d ∈ [ta, tb] is the time–shift variable. A resulting acoustic matrix of log–energy features Xt ∈ nt×nf (with nt = (tb − ta)/10 ms) is attained for each window analysis at the time position t of the articulatory configuration yt = {ym(t) : m = 1, ... , nc} ∈ nc×1, where m denotes the m–th channel and nc = 14 is the number of EMA channels. So, column vector xt+d = {x(t + d, fk)} ∈ nf×1, of time-frequency matrix Xt comprises the set of nf energy features estimated as follows [15]:
– Computation of WPT of the speech frame at time t + d; by using Daubechies compactly supported wavelets with six vanishing moments, as in [15].
– Calculation of the energy of each frequency band that results from the sum of square values of the coefficients contained in the WPT–related nodes(Table 1 shows the
2.2 Kendall coefficient
Given a bivariate distribution model of x(t + d, fk) and ym(t) random variables, the Kendall coefficient, noted τ; is also used as a measure of random association, which is defined in terms of probability P as follows [17]:
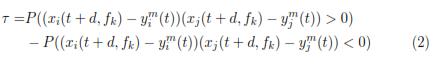
Both terms of τ ∈ [−1; 1] in (2) are estimated from the given set of independent observations pairs (xi(t+d, fk);  (t)), (xj(t+d, fk);
  (t)), which are selected among N samples forming the set used to estimate the statistical relation between articulators position and acoustics. So, the measure τ becomes 1 if there is a perfect concordance, i.e., if the direct relationship holds, xi(t + d, fk)
  xj(t + d, fk) whenever (t) (t). On the contrary, the measure of perfect discordance yields −1 meaning that the inverse relationship holds: xi(t + d, fk) xj(t + d, fk) whenever (t) (t). If neither concordant criterion nor discordant criterion is true, the measure between pairs will lie within the interval (−1; 1):
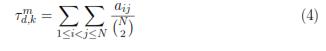
Given the specific set of pairs (xi(t+d,fk); (t)), (xj(t+d,fk), (t)), the respective indicator of association measure aij ∈ [−1, 1] is defined in equation (3) as:

where sgn(·) stands for the signum function. Then, the value of  = ε{aij} denoting the Kendall coefficient at the time shift d, given the filter bank number k and the EMA channel m, is provided by following expected value:
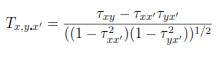
The Kendall association measure between the articulatory and the acoustic data roughly shows how articulatory information is coded in the time and frequency components of the speech signal. However, the vocal tract shape inference is not commonly carried out using a single feature. An additional question to be addressed is how the articulatory information is distributed if using more than one input. To clarify this issue the partial rank correlation can be used. So, given a trivariate population where the marginal distributions of each variable are continuous, it is necessary to determine a measure of the association between x(t + d, fk) and ym(t) when term x' = x(t + d', fm); remains constant, with fm ≠ fk; and d ≠ d': That is, there is the need for computing the additional information provided by a new feature x(t + d,fk) for the inference of ym(t); given the feature x':
Based on the estimated τ values between those pairs of variables involved in the partial correlation calculation, the partial rank correlation coefficient Tx,y.x' ; in case of Kendall measure, can be calculated as follows [17]:
2.3 Regression by using Gaussian mixture models
The task at hand consists on searching the estimation eyt of the articulatory configuration yt from the acoustic vector vt ∈ p×1; comprising p selected time-frequency features at the time moment t; i.e,  = ε{y|v = vt}. We assume y; v are jointly distributed. In GMM based regression system it is used the fact that when partitioning the multivariate Gaussian joint density into P(v, y) = P(y|v)P(v); both P(v,y) (conditional probability density function) and P(v), they are also multivariate Gaussian. Conditional probability can be represented as
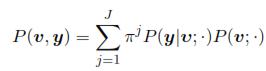
where P(y|v;·) can be represented by
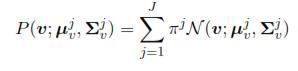
The resulting conditional probability can also be expressed as a Gaussian mixture model, as follows:
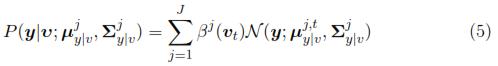
where the parameter 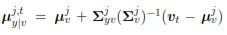 in equation (5) is the conditional mean whereas
 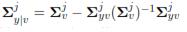 is the conditional covariance. βj(vt) is computed by using the following expression:
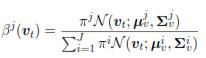
Lastly, estimation , expressed by expectation over P(y|υ); yields:
3 Results
3.1 Dataset
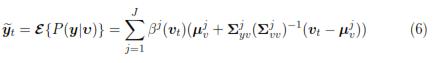
The present study uses the MOCHA-TIMIT database holding a collection of sentences that are designed to provide a set of phonetically diverse utterances [18]. The MOCHA-TIMIT database includes the acoustic waveform (16 kHz sample rate) as well as EMA data. Movements of receiver coils attached to the articulators are sampled by the EMA system at 500 Hz. Coils are affixed to the lower incisors (li), upper lip (ul), lower lip(ll), tongue tip (tt), tongue body (tb), tongue dorsum (td), and velum (v). The two coils at the bridge of the nose and upper incisors provide reference points to correct errors produced by head movements. Label files of MOCHA-TIMIT database are used to discard silent segments at the beginning and the end of the utterances [16]. MOCHATIMIT database includes the acoustic–articulatory data of two speakers. One is female (fsew0), and the other is male (msak0). The EMA trajectories are resampled from 500 Hz to 100 Hz after a low–pass filtering process. Examples of measured EMA signals are shown in figure 2.
A data standardization process as the suggested in [19] is developed. The conventional process of standardization calculates the average values as well as global standard deviations and then they are applied to the EMA trajectories, but this may cause difficulties due to the change on average values from one phrase to another in the recording process. While the rapid changes of the average values are given for the phonetic content in each phrase, the slow changes are mainly caused by the articulatory adaptation of the subject during the recording session. It is useful to eliminate the second type of variation while keeping the other one. This is carried out by subtracting one version of the average values obtained when moving the vector of average values, whose dimension is 460, through a low-pass filter. The value is fixed heuristically such that 15% of bandwidth is low-pass filtered.
The phones for which a given articulator is critical are segmented by using the corresponding MOCHA database labels, which were corrected in [4]. In order to establish correspondence between articulators and phonemes for which the given articulator is critical, descriptors based on the international phonetic alphabet are utilized. They are described as follows: lly : /p, b/; tty : /t, d/; and, tdy: /k, g/.
3.2 Relevant maps over stops
For estimating the maps of relevant features, the statistical measure of association is applied to the time–frequency atoms enclosed in the context window [t−ta,t+tb], where ta = 200 ms and tb = 300 ms. A total of 50 frames taken every 10 ms in time are parameterized using the 24 wavelet packet filter banks, as described in section §2.1. The process generated 1200 statistical association outcomes for each time t, whose magnitude is used to construct the maps of relevant features.
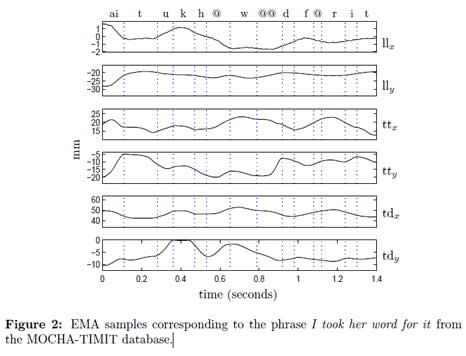
For the construction of relevant maps corresponding to lly, tty and tdy 2000 pairs {Xt, yn(t)} of EMA–acoustic points are taken, for speaker fsew0 as well as msak0. The Kendall τ coefficient, equation (4), between each variable x(t + d, fk) and articulatory trajectories of the channels corresponding to lly, tty and tdy is estimated. The resulting points are used to construct the Kendall relevant maps. This procedure is performed for the female as well as for the male speakers in the MOCHA database. The maps are shown in figure 3. The zones of higher relevance are denoted by the brighter zones while the features that have relevance values less than 0,03 are black colored. As seen in all the graphs, in case of plosive phonemes the peak of maximal information is located after the current time of analysis t = 0.
3.3 Acoustic-to-articulatory mapping using GMMs and relevant time-frequency features
In order to show the usefulness of relevant maps, acoustic-to-articulatory mapping by using Gaussian mixture models is performed using conventional method, like in [20], as well as using relevant features provided by relevant maps. In case of conventional method, the number of inputs is varied ranging from p = 24 to p = 168 (p = 24, 72, 120 and 168); that is, 1, 3, 5 and 7 frames around current time of analysis are taken into account. The input vector is transformed using Principal Component Analysis, where np = 24, 35, 35, 50 components are taken, respectively. In the case of relevant maps, the p = 24, 72, 120 and 168 most relevant atoms are used. Then, the np = 24, 35, 35, 50 principal components are extracted to form the input vector for the model in (6). In all cases 32 mixtures are used. The model parameters are found by using the expectation maximization (EM) algorithm [21].
For each of the 5 partitions (consisting of 92 sentences) the phones corresponding to plosive phonemes are extracted and used to evaluate the relevant features obtained in section (3.2). One of the sets is reserved for testing by turns, while the other 4 sets are used for training. For the sake of avoiding any possible problem caused by reduced number of samples available for training and testing processes, we choose diagonal co-variance matrix. The results, in terms of average RMSE (root mean square error) and average correlation between both speakers, are shown in figure (4). It can be observed that the use of Kendall relevant maps improves the performance of the GMM based acoustic–to–articulatory regression systems for most of the selected quantity of atoms. In addition, we measure the average percentage of improvement along speakers for each of the selected number of atoms; and, these values are used to obtain the average improvement per articulatory channel shown in Table (2).
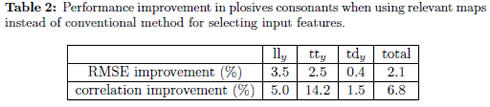
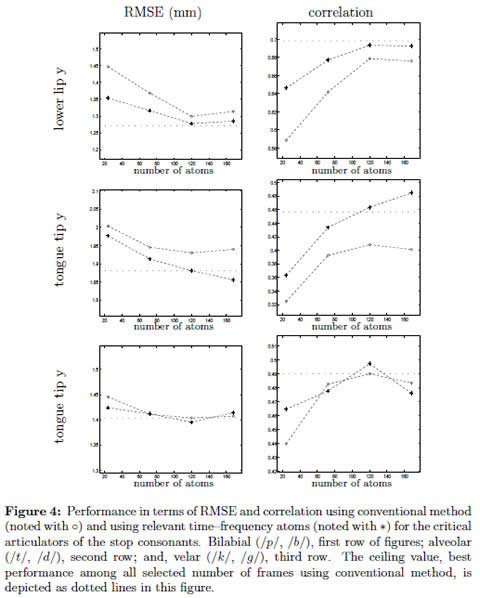
In case of conventional method, additional number of atoms (216, 312 and 408 atoms; 9, 13 and 17 frames) are used as inputs; and, the best performance among all selected number of frames, from 1 to 17, is taken. The value, termed ceiling, is depicted as dotted lines in figure (4). Some observations can be made : a) for lly, almost same performance is obtained using 120 relevant inputs compared to 408 inputs required by conventional method, that is a reduction of 70,6 %; b) regarding tty, taking 168 relevant time-frequency atoms the results are clearly better than the performance of conventional method, which requires 408 input features; and, c) in case of tdy, when using 120 relevant features the performance improvement is 0,6% in RMSE value and 1,46% in correlation value compared to the best performance obtained by using conventional method, which also needed 120 features.
4 Discussion
Regarding maps of relevant time-frequency features, some observations can be appreciated:
The burst spectrum of stops can be used as a cue to place [22]. In previous works it has been found that labials tend to have diffusely falling or flat spectra, alveolars have diffusely rising patterns, and velars exhibit higher concentration of energy in the intermediate frequency and relatively low–frequency regions. We found some similarities between previous works on acoustics phonetics [22] and achieved time–frequency relevant maps, namely: a) in case of bilabials, for female speaker relevant components are flatly distributed along a considerable part of the spectrum, and for the male speaker this pattern is falling; b) for alveolar stop phones, the relevant atoms are almost concentrated on high–frequency components, for female as well as male speakers; and c) for velar stops, the relevant components of fsew0 are compactly distributed around relatively low–frequency components.
From the estimated relevance maps, see figure (3), it can be observed that the zones of maximal association values are located after the current time of analysis, i.e., following the temporal position of the articulatory information, for the articulators analyzed in present work. The relationship between the position of maximal relevance zones and the articulator configuration is fairly complex, and its explanation is out of the scope of this paper.
The zones of maximal information tends to be located on lower ranges of frequency for male speaker in respect female speaker, but preserving the similarities in shape, see figure (3.
Additionally, there are some similarities between the maps belonging to female and male speakers; particularly, regarding the position of most relevant time-frequency features. The difference is given by the position in respect to frequency of female speaker, which is greater than in case of male speaker. If a vocal tract normalization process is performed, like the one described in HTK tutorial, the frequency spectrum of female speaker would be contracted and the frequency spectrum of male speaker would be expanded.
Regarding inversion performance, it is observed in [20] that the performance improves as the number of input features increases, where the best performance is achieved when using 256 input features. Moreover, if assuming diagonal matrix for the model covariance in case of stops, the best performance is obtained when using 408 features for modeling lly and tty. By contrast, using the proposed relevant features, the same performance is almost reached in case of lly, while for tty, the performance is overpassed; but with the benefit that in both cases (see figure (4)), instead of using 408 features only 120 relevant time-frequency atoms are necessary.
5 Conclusion
The proposed method, which obtains a set of relevant time–frequency components closely related to the articulatory positions when producing stops, is shown to be suitable for improving the performance of acoustic–to–articulatory mapping systems, particularly those based on Gaussian mixture models. Moreover, the relevant maps provide a more deeper understanding into the relationship between the articulatory and acoustical phenomena on stop phones.
The authors suggest applying this proposed method to an articulatory database with a greater number of speakers in order to go beyond in the understanding of the relationship between the articulators movement and the acoustic speech signal. In addition, the similarities found between the maps belonging to female and male speaker suggests that there exist invariant patterns, which can be used to develop a speaker-independent articulatory inversion system. Finally, further tests should be performed in order to adapt present method to acoustic-to-articulatory mapping systems over whole speech to later on compare it with other state-of-the-art methods.
Acknowledgement
This work has been partially funded by Universidad Nacional through the program convocatoria nacional apoyo para el fortalecimiento de grupos de investigación o creación artística que soporten programas de posgrado de la Universidad Nacional de Colombia–2012–modalidad única. It has been also supported by COLCIENCIAS by means of the program apoyo a la comunidad científica nacional a través de los programas de doctorado nacionales - 2006.
Referencias
1. P. Badin, Y. Tarabalka, F. Elisei, G. Bailly, ''Can you 'read' tongue movements? Evaluation of the contribution of tongue display to speech understanding'', Speech Communication, vol. 52, n.o 6, pp. 493-503, jun. 2010. [ Links ] Referenced in 39
2. J. Schroeter, M. Sondhi, ''Speech coding based on physiological models of speech production,'' in Advances in Speech Signal Processing, S. Furui and M. M. Sondhi, Eds. NewYork: Marcel Dekker Inc, 1992, ch. 8. [ Links ] Referenced in 39
3. S. King, J. Frankel, K. Livescu, E. McDermott, K. Richmond, M. Wester, ''Speech production knowledge in automatic speech recognition'', The Journal of the Acoustical Society of America, vol. 121, n.o 2, pp. 723-742, 2007. [ Links ] Referenced in 39
4. P. Jackson, V. Singampalli, ''Statistical identification of articulation constraints in the production of speech'', Speech Communication, vol. 51, n.o 8, pp. 695-710, ago. 2009. [ Links ] Referenciado en 39, 47
5. H. H. Yang, S. V. Vuuren, S. Sharma, H. Hermansky, ''Relevance of time-frequency features for phonetic and speaker-channel classification'', Speech Communication, vol. 31, n.o 1, pp. 35-50, may 2000. [ Links ] Referenced in 39
6. Mark Hasegawa-Johnson. Time-frequency distribution of partial phonetic information measured using mutual information. Beijing, 2000. [Online] Available: http://www.isle.illinois.edu/sst/pubs/2000/hasegawa-johnson00interspeech.pdf, In InterSpeech, pp. 133-136. [ Links ] Referenced in 39
7. J. Schroeter, M. Sondhi, ''Techniques for estimating vocal-tract shapes from the speech signal'', IEEE Trans. on Speech and Audio Processing, vol. 2, pp. 133-150, 1994. [ Links ] Referenced in 39
8. V. Sorokin, A. Leonov, A. Trushkin, ''Estimation of stability and accuracy of inverse problem solution for the vocal tract'', Speech Communication, vol. 30, n.o 1, pp. 55-74, 2000. [ Links ] Referenced in 39
9. G. Papcun, et. al., ''Inferring articulation and recognizing gestures from acoustics with a neural network trained on x-ray microbeam data'', J. Acoust. Soc. Am., vol. 92 n.o 2, pp. 688-700, 1992. [ Links ] Referenced in 39
10. Gh. Choueiter, J. Glass, ''An Implementation of Rational Wavelets and Filter Design for Phonetic Classi cation'', IEEE Transactions on Audio, Speech, and Language Processing, vol. 15 n.o 3, pp. 939-948, 2007. [ Links ] Referenced in 40
11. J. Silva, Shrikanth Narayanan, ''Discriminative Wavelet Packet Filter Bank Selection for Pattern Recognition'', IEEE Transactions on Signal Processing, vol. 57, n.o 5, pp. 1796-1810 ,2009. [ Links ] Referenced in 40
12. P. Addison, The Illustrated Wavelet Transform Handbook, 1st ed. Taylor & Francis, 2002. [ Links ] Referenced in 40
13. S. Mallat, A Wavelet Tour of Signal Processing, Third Edition: The Sparse Way, Academic Press, 1998. [ Links ] Referenced in 40
14. A. Akansu, P. Haddad, Multiresolution Signal Decomposition, Second Edition: Transforms, Subbands, and Wavelets, 2.a ed. Academic Press, 2000. [ Links ] Referenced in 41
15. O. Farooq, S. Datta, ''Mel filter-like admissible wavelet packet structure for speech recognition'', Signal Processing Letters, IEEE, vol. 8, n.o 7, pp. 196 -198, jul. 2001. [ Links ] Referenced in 41, 42
16. K. Richmond, S. King, P. Taylor, ''Modelling the uncertainty in recovering articulation from acoustics'', Computer Speech & Language, vol. 17, n.o 2-3, pp. 153-172, abr. 2003. [ Links ] Referenced in 42, 46
17. J. Gibbons, S. Chakraborti, G. Gibbons, Nonparametric Statistical Inference, Marcel Dekker Inc., 2003. [ Links ] Referenced in 44, 45
18. Alan Wrench. ''MOCHA-TIMIT'', The Centre for Speech TechnologyResearch. [Online]. Available: http://www.cstr.ed.ac.uk/research/projects/artic/mocha.html. [ Links ] Referenced in 46
19. Korin Richmond, Articulatory feature recognition from the acoustic speech signal. PhD. thesis, University of Edinburgh. [Online]. Available: http://www.cstr.ed.ac.uk/publications/users/korin.html. [ Links ] Referenced in 47
20. Tomoki Toda, Alan Black, Keiichi Tokuda, ''Statistical Mapping between Articulatory Movements and Acoustic Spectrum using Gaussian Mixture Models'', Speech Communication, vol. 50 n.o3, pp. 215-227, 2008. [ Links ] Referenced in 50, 53
21. C. Bishop, Pattern Recognition and Machine Learning, 1st ed. 2006. Corr. 2nd printing. Springer, 2007. [ Links ] Referenced in 50
22. R. Kent, Charles Read, Acoustic Analysis of Speech, Thomson Learning, 2002. [ Links ] Referenced in 52
