


 Inglés (pdf)
 Articulo en XML
 Referencias del artículo
 Enviar articulo por email
 Citado por SciELO
  Citado por Google
  Similares en
SciELO
Similares en
SciELO  Similares en Google
 Permalink
1 introduction
The Proton Exchange Membranes (PEMs) are the most promising for Fuel Cells (FC) technologies to generate clean energy 1),(2),(3),(4. Perfluoronated Nafion® is the most used membrane for FC applications 5),(6, due to excellent chemical stability and a marked effect on the proton conductivity. A more economical alternative for preparing PEM was proposed in 1 989 7 which is a combination of poly(vinyl alcohol) (PVA) and hipophosphorous acid. This new combination allowed the production of non-perfluoronated membranes of low cost and good procesability, encouraging manufacturing different types of PEMs, which have been synthetized using mixtures of polymers with various salts and acids 8. Other groups have investigated various combinations using PVA as polymeric matrix 8),(9),(10),(11),(12. On the other hand, composites have been synthetized based on polymeric membranes combined with micro or nanoparticles for the purpose of controlling the physical and chemical properties, being in some cases that this approach has improved proton conductivity and mechanical properties for some dispersant concentrations 13),(14),(15),(16. In this work the polymer membrane (H3PO2/PVA) with constant molar ratio P/OH = 0.3, doped with TiO2 nanoparticles have been synthetized and studied its effect on the thermal and electrical properties.
2 Experimental methods
The precursors materials were hypophosphorous acid (H3PO2), PVA, and titanium oxide (TiO2) with particle size smaller than 50 nm (Sigma Aldrich Chemicals). PVA was poured in distilled water at 90 ºC using a magnetic stirrer plate to completely dissolve the polymer. After turning off the stirrer, constant amounts of acid were added to the solution, according to the molar ratio P/OH = 0.3. Then, constant amounts of TiO2 nanoparticles were added to the solution, maintaining the mixture under agitation until it became homogeneous. After additional two hours under agitation the mixture, now at room temperature, was poured into glass vessels under dry atmosphere (desiccator with sulphuric acid) by several days to obtain membranes. The resulting membranes were uniform, smooth, homogeneous with a constant white color on the whole surface due to the presence of highly dispersed TiO2 nanoparticles, and having a thickness of 0.2 mm.
The thermal characterization was carried out by using a TA Instrument DSC Q100 calorimeter at a thermal scan of 10 ºC /min under a nitrogen atmosphere in a temperature range between 75 ºC and 250 ºC. Thermogravimetric characterization (TG) was carried out with a TA instruments 2050 TGA microbalance at a temperature rate of 10 ºC /min under a nitrogen atmosphere from ambient temperature to 180 ºC.
The electrical characterizations of the samples were performed by impedance spectroscopy (IS) using an Agilent 4294A impedance analyzer in a frequency range 40 Hz to 6 MHz, with a voltage signal of 500 mV peakto-peak. The measurements were done at isotherms separated by 10 ºC between room temperature and 120 ºC, under an air atmosphere. Cylindrical silver electrodes of 5.0 mm in diameter were used to contact the samples. The dc conductivity was determined from the bulk sample resistance using the impedance plots, Z, by extrapolation of the circular portion of the spectrum to the real axis Z’ , and then using the expression σ 0 = d/AR being R the intercept with the Z’ -axis, d the membrane thickness, and A the sample contact area with the electrodes. The Jonscher model 17
 ()1
()1
was used to determine σ 0 by fitting experimental data, where σ 0 is the dc conductivity (independent of frequency), A is a pre-exponential factor related to crossover frequency, ωp , and n is between 0 and 1.
From the impedance data, Z’ (ω) and Z’’ (ω), the values for real part of the conductivity (σ’), real part (ε’), and imaginary part ( ε’ ) of the permittivity were obtained by following relations:
 ()2
()2
 ()3
()3
 ()4
()4
where C 0 is the empty cell capacitance.
The Fourier transform infrared spectra, FT-IR, were recorded using a Vertex 70 with resolution 4 cm − 1, on an interval from 4 000 cm − 1 to 500 cm − 1. Spectra were obtained at room temperature and under a nitrogen atmosphere.
3 Result and discussions
Typical DSC curves for (1 x)(H3PO2/PVA)- xTiO2 membranes with constant ratio P/OH = 0.3 and different concentrations x (for 0.0%, red; 2.5%, green; 5.0%, blue; 7.5%, navy; 10.0%, olive) of TiO2 are depicted in Figure 1.
Figure 1: DSC curves for the (1 - x)(H3PO2/PVA)- xTiO2 membranes with TiO2 content of x = 0.0% (red), 2.5% (green), 5.0% (blue), 7.5% (navy), and 10.0% (olive), from 75 ºC to 250 ºC using a heating rate of 10 ºC /min under a dry N2 flux. The vertical arrow (for x = 0.0%) and the dotted line (for x = 2.5%, 5.0%, 7.5%, and 10.0%) indicate Tg .
It was reported 8 previously, for H3PO2 and PVA based membranes with acid high concentrations and high degree of hydration of the polymer that the glass transition temperature ( Tg ) was below 0.0 ºC. In our case, for low acid concentrations (P/OH = 0.3, x = 0.0%) the Tg is around 75 ºC (as indicated by the vertical arrow) while for TiO2 doped samples the Tg appears around 35 ºC (as indicated by a dotted line), thus clearly indicating the effect of the oxide filler. The melting point for all membranes is observed at around 175 ºC.
FT-IR spectra for PVA and (1 - x)(H3PO2/ PVA)-xTiO2 system are showed in Figure 2.
Figure 2: FT-IR spectra of PVA and (1 - x) (H3PO2/PVA)-xTiO2 with TiO2 content of x = 0.0% (red), 2.5% (green), 5.0% (blue), 7.5% (navy), and 10.0% (olive).
For pure PVA, four characteristic absorption bands are observed: the one at 3 485 cm-1 which is assigned to vibration along the C OH-chains bonds in PVA; the second one at 2 957 cm-1 attributed to asymmetric elongation of the CH-CH2-groups. The third one at 1 477 cm-1 was associated with CH-cross deformations in CH2-groups and the fourth band at 742 cm-1 was assigned to H-C-C-H-bound modes in the CH2 groups. Additionally, the H3PO2/PVA system was also characterized. In this case, two additional bands appeared which were associated with vibration along the Vas(PO2)-antisymmetric bonds and the Vs(PO2)-symmetric bonds at 1 269 cm-1 and 1 102 cm-1, respectively. Finally, by the addition of different TiO2 concentrations, spectra show changes (movement and intensification of the peaks) for bands associated to CH3, PO2, CH2, and C-C functional groups. These changes might be related to effects of approximation of the nanoparticles with the polymer chains.
Figure 3: TGA curves of (1 - x)(H3PO2/PVA)- xTiO2 with TiO2 content of x = 0.0% (red), 2.5% (green), 5.0% (blue), 7.5% (navy), and 10.0% (olive).
Figure 3 shows the TGA curves of the membranes at a heating rate of 10ºC /min. It is observed that all the TGA curves show a continuous weight loss as the temperature is increased. This loss is attributable to the evaporation of water molecules absorbed on the membrane surface or trapped within the chains of the polymer matrix. However, it is important to note that the losses presented between room temperature and 100 ºC increases with the concentration of TiO2 indicating higher water contentin the fresh samples as the oxide filler content increases. Later on, the electrical measurements will reflect the influence of water removal from the samples on their proton conductivities.
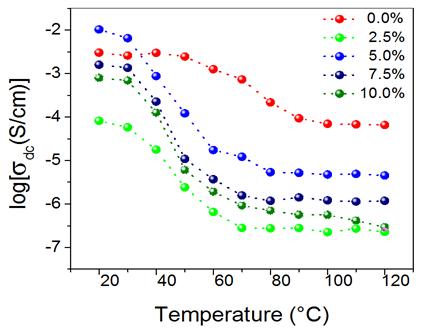
Figure 4: Temperature variation of the dc conductivity of (1- x)(H3PO2/PVA)- xTiO2 with TiO2 content of x = 0.0% (red), 2.5% (green), 5.0% (blue), 7.5% (navy), and 10.0% (olive).
Figure 4 shows the temperature variation of dc conductivity on a logarithm scale calculated from the impedance Nyquist plots of the (1 - x)(H3PO2/PVA)-xTiO2 membrane. The results show that dc conductivity values decrease with increasing temperature in the range where the membranes release water as noted in the results of TGA (see Figure 3) indicating that the proton transport membranes is provided in regions containing water that form a liquid phase or aqueous solution with H3PO2. This liquid phase coexists with a solid phase of the reinforced polymer, consisting of PVA, the acid which is not dissolved in the liquid phase, and the dispersed TiO2 particles, as discussed in references 9 and 18 for similar polymeric membranes. This phenomenon is common in perfluoronated hydrated membranes (Nafion®). The dc conductivity is between 10 − 5 S/cm to 10 − 2 S/cm at room temperature, being about 10 − 2 S/cm for 5.0% TiO2. Furthermore, above a decreasing step of dc conductivity, it remains at a constant value with increasing temperatures for each concentration. Conductivity values in this high-temperature interval have values from 10 − 6 S/cm to 10 − 4 S/cm that depends on concentration and the highest one correspond to x = 0.0%.
Figure 5: Log-log plot of the real part of the conductivity (σ’) as a function of (angular) frequency (ω) for (1 - x) (H3PO2/PVA)-xTiO2 with TiO2 content of x = 10.0% at several isotherms at 30 ºC (red), 40 ºC (green), 50 ºC (blue), 60 ºC (cyan), 70 ºC (magenta), 80 ºC (dark yellow), 90 ºC (navy), and 100 ºC (purple). Solid line represents a Jonscher model fitting according to Equation (1).
Figure 5 shows the real part of the electrical conductivity σ’ as a function of the (angular) frequency [ω = 2πf (Hz)] in double logarithmic scale at different isotherms. In all spectra it can be seen three distinct regions as the temperature increases: at low frequency, a strongly dispersive initial region (I) which corresponds to the charge transfer processes at the electrode-electrolyte interface, followed by an intermediate less dispersive frequency region (II) corresponding to the long range ionic transport (dcregime). Notice that σ’ decreases with increasing temperature between 20 ºC and 120 ºC. Finally, a highly dispersive frequency region (III), in which the conductivity increases rapidly with increasing frequency. This phenomenology can be attributed to strong correlations in the hopping of charge carriers (relaxation of conductivity). The behavior in region II and III follow the power law proposed by Jonscher 17, σ’ (ω) = σ 0 + Aωn , where n is a fractional exponent between 0 and 1. The parameter n has been proposed to be close to 1 for stronggly correlated ion motion and to be equal to zero for completely random and independent Debye-like ion hops 17. The Jonscher phenomenological model was used to fit the experimental data of the conductivity σ’ as a function of frequency represented by a solid line in Figure 5 to obtain σ 0 , n, and ωp parameters.
Table 1: Fitting parameters obtained from the Jonscher model for membrane with concentration x = 10.0%.
Table 1 gives the values for n, A, and σ 0 according to Jonscher model for the membrane with x = 10.0%. It is important to stress that the dc conductivity (σ 0) values coincide those calculated from Nyquist plots. On the other hand, the n-exponent parameters are between 0 and 1, except data recorded at 30 ºC and 40 ºC which give values higher than 1 that may be associated with high values of energy storage in the collective movements of the short-range ions and which can not be explained by Jonscher model. Moreover, the crossover frequency ( ωp ) values decrease with increasing temperature similar to those of dc conductivity. This observation indicates that all processes of ion transport, either long-range (dc conductivity) or relaxation (characterized by the frequency ωp ), have the same origin, that is, migration (jump) of the charge carriers in the polymeric matrix.
In terms of the dielectric permittivity, calculated from equation (3) and (4) for its real and imaginary parts, we have:
 ()5
()5
Figure 6: The correct and normalized imaginary part of dielectric permittivity, ε’’corr/ε’’m ax, for the (1 - x)(H3PO2/PVA)-xTiO2 membrane with TiO2 content of x = 10.0% at different isotherms as a function of frequency in logarithm scale. The solid lines are guides to the eye.
Figure 6 shows the result for the corrected and normalized imaginary part of dielectric permittivity ε’’corr/ε’’m ax, where ε’’corr = ε’’ − σ 0 /w for the composite concentration x = 10.0%. Here we observe a dielectric relaxation peak at low temperature and relavively low frequency. This peak is observed at around 103 Hz at different isotherms. We attribute this relaxation to the presence of water in the polymer that introduce polar effect in the composite.
4 Conclusions
Composite polymer electrolyte based on PVA-H3PO2,with constant molar ratio P/OH = 0.3, and reinforced with nanoparticles TiO2 (doping con centration x ≤ 10.0%), homogenously dispersed, have been prepared. The TGA results show that the oxide filler of TiO2 nanoparticles increases the water content in the hydrated composites. Moreover, the DSC results show that the glass transition for membranes based on H3PO2 and PVA with high acid concentrations and high degree of hydration of PVA is below 0 ºC, as reported previously, which is shifted to about 75 ºC for membranes with a low acid concentration of P/OH = 0.3, thus indicating that the acid aqueous solution plasticizes the polymer. However, when the membranes are reinforced with TiO2 the glass transition temperature decrease to 35 ºC, thus suggesting that the water content increases due to the presence of the porous TiO2 nanoparticles which increases the plasticity of the blends. On the other hand, the melting point appears at around 175 ºC for all membranes, close to that of the polymer matrix of PVA, indicating identical bond strength. Infrared spectroscopy spectra for pure PVA, as well as with acid content and with dispersed TiO2 nanoparticles show variation in the absorption peaks indicating that the acid and TiO2 are chemically coordinated to the PVA chains.
DC conductivity is in the range 10-5 S/cm to 10-2 S/cm at room temperature for TiO2 concentrations examined, reaching its maximum value of 10−2 S/cm for a 5.0%-TiO2 concentration.
The real part of the conductivity as a function of frequency shows a behavior known as Jonscher’s power-law, with a crossover frequency ( ωp ) associated with relaxation in the mobile ions. The temperature-dependency of ωp follows the temperature variation of the dc conductivity, suggesting a common origin in these processes as a consequence of correlations among ions hopping.
The permittivity of the hydrated samples (at lower temperatures) shows as a function of frequency dielectric relaxation peaks in its imaginary part that we attribute to the polar effect of the water molecule in the membranes.

