


 Inglés (pdf)
 Articulo en XML
 Referencias del artículo
 Enviar articulo por email
 Citado por SciELO
  Citado por Google
  Similares en
SciELO
Similares en
SciELO  Similares en Google
 Permalink
1 Introduction
The city of Pasto is located at the South of Colombia, at 1º,13’ , 16“ North Latitude and 77º,17’, 2” West longitude. The center of the city is placed almost at 9 km distance to the crater of Galeras volcano, which poses several kind of hazards among which lahar is one of the most important. According to [1],[2] lahars could reach the city.
According to [1], in our research area several basins around Galeras volcano are identified as prone to lahar generation. Of particular interest is Mijitayo creek, as it traverses the city of Pasto. Hurtado and Cortes [2] performed a first approach to quantify this hazard by just defining a buffer zone of 100 m at each side of the original path of the creek. However, in time the city streets and buildings blocks become a new artificial intricate and complex channel, where lahar flows can be expected.
From the engineering point of view, prediction of the dynamics of such a flows is done through modeling. The modeling techniques range from empirical or semi-empirical models (see for example [3],[4]) to models that consider the mechanics of their behavior (e.g. [5],[6],[7],[8]). Each kind of model have its own strengths and weakness. If the dynamics of the flow behavior is to be investigated or predicted, the later ones are to be used.
This study uses the computational program Titan2F [8] to investigate the path, the predicted flow depth and dynamic pressures that can be expected when typical lahar flows from Mijitayo creek reaches the city of Pasto. The sector of the city at which we apply the computational model Titan2F is known as Tamasagra, which covers several neighborhoods where there are almost 40.000 inhabitants (“Comuna” 7 and half of “Comuna” 6) that can be affected directly [9]. First we show some general concepts of lahars, followed by a brief description of the computational program. The environment of the place where the research is done is explained, followed by how the digital elevation model was adjusted for the needs and finally the results are presented.
2 Modeling lahars with Titan2F
Mud flows are bi-phase mixtures, whose fluid phase corresponds to water and the solid one to particles of mud, gravel and even rocks. A particular case of mud flows are lahars. According to [10] a lahar is a “rapidly flowing mixture of rock debris and water from a volcano”. Usually lahars can be classified from dense flows to hyper-concentrated flows [11] whose volumetric concentration of solids range between 20 % and 60 % [12],[13],[11]. Its average particle concentration evolves according to the conditions of bulking and debulking [11], and at any instant they show a complex internal structure [3],[14],[15]. The presence of two phases can not be neglected if the whole range of possible solid volumetric fractions are to be taken into account. One phase modeling approaches like the hydraulic pure fluid assumptions (see [16] for example) or pure frictional granular flows (as in [17],[18],[19]) lack with the full description of the complexities of the behavior of these kind of flows [14],[20]. In this study we use the computational program Titan2F as it combine both, frictional and pure fluid laws in one approach.
Titan2F was developed to account for both of the phases keeping a reasonable computational cost [8],[21]. The fluid part of the flow is modeled using typical shallow water like approach, whereas the frictional behavior of the solid phase is accounted by assuming that Mohr-Coulomb law is valid in such case, as in [17] and [18].
The equation system is based on conservation laws, as in [22].
The conservation of mass is shown through two equations, one for each phase:


were ρ
s is the solids density, ρ
f is the fluid density, φ is the volumetric fraction of solids, ˙
 is the velocity vector of the solid phase and ˙
 is the fluid velocity vector.
And, the momentum equations:


Here T s , T f are the stress tensors for the solid and fluid, and f s , f f the interaction force between the phases. Neglecting capillarity, virtual mass and lift, the interaction forces can be approached as [23]:
were the total fluid stress is T f = −P f + τ f , being P f the fluid pressure and τ f the viscous contribution to the fluid stress.
For the drag term (D), the approach of [24] is used:
where d is the mean particle diameter, β is a constant related to the constant n in Ricardson-Zaki equation [25].
We have assumed that the mass is fully saturated, which means φ f = 1 − φ. The drag coefficient is assumed to be constant C d = 1.
The above equation system provides the evolution through space and time of volume fraction, then, the density of the mixture is calculated as:

And, the dynamic pressure p is obtained from:
where ˙v is the mixture averaged velocity of the flow [26]
Where
 and
and
 are the speeds of each phase.
The information about impacting dynamic pressure can be used to estimate expected damage levels on structures (as in [27],[28],[29],[30]), which can be useful for vulnerability analysis.
The equation system is further integrated by depth averaging [17] (see [21],[8] for details), which is computationally cheap because is a 2D approach over a three dimensional topography. This approach is known as a pseudo-3D approach. Full 3D approaches on natural scale topographies can be computationally intractable for detailed digital elevation models, as usually required by hazard assessment.
The initial conditions required by Titan2F are just the location and volume of the initial pile of material and its volumetric concentration of solids. Initial velocity can be used as input as well. Several piles located in different places are allowed.
Titan2F computational code has been validated with analytical Dam Break solutions (see [31]) and verified with artificial channel experimental data [32] and with data from actual lahars produced by nature [32],[33],[8],[34]. It provides information about the evolution in space and time of runout distance, velocity field, flow depth, volumetric concentration of solids, and dynamic pressure. Thus, the code is very well suited for lahar hazard assessment. Nevertheless, as it runs over a 3D topography, the accuracy of the predictions strongly depends on the Digital Elevation Model (DEM) quality.
In the next sections we describe the application of Titan2F to the lahar hazard problem in a sector of Pasto city.
3 Digital Elevation Model (DEM)
In order to simulate the hypothetical scenarios to be studied, an ALOSPALSAR [35] of 10 meters per pixel resolution Digital Elevation Model (DEM) was prepared.
3.1 Description of the study area
The Tamasagra study area is located at the West part of the city of Pasto where the Mijitayo creek enters the city. Figure 1 shows a Google-Earth view of the sector, showing the top of Galeras volcano, where Mijitayo and Mirodo creeks are born. Both watercourses come together just before they penetrate into Tamasagra study area. Few meters before the urban area, the creek enters into an artificial channel [36] and flows under streets and buildings traversing all the city until its outfall in Pasto river.
Figure 2 shows a detail of the neighborhoods of the study area, whose population reaches almost 40.000 inhabitants [9]. Tamasagra neighbor typical streets are built for pedestrians. The average distance among houses there does not exceed 5 m. Across Mijitayo Ave. there is another region known as “El Bosque”, which is not as populated as Tamasagra, and with wider streets and parks. Along Mijitayo Ave. there are at least three critical facilities: the Water Treatment Facility and two schools.
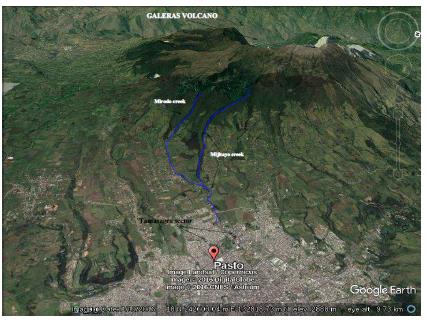
Figure 1: Google Earth view of the Tamasagra sector at Pasto, Colombia. Galeras volcano submit can be seen at the top of the image. In blue, Mijitayo and Mirodo creeks which come together to become Mijitayo river, which traverses the city, whose West part can be seen at the bottom of the figure.
Figure 2 Detailed Google Earth view of the Tamasagra sector at Pasto, Colombia. The blue line represents Mijitayo creek. The yellow lines are two main streets. Three main neighborhoods are shown as well. The location of two schools are shown. They are built next to Mijitayo Ave.
Mijitayo creek enters the city towards Tamasagra sector through a relatively narrow channel which shows sharp curves. Those topographical features and details can be properly integrated in our simulations if an accurate enough DEM is used.
3.2 DEM main improvements
For the purpose of gravity driven flows modeling, the 10 m DEM resolution could be suitable enough for smooth topographies. However, for narrow curves and urban sectors, channels and streets could be overly flattened, resulting in a reduction of the program predictions accuracy. In our case such a situation happen in a bend just previous to the entrance of the river to the city and among the actual streets in the sector, where most of the streets are designed for pedestrians. Figure 3a shows a vector representation of the DEM at a critical part of the topography, where initial test showed an over-spread of the flow and a trend to split it in two branches independently to the initial conditions. This problem is due to the low resolution DEM used that does not accurately represented the almost vertical walls that exist in this zone. Therefore, we decided to improve this part of the DEM using the topographic survey done by Narvaes and Rosero [37]. Figure 3b shows the improved DEM. Comparing both models it can be seen that adding the patch, the walls of the channel in that part are better represented, as well as the path of Mijitayo creek.
In addition, our DEM incorporates inherent uncertainties [38] as for example, non-realistic holes or crossing of contour levels. To reduce these uncertainties, the DEM was carefully smoothed using the tools included in GRASS-GIS package (see [39]), which ensured us a good representation of the topography, with filled holes and right flow directions. In addition, in order to account for the presence of buildings in the path of the flow, we extruded those buildings from the cartographic information again using GRASS-GIS. This procedure allow us to increment the DEM precision to 1 m in the city area. The other parts of the DEM where interpolated to the same precision. In that way, the program was able to predict the behavior of the flow when it penetrated into narrow streets. Nevertheless, that resulted in an increase of the computational cost. A test done using the maximum volume to be modeled, showed that a computational time of 50 hours to simulate 10 minutes of flow was needed.
Once the DEM has been improved and carefully smoothed, we proceed preparing the necessary input parameters for lahar simulations.
Figure 3 2 meter contour levels of a region just before Mijitayo creek enters into the city. The blue line represents Mijitayo stream. The city is located at the right of both figures. a) Vector representation of the Palsar DEM, where the topography seems not having abrupt changes. b) The patched DEM, where the actual vertical walls are represented more accurately as a direct topographic survey [37] was superimposed to the DEM.
4 Model Input Parameters
The input parameters needed by Titan2F are the location of the piles of material, its volumes, the initial volumetric concentration of the piles, initial velocities and simulation time [8].
4.1 Location of the pile
The location of initial piles depends on the most susceptible location where an actual debris flow could initiate. However, on volcanic environments, there is a great uncertainty regarding that location. For example, if the triggering factor is landslides, only detailed studies about susceptibility of the slopes to that hazard could give a clue of the several potential locations where a lahar can start. If the triggering factor is deposited volcanic ash or lapilli, there is no clue where it can start. Finally, if the triggering factor is a pyroclastic flow whose deposits block the river, the only indication would be geological records of previously deposited pyroclastic flows.
The matter becomes even more complicated as upstream of Mijitayo river, it splits in two creeks, Mirodo and Mijitayo streams, as shown in Figure 1. In this study, we overcome such location uncertainty by placing the initial piles just downstream of the junction of Mirodo and Mijitayo creeks, as shown in Figure 4. Nevertheless, this assumption adds the velocity at which the flow reaches that place as a new uncertainty.
4.2 Plausible scenarios
The Mijitayo river catchment settles over Jenoy Stage of Galeras volcano complex (see Figure 5 in [40]), whereas the superficial geology of the Mijitayo river basin consist mainly of lahar deposits [41],[1] and the 1866 pyroclastic flow deposit found at the head of it [42]. According to [2] lahar deposits are thick, massive and containing abundant lithic material. However, as shown in [41],[43],[44] the available information about lahar deposits towards the city of Pasto from Galeras volcano does not allow proper estimates of lahar volumes for individual basins or scenarios.
Nevertheless, probable scenarios can be deduced from the amount of solid material provided by volcanic deposits together with the maximum water run out that the catchment can produce. These deposits came either from pyroclastic falls or pyroclastic density currents. Assuming a concentration of solids of 50%, [36] estimated plausible volume scenarios for Mijitayo lahars based on area of mobilization and rainfall intensity. She estimated a maximum volume of 1.5 × 10⁶ m 3 based on the worst case scenario defined as the one with a large volume (mobilization area of 15 km 2, Table 2 in [36]) of solids mobilized by an extremely intense rainfall (50 mm/h), whereas she calculated he minimum volume as 104 m 3 assuming an small volume of solids mobilized by a 10 mm/h rainfall in one hour.
However, recent official data ([45]), suggest that such a maximum could be very unlikely. Using the Intensity-Duration-Frequency curves [45] for one hour duration (as in [36] ), the maximum expected rainfall intensity for a return period of 20 years might be about 25 mm/h, which corresponds to the volume of 7.5 × 10⁵ m 3 in [36] (see her Table 2].
4.3 Morphological characteristics of Mijitayo catchment
Once the location of the piles was prescribed, we defined the outlet of the hydrological catchment for that point. Using GRASS-GIS and the improved DEM we obtained the morphological characteristics of the basin as following:
4.4 Initial volume of the piles
The actual initial volume is another uncertainty since there is no previous knowledge about the amount of water and solids in future lahars. There are two approaches to address this uncertainty. One is a probabilistic approach, which using an statistically valid number of samples (see [46], [47], [34] for example) all the expected scenarios can be modeled. The second is to model few representative scenarios. In our case, one with the maximum expected volume, and other with a minimum volume worth to consider. The former method is computationally expensive, whereas the later is more simple and suitable for rapid hazard assessment. In this work the second method is used.
As the flow is assumed to be bi-phase, the total volume corresponds to a solid volumentic fraction (φ s ) plus a water volumetric fraction (φ f ), where the saturation condition φ s + φ f = 1 must be accomplished. In addition, the solids cannot be packed more than the maximum pack concentration, assumed here as φ s < 0.65 for spheres [26].
The maximum amount of water depends on the maximum amount that the catchment is able to supply. In this paper we estimate that volume through the maximum flow rate of the basin. For simplicity, we averaged the Sciemence, Quijano and Zapata methods (see [48] for details). Taking into account the morphology of the basin (see section 4.3) the maximum flow rate that Mijitayo basin can provide is Q max ≈ 83.5 m 3 /s. Then, for a concentration time of t c = 0.71 h (note that [36] assumed 1 h) , V wmax =212, 805 m 3. This is the maximum water volume expected to be supplied by Mijitayo basin, which due to the saturation condition, corresponds to 35 % of the total maximum volume of the lahar. The maximum volume of solids corresponds to the other 65%, thus V s = 395, 210 m 3. By adding both volumes V Max ≈ 610.000 m 3, which corresponds to a maximun rain fall intensity between 20 mm/h and 25 mm/h in [36], and in agreement to the maximun expected rain fall in [45] for a return period of 20 years.
It is worth to note that the maximum volume assumed here is above empirical approaches that use catchment morphology to estimate maximum volumes, which for our basin, does no exceed 550, 000 m 3 [49], [4].
The minimum volume is accounted for by assuming that the lahar is generated just by the mobilization of the deposited ash from an average eruption of Galeras volcano. From [2], it can be estimated that up to 2 mm of ash can fall over Mijitayo catchment. That deposited thickness means a volume of solids of V s = 23, 285 m 3. If this V s corresponds to the 65 % of solids, the volume of water becomes V w = 43, 244 m 3, thus, V min ≈ 66, 250 m 3.
4.5 Initial concentration
As Titan2F is capable to model the space-time evolution of the volumetric concentration of solids within the flow, it is necessary to define the type of flow to be modeled. According to their volumetric concentration of solids, lahars can be classified as wattery flows (volumetric concentrations below 20%), muddy lahars (volumetric concentration between 20% and 30%), hyperconcentrated flows (volumetric concentrations between 30% and 50%), and even granular flows (volumetric concentrations above 50%) [50, 13]. In her study about lahars at Mijitayo creek, [36] used a volumetric concentration of 50%, which represents the limit between hyperconcentrated and granular flows. However, as there will be entrainment of water from the river, we assumed the average volumetric concentration of solids for hyperconcentrated flows which corresponds to 40%.
4.6 Initial velocity
The uncertainty for the actual location of the pile along Mijitayo and Mirodo creeks implies an uncertainty in the velocity at which the flow arrives to the location of the computational pile (see 4.1). This uncertainty about the place where the flow begin its movement implies different arrival velocities to the selected location of the pile where we start our computational simulations. We address this uncertainty by estimating the maximum and minimum velocity from which the pile initiates its movement.
The maximum velocity can be assessed assuming the critical scenario at which the flow starts at the highest part of the basin. In that way the maximum velocity can be estimated through several approaches, from empirical ones (e.g. [4],[16]) to physics based ones (e.g. [51],[52],[4],[53]). For debris flows [4] recommended the approach that best fitted all his available data [equation 10]:

where the discharge Q is approached with the equation 11.

where B is the width of the dam breach, and h is the height of the pile. In our case, we assume B as the width of the initial pile. The height h is calculated here as the average height along the 5.700 m length channel. As the erosion-deposition process is not taken into account, the mass must be conserved, as well as the volume, which fits the idea of Box Models [54],[55] (see [56] for details about Box Models). Thus, for a volume V = 610.000 m 3, the average h ≈ 8 m. Applying equations 11 and 10, the maximum velocity at the starting place becomes v ≈ 9 m/s.
Nevertheless, more critical is the case where the flow is frictionless along the stream bed. In that way, the velocity can be estimated from the free fall velocity times the projection of the vertical distance on the average slope of the correspondent creek, in a similar fashion as the approach of [57]:

where ˙v is the maximum estimated velocity at which the flow will be modeled, ∆h is the altitude difference between the maximum elevation and the minimum elevation of the basin (see section 4.3), β is the mean slope of the creek, and g ′ = g(ρ − ρ f )/ρ the reduced gravity. Replacing the data in equation 12, the maximum velocity results in v ≈ 13 m/s.
The minimum velocity is assumed to be zero, in order to account for the possibility that the flow starts its movement just at the location of the pile.
Additionally, it is assumed that the mean direction of the velocity coincides with the direction of the stream in the point corresponding to the location of the piles.
5 Modeling and results
We assume the most critical case as the combination of maximum volume with maximum velocity which represents the worst scenario predicted by our modeling. Figure 5 shows the flow depth after 10 minutes of simulation. This scenario is useful to limit for example the vulnerability analysis area. It shows that in the sector located in front of the Water Plant Facility the flow depth could reach up to 8 m, which can potentially bury most of the houses in the sector. Also, the buildings at the Water Plant could be inundated. In El Bosque neighborhood, flow depths up to 7 m are expected under this critical scenario, which can bury even two story buildings. Nevertheless, in Tamasagra neighborhood just along its narrow streets the flow might reach only 2 m, which could bury one story houses. In this worst case scenario, the schools located along the Mijitayo Ave. can be heavily affected by a lahar flow equivalent to our simulation.
The dynamic pressure field predicted by Titan2F for this scenario is shown in Figure 6. Very destructive dynamic pressures (see [30] for relationships dynamic pressure Vs total destruction probabilities) are predicted at the flow entrance to the city, where the Water Treatment Facility is located (see [36] for a vulnerability analysis of this particular facility). That level of dynamic pressure shows that in the worst case scenario strong erosion can be expected. San Felipe schools can be exposed to destructive over-pressures and the houses of Tamasagra neighborhood located on the verge of Mijitayo Ave. as well.
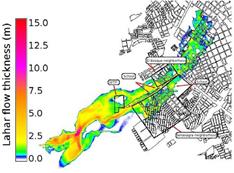
Figure 5 Expected flow depth for the the maximum volume and maximum velocity scenario. The Water Treatment Facility is shown as WTF. The colored scale is in meters.
Figure 6 Expected flow dynamic pressure for the the maximum volume and maximum velocity scenario. The Water Treatment Facility is shown as WTF
However, decisions based on worst case scenario become a very expensive choice regarding that such scenario could be unlikely. Thus, a probabilistic approach that considers all possible cases are desirable. Nevertheless, to account for all possible cases results in an infinite set of combinations of initial conditions within the ranges of initial maximum and minimum volumes and particle concentration. In this paper we use the Orthogonal Latin Hypercube Sampling (OLHS) method (see [58],[59],[60]) in order to get an statistically valid sampling that best represent all the possible cases, using a finite number of combinations. We modeled 128 OLHS samples, which result in an error in the probability prediction of the order of O(10−4) [60].
Titan2F provides information about the spacial and time evolution of the flow depth, solid particle concentration, as well as the fields of velocity and dynamic pressure. Using Octave scripts developed for probabilistic analysis purpose, we calculate the probability that any of the required fields provided by Titan2F overcome a threshold of interest. Figure 7a shows the probability for the flow to exceed 1 m depth. Titan2F predicts a very high probability that the flow depth reaches more than 1 m depth up to the half of the area of Tamasagra neighborhood, which means that this part of the sector could face the burial of many of their structures. In addition, this figure shows that even beyond the analyzed sector, there is a high (more than 50%) probability that the flow reaches very dangerous flow depths.
Figure 7 Titan2F predictions for the probability of a) inundation level larger than 1 m, b) Dynamic pressure larger than 10 kPa. See text for details.
Considering the dynamic pressure, Figure 7b shows the probability that the flow reaches 10 kPa, which is regarded as a dangerous level for humans [61], as they can be blow off or drag by the flow. Almost most of the Tamasagra sector shows a very high probability of being affected by overpressures larger than such a threshold. In special the sensitive schools zone. For the El Bosque neighborhood the results show probabilities larger than 50% that the flow reaches dynamic pressures dangerous for living beings.
Each of the 128 simulations of almost 10 minutes of flow lasted more than 100 hours computational time. This was due to the high resolution of the DEM, needed to allow the simulation to account for the streets and buildings. The use of the OLHS sampling method considerably saved computational time in comparison to the Montecarlo method, in whose case we could require thousands of samples
6 Conclusions
In this paper we have studied the lahar hazard that could occur in Mijitayo creek towards the city of Pasto. Particularly, we constrained our study to the most populated sector that can be affected, which is Tamasagra sector.
The analysis was done from predictions that resulted from the modeling with the software Titan2F, which requires few initial conditions like the location of the piles of material, initial volume and solid concentration. However, these initial conditions are unknown. We defined ranges of possible volume and concentrations based on geology and physics of the expected flows. From our analysis, the maximum expected volume was above empirical estimates found in the literature. The range of concentrations was constrained from the maximum pack concentration to a minimum for hyperconcentrated flows. The infinite range of possible combinations was reduced to a finite ones by the use of the Orthogonal Latin Hypercube Sampling that provides a possibility of assessing all the possible cases by simulating only few dozens of samples with a very low error, of the order of O(10−4), that is 1 event each 10.000 years. This considerably saved computational time, compared with Montecarlo method, which could require thousands of samples to reach the same accuracy.
In addition we tested the worst case scenario, using the maximum expected volume combined with the maximum expected initial velocity. By doing that test we were able to limit the computational domain, which at the same time can be used to constrain the area of study for vulnerability assessment purposes.
Titan2F allows to identify important parameters for risk management, like flow path, run out distances, dynamic pressures and inundation levels. Combined with statistical sampling methods, probabilistic assessment for thresholds of interest can be predicted. For example, there is a high probability that the flow reaches burial levels of inundation along the Mijitayo avenue, and even within Tamasagra and El Bosque neighbors. In addition, there is a high probability that the flow enters the city of Pasto with dynamic pressures dangerous for human lives, and even large overpressures enough to put in risk the buildings of the sector. It is remarkable that the schools located nearby Mijitayo ave. could face dangerous levels of inundation and dynamic pressures, suggesting that it could be better to relocate such a places.

