


 Inglés (pdf)
 Articulo en XML
 Referencias del artículo
 Enviar articulo por email
 Citado por SciELO
  Citado por Google
  Similares en
SciELO
Similares en
SciELO  Similares en Google
 Permalink
1 Introduction
Fe-Al based alloys are applied in wide fields and attracted more attention owing to excellent high-temperature corrosion resistance, low cost, reasonable weight and considerable mechanical properties. The thermophysical properties of Fe-Al alloys are basic knowledge for thermal engineering application, as well as such promising materials development, this supported by Ruan and collaborators [1]. Meanwhile, the knowledge of phase relations in the Al-Fe system is important to understand the properties and microstructure of commercial Al-alloys, which contain also other components such as Si and Mg. Even small amounts of Fe may cause formation of intermetallic compounds substantially influencing mechanical, an important study carried out by Zienert and Fabrichnaya [2]. Beside, Han et al. [3] in your research work, which phase equilibria of the Al-rich portion in the Fe-Al binary system were determined by conventional heat treatment for equilibration, the diffusion couple method and thermal analysis and equilibrium compositions of the Fe-Al alloy were determined at temperatures between 600 o C and 1145 o C, wherein solubility ranges of the ζ - FeAl 2, -η Fe 2 Al 5 and θ - Fe 4 Al 13 phases were determined in detail, by these authors. For instance, several intermetallic phases (e.g., Fe 3 Al, FeAl and FeAl 3) may form in the Fe-Al system depending on the composition and cooling rate, especially from the Al-rich melts through invariant (peritectic, eutectic) or congruous solidification transformation, as described by Mukherjee et al. [4]. However, Al-Fe based alloys can be used in a variety of applications, e.g. packaging, architectural sheet and lithography sheet, as agreed upon by Goulart et al. [5]. The AA 6xxx Al alloys, for instance, contain Fe intermetallics, such as A-Fe, Al-Fe-Si and Al-Fe-Mn-Si phases, which are formed between the aluminum dendrites or cells. The type of phase formed depends mainly on the cooling rate and on the Fe to Si ratio of the alloy [5].
Fe-Al based alloys are applied in wide fields and attracted more attention owing to excellent high-temperature corrosion resistance, low cost, reasonable weight and considerable mechanical properties. The thermophysical properties of Fe-Al alloys are basic knowledge for thermal engineering application as well as such promising materials development, this supported by Ruan et al. [1]. As agreed upon by Goulart et al. [5], Al-Fe based alloys can be used in a variety of applications, e.g. packaging, architectural sheet and lithography sheet.
Micro-indentation is often used to study the mechanical behavior of materials in ultra-precision machining, as the depth of cut is of the order of microns and is smaller than the size of the grain of a polycrystalline material, therefore, a diamond indenter resembling a diamond cutting tool, it is also frequently employed to investigate material properties. Swadener et al. [6] conducted a number of indentation experiments by employing spherical tips of various indenter radiuses to examine the indentation size effects, and they observed that the spherical indenter is a special case in which hardness depends on the indenter radius rather than on the indentation depth. Experimental results are presented which show that the indentation size effect for pyramidal and spherical indenters can be correlated. For a pyramidal indenter, the hardness measured in crystalline materials usually increases with decreasing depth of penetration, which is known as the indentation size effect. The investigation of the indentation size effect is an active research area that has stimulated the development of various plasticity theories, to model the length scale-dependent problems. The formulations of 2D and 3D discrete dislocation dynamics are among such efforts in an attempt to bridge the gap between the nano-indentation and the scale-independent continuum plasticity. Chen and Bull [7] point out that nano-indentation technique is preferred over other methods because very thin film can be characterized without any damage or delamination from the substrate. To obtain accurate results, the substrate effect should be negligibly small. To measure hardness of coatings, it is assumed, as a rule of thumb, that indentation depth should not be more than 10% of coating thickness to avoid substrate influence. Bressan et al. [8] remarket that with the advent of powerful finite element analysis programs, it is imperative to simulate nano-indentation process. When the response of the specimen is elastic only, the elastic stress field at the contact region is well-defined regardless of the type of indenter. But for elastic-plastic or viscoelastic response it becomes extremely difficult to obtain stress fields around contact area especially when the indenter is Vickers. This is due to 3-dimentional phenomenon associated with large plastic strains, as describe by Fivel et al. [9] and these authors pointed out, which nano-indentation with Vickers is one of the most complex contact problems. In this case, finite element method is considered as valid candidate to have stress distribution and displacement plot during loading and unloading processes.
Micro-indentation is often used to study the mechanical behavior of materials in ultra-precision machining, as the depth of cut is of the order of microns and is smaller than the size of the grain of a polycrystalline material, therefore, a diamond indenter resembling a diamond cutting tool, it is also frequently employed to investigate material properties. The investigation of the indentation size effect is an active research area that has stimulated the development of various plasticity theories, to model the length scale-dependent problems. Swadener et al. [6] conducted a number of indentation experiments by employing spherical tips of various indenter radiuses and pyramidal indenter to examine the indentation size effects. For a pyramidal indenter, the hardness measured in crystalline materials usually increases with decreasing depth of penetration, which is known as the indentation size effect. Chen and Bull [8] point out that nano-indentation technique is preferred over other methods because very thin film can be characterized without any damage or delamination from the substrate.
Finite element implementation, was discussed by Abbo [10]. Performing the finite element discretization in the usual way, which involves up the equation system, being that, the plasticity relations must be satisfied on the material level. Meanwhile another proposal, elastic-plastic transition can be divided into two regions, an elastically dominated regime and a plastically dominated regime, [11],[12] and [13] proposed this study. To simulate the micro-indentation, the recommendations of these authors were followed in this work.
The objective of this work was to perform a study experimental and numerical simulation, in the Al-2.0 wt.% Fe alloy treated by laser surface remelting (LSR), this process was performed to investigate the treated and untreated layers areas, at different laser beam scanning, among them, 80, 100 and 120 mm/s, to respect, was presented and discussed about microstructural characteristics using the FEG and EDS techniques, and numerical experiments of pyramidal indentations of the LSR-treated systems were conducted using the FEM method.
2 Review of the lower-order gradient plasticity model
2.1 Incremental stress-strain relations
In computational elasto-plastic analysis one usually proceeds by applying a load increment, which produces a displacement increment, and thus a total strain increment. The stress increment corresponding to this increment in total strain, it can be determined by a constitutive relation similar to the relation one has in elasticity, i.e.

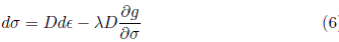
where D ep is the elasto-plastic constitutive matrix. Such a relation was first derived and used in a finite element context by [14] and [15]. The elasto-plastic constitutive matrix can be derived by considering the basic relations discussed in the foregoing. The total strain increment is given as the sum of the elastic strain increment and the plastic strain increment.

Hooke’s law gives the relation between stresses and elastic strains as

or in rate form as

where D is the elastic constitutive matrix. The plastic strain increment is determined by the flow rule as
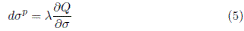
Where, s p is the plastic deformation rate, λ is a hardening parameter, Q is the plastic potential and σ is the applied tension, as emphasized by Celentano et al. [16].
Thus, the stress increment is given by to add the second term of Equation (6)
3 Material and methods
In the present work, Al-Fe alloys with 2 wt.% Fe compositions were used. The samples were elaborated in the Laboratory of Materials Engineering of UNICAMP-SP, Brazil, Al-Fe binary alloys were prepared from high purity Al (99.99% ) and Fe (99.9% ) using a high-frequency induction melting furnace under an Ar (99.999% ) atmosphere.
The laser surface remelting (LSR) treatment was applied to the Al-Fe alloy to investigate the areas of treated and untreated layers, this type of treatment was carried out in the laboratory of the Institute of Advanced Studies of CTA-ITA Aeronautical Technological Center, with a 2 kW Yb-fiber laser (IPG YLR-2000S), the treatment process was done without gas protection, in order to produce the alumina phase, in our former work Pariona and Micene [17].
In order to study the layer treated by LSR with the optical microscopy technique, the samples were cut with a diamond disc, prepared in the cross-section by sanding, and then polished with diamond paste (1µ m) and colloidal silica. After this process was carried out a chemical attack, with a hydrofluoric acid solution of 2% /volume, 25% of nitric acid and soon was completed with water. The duration of the attack was about 4 min. With this technique the molten pool geometry and the interface of regions treated and not treated by the laser beam were analyzed in a cross-sectional sample. Also, the treated material and the substrate were analyzed by SEM-FEG microscopy and coupled to the dispersive energy spectroscopy (EDS) mapping, in order to verify the microstructural modifications caused by the laser treatment.
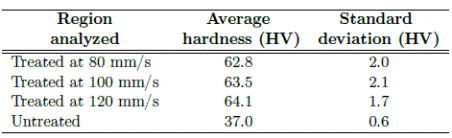
Vickers Hardness (VH) was measured in the cross-section of the material using a microhardness meter. Hardness tests were performed on the part to quantify the surface hardness in the molten pool geometry and in the untreated region.
4 Numerical simulation setup of the microhardness
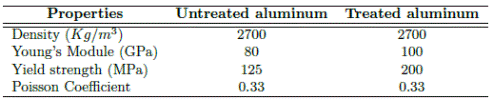
In order to be able to simulate the Vickers microhardness, two domains were used, one of which represents the laser treated material and the other one without treatment, in which the plastic deformation localized in the sample was considered. The properties of the domains are shown in Table 1
Table 1 The physical-mechanical properties of aluminum treated and untreated, proposed by Goulart [18].
In order to simulate the microhardness test, geometry of the indenter was constructed as a diamond pyramid, with an angle between the faces of 136◦ , with the edges of the bases measuring 1.55 mm and a height of 0.3131 mm [Figure 1a), in the same geometry the contour condition and the non-deformation plastic regime were considered.
The domain of the material to be indented [Figure 1b) was considered as a block of dimensions 3x3x0.3 mm, for both, treated and untreated samples, and the materials were considered with different mechanical properties (see Table 1].
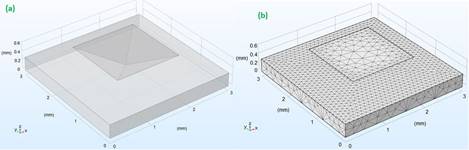
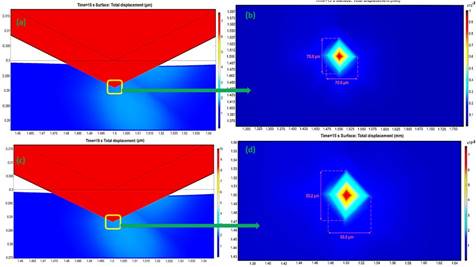
Figure 1 (a) Representation of geometry used (b) 3D finite tetrahedral element mesh was used for numerical simulation by FEM.
4.1 Implementation for the numerical simulation execution
To simulate by means of finite elements, a 3D finite tetrahedral element mesh was generated on the sample [Figure 1b). The simulation was performed in a transient regime, with duration of application pressure in 15 s, at intervals of 1 s. On the indenter a constant load of 200 gf was established.
Full characterization and finite element model validation require experimental results as well. For example, just to start simulation, must be defined an elastic-plastic behavior by load-displacement curve to be extracted the data [18], reported this study for Al-2 wt.% Fe alloy, beside [12], obtained the data for the simulation from nano-indentation experiment. Meanwhile another proposal, elastic-plastic transition can be divided into two regions in [12],[13] and [14] proposed this study. The idea is as to follow:
An elastically dominated regime, in which a single universal law holds
A plastically dominated regime where deformation is dependent on strain hardening characteristic of materials. The universal behavior observed in first regime can be used to estimate material properties without prior knowledge of work hardening.
4.1.1 Numerical Vickers indenter Boundary load:

Where F is the applied force, σ is the normal stress and A is the area of application of the force at the base of the diamond pyramid.
Fixed constraint:

Where u is the velocity of the selected domain, that is, it established that the sample to be indented was considered fixed or without movement.
4.1.2. Finite element implementation The implementation of the elastoplastic constitutive relations in a finite element context requires the consideration of two different levels, in the following called the global level and the material level, respectively. On the global level equilibrium must be satisfied as in any other linear or nonlinear finite element computation, whereas on the material level the plasticity relations must be satisfied, which was discussed by [10]. Performing the finite element discretization in the usual way, which ends up with the following equation system.

Where f is the applied force and K is the stiffness matrix given by
Where B is the element strain-displacement matrix. Since the constitutive matrix D ep depends on the current state of stress and the stiffness matrix is nonlinear. Moreover, since the response of the system depends of the deformation history, an incremental relationship between displacement and force is needed, i.e.
Here K t is the tangent stiffness matrix, i.e. a linearization of the exact nonlinear stiffness matrix. The computations now proceed by applying a load increment ∆f and computing the corresponding displacement increment.
The strain increment is computed in the usual way as

Next, the stresses are computed. This is done via the elasto-plastic constitutive relation, Equation (1).
5 Results and discussions
In this section, the results obtained from the characterization of Al-2.0 wt.% Fe alloy LSR-treated, at the laser beam scanning: 80, 100 and 120 mm/s are presented and discussed using the techniques and methodologies already described, where its microstructural modifications will be analyzed, besides its aspects related to micro hardness.
5.1 Characterization in the molten pool cross-section
The micrographs were analysis by FEG and EDS in the sample cross-sectional and soon in the molten pool geometry for different laser beam scanning (LBS) were analyzed.
In the micrograph [Figure 2] for the laser beam scanning at 80 mm/s is shown the overall view of the cross-sectional of the untreated zone. Where the molten pool geometry by the LSR-treated is shown in Figure 2a, which shows a microstructure with uniform characteristics, compared to the microstructure of the untreated zone, moreover, this behavior were very similar for several velocities studied. Besides, the micrography in the untreated region was enlarged, as is seen in Figure 2b, in which there is the presence of intermetallic Al 13 Fe 4, which is predicted in the equilibrium diagram [19], discussed this fact, still, this zone was much more magnified, as shown in Figure 2c, with a characteristic lamellar structure, the average length of 5.7Vm of the lamellae. Also within this microstructure are visualized a rounded structures in the form of pores, whose average of rounded structure is 1.3Vm, moreover, in this zone by EDS analysis was made at four distinct points, as seen in Figure 2d, in average, the Al concentration was 99.7 wt% and for Fe it was 0.3 wt% . Because, in the Al-Fe system, even small amounts of Fe may cause formation of intermetallic compounds substantially influencing mechanical, an important study carried out by [2].
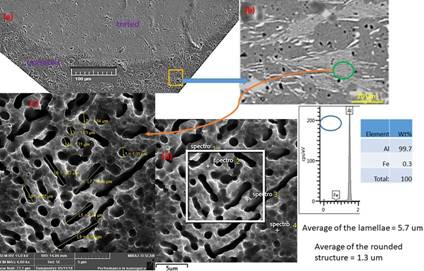
Figure 2 For the laser beam scanning at 80 mm/s (a) overall view of the cross sectional image treated inside micrograph, (b) magnification of the untreated region, (c) high magnification of the region (b), (d) EDS analysis.
In Figure 3 is analyzed again the molten pool geometry for the laser beam scanning at 80 mm/s, whose geometric dimensions are appreciated, where the width was around 541µ m and 131µ m the depth [Figure 3a). In the treated surface was generated the formation of a thin remelting layer, with refined microstructure. Following the magnification of the molten pool zone [Figure 3b), where the nano-structure has the columnar dendritic growth characteristics and [Figure 3c) with the high magnification of the zone [Figure 3b), where nano-porosities between columnar growth characteristics appear, with an average size of 200 nm, intermetallic precipitates and inclusions indicated these in micrograph are observed in this region, as discussed by [20]. Furthermore, in Figure 3b and EDS analysis is shown at four distinct points in this region, on average of the O concentrations were 10.92 wt% , of the Fe was 2.36 wt% and of the Al was 86.72 wt%
. It should be noted that in this region, the Fe concentration is higher, but the Al concentration was lower than in the untreated region [Figure 3b), to see Table 2. This may be possibly due to the presence of oxygen in the treated zone, which has a good percentage of concentration; however, the laser remelting process was performed in the environment. Meanwhile, at the interphase in the treated and untreated regions [Figure 3d), the structure shows a dendrites accumulation towards to treated region and others towards to untreated region, in this region certain nano-porosities are visualized. Besides, an EDS analysis was performed, where the O was 12.35 wt% , the Fe was 1.86 wt% and the Al was 85.8 wt% and these values can be observed in Figure 3d. in this case the oxygen concentration increased slightly, the Fe concentration decreased and the Al concentration decreased slightly compared to treated region (to see Table 2], this detail were argued by [19].
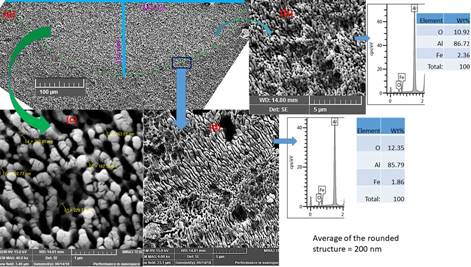
Figure 3 Cross section view of LSR-treated metal surface, for the laser beam scanning 80 mm/s. (a) treated and untreated zones, (b) magnification of treated region, (c) high magnification of (b) region and (d) interface region and EDS analysis.
For laser beam scanning at 100 mm/s, at Figure 4a the molten pool geometry is appreciated, where the width was around 424µ m and 110µ m the depth. The microstructure [Figure 4b) shows a change to a characteristic of compact columnar dendritic growth and the grain size is refined with average of the rounded structure of 166 nm in comparison with Figure 3b with average of the rounded structure of 200 nm. Making a similar discussion that was done around the analysis by EDS in the previous paragraph for 80 mm/s, whose result is shown in Table 2 for 100 mm/s, where for O was 13.42 wt%, Fe was 1.88 wt% and Al was 84.71 wt%, observing, the oxygen concentration is slightly higher than for 80 mm/s, however, the concentration of Al and Fe were slightly lower for the case of 80 mm/s, nevertheless, the concentration of Al was lower than at untreated region and the concentration of Fe was higher than at untreated region, as pointed out by [19]. This imply change in the microstructure morphology in the treated area and in the interphase, as can be seen in Figures 3 in comparison with Figure 4 and that the average of the rounded structure was 166 nm, being smaller than the previous case.
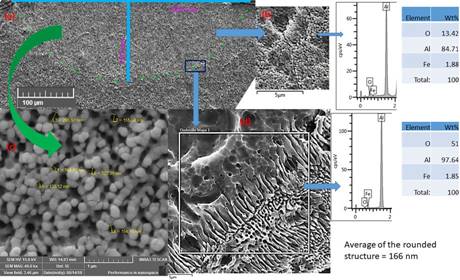
Figure 4 The FEG exhibition in the LSR-treated sample cross-sectional area, for the laser beam scanning 100 mm/s. (a) Treated and untreated zones, (b) Magnification of treated region, (c) high magnification of (b) region and (d) interface region and EDS analysis.
In Figure 5, for the laser beam scanning at 120 mm/s, the result presented columnar dendritic growth characteristics a lot more compact than Figure 3 and Figure 4, which generated the creation of multiple nucleation within the bulk liquid and the grain size has drastically reduced, in this case, the microstructure seems to consist of a cellular arrangement or fine-grained microstructure. Following a similar discussion of the previous paragraphs for EDS analysis, the result is shown in Table 2 for 120 mm/s, where for O was 10.1 wt% , Fe was 2.4 wt% and Al was 87.5 wt%, observing, the oxygen concentration is similar for 80 mm/s, but below that for 100 mm/s, however, the Al concentration was slightly higher than for the previous cases and the Fe concentration was similar for 80 mm/s and slightly higher for the case of 100 mm/s, meanwhile, the Al concentration was lower than at untreated region and the Fe concentration was higher than at untreated region, this is supported by [19].
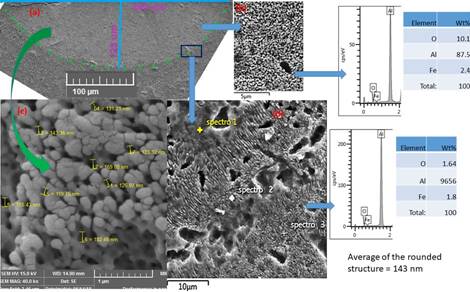
Figure 5 Cross-sectional FEG image of Al-1.5wt.% Fe alloy sample, for the laser beam scanning 120 mm/s. (a) Treated and untreated zones, (b) Magnification of treated region, (c) high magnification of (b) region and (d) interface region and EDS analysis.
Then, the concentration of the elements and high laser beam scanning influence the change in the microstructure morphology in the treated zone and in the interphase, as can be observed in Figure 5 compared to the previous results, as well as in the size of the average of the rounded structure was 143 nm, which was much smaller than for the previous velocities. The molten pool geometry characteristic and the elements concentrations are given in Table 2.
Table 2 In different laser beam scanning were measured, the elements concentrations at wt%, the molten pool geometry with width (Wt) and depth (Dp) in Vm and average of the rounded structure (Av) at nm (Av) at nm, [20].
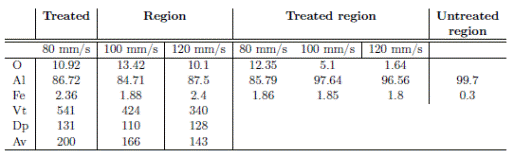
According to Table 2, an analysis of the different elements in the region treated, in different laser beam speed, at the interface treated and untreated region were done. Observing Table 2, sometimes, a concentration of the elements that does not follow a linear behavior, where the interaction of the laser beam with the sample can be of complex behavior and also the measurements by EDS analysis are very sensitive, when the points in the considered regions are varied. For example, the concentration of oxygen in the treated region at different laser beam scanning, shows at first 10.92 wt% at 80 mm/s, increases the concentration and before long decreases slightly at high speeds of the laser beam, however, at the interface region, the concentration of this element in beginning is high, of order 12.4 Wt% at 80 mm/s and soon decreases to 1.64 wt% at 120 mm/s and it is worth noting, the concentration of this element is much greater at treated region. However, the aluminum concentration also had a non-linear behavior at treated region, starting at 86.7 wt% at 80 mm/s, decreasing the concentration and growing again at the same order of magnitude of the initial concentration, on the other hand, at the interface region, the concentration of this element is non-linear also, it should be noted that the concentration of this element prevails in the latter region, for other of laser beam scanning were executed by [20]. In addition, the concentration of the iron has a non-linear behavior at region treated and but rather, in this case, it has a linear behavior at interface region, being that it has higher concentration of this element at treated region. In addition to this, at untreated region has a high concentration of aluminum and low concentration of iron at region of Figure 3b. Beside, according to Table 2, in relation to the molten pool geometry, the width has a linear decreasing behavior, being high, in the order of 541 µ m at 80 mm/s and falls to 340 µ m at 120 mm/s, nevertheless, the depth, also has a tendency of decrease due to the increase of the laser beam scanning, however, in laser beam scanning the depth increases slightly but lower than value from 80 mm/s. The average of the rounded structure (Av), had a decreasing linear behavior, presenting a higher value around 200 nm at 80 mm/s and lower value around 143 nm at 120 mm/s, being these measures coherent with different laser beam speed, for other of laser beam speed were performed by [20].
5.1.1 Micro-hardness (HV) measurements in different laser beam scanning Next, in this work the micro-hardness (HV) measurements were made as a function of the variation of the laser beam scanning, the images of the impressions provoked by the Vickers penetrator can be visualized in Figure 6, therefore, for the treated region, at 80 mm/s [Figure 6a), at 80 mm/s [Figure 6b), at 80 mm/s [Figure 6c) and for untreated region [Figure 6d), moreover, a schematic representation of micro-hardness result in different the laser beam scanning is displayed [Figure 6d). The result is shown in Table 3, whose results are quite similar in different laser beam scanning and has a linear behavior, being slightly low micro-hardness value at 80 mm/s and slightly high at 120 mm/s [12], discoursed this problem, these results are consistent with the microstructures presented in the previous Figure 5, well, at 80 mm/s presented a columnar dendritic growth characteristics, at 100 mm/s presented a compact microstructure similar to the previous one and at 120 mm/s presented a lot more compact microstructure also similar to the previous one. Therefore, the micro-hardness measurements are also in agreement with the order of magnitude of the rounded structure average (see Table 2], for small sizes of the rounded structure the micro-hardness was high. For the micro-hardness measures made at the LSR-treated region in different laser beam scanning, the result is presented at Figure 6c. It is also shown at Figure 6a the impressions provoked by the Vickers penetrator at untreated region and at Figure 6c the micro-hardness result is presented, where the micro-hardness in this region is almost half of the treated region, thus the treated region has a better performance than the untreated region [21], showed more detail of the technique.
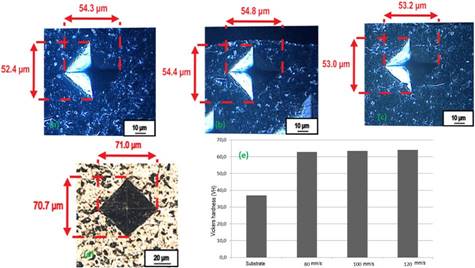
Figure 6 The impressions provoked by the Vickers penetrator. For the treated region, (a) at 80 mm/s, (b) at 100 mm/s, (c) at 120 mm/s, (d) for untreated region and (e) a schematic representation of micro-hardness result in different the laser beam scanning.
5.2 Numerical simulation of micro-hardness
5.2.1 Test: simulation and validation To simulate by means of finite elements in this work, a 3D finite tetrahedral element mesh was generated on the sample [Figure 1b). It has been established, which the simulation was performed in a transient regime, with duration of application pressure in 15 s, at intervals of 1 s. On the indenter a constant load of 200 gf was applied. The physical properties of the material, an elastic-plastic behavior by load-displacement curve was considered, in [18] reported this study for Al-2 wt.% Fe alloy [Table 1]. In this section a numerical simulation study of micro-hardness in the molten pool geometry for the laser beam scanning at 80 mm/s and in untreated region was carried out.
The results of the numerical simulation are shown in Figure 7. The geometry of the indenter and material [Figure 7a), and the impressions provoked by the Vickers penetrator in the treated region [Figure 7b) are displayed. Moreover, for the untreated region [Figures 7c and 7d) are presented. Therefore, the experimental results and the numerical simulation of micro-hardness were very close, in this way both results were satisfactorily verified, as may be conferred in Table 3, therefore, both results of micro-hardness are similar.
To respect to the work of numerical simulation by finite elements of the indentation, several authors have studied, among them [8], remarket that with the advent of powerful finite element analysis programs, it is imperative to simulate nano-indentation process. When the response of the specimen is elastic only, the elastic stress field at the contact region is well-defined regardless of the type of indenter. Still these authors maintain, for elastic-plastic or viscoelastic response it becomes extremely difficult to obtain stress fields around contact area especially when the indenter is Vickers. This is due to 3-dimentional phenomenon associated with large plastic strains, as describe by [9] and these authors pointed out, which nano-indentation with Vickers is one of the most complex contact problems.
In this case, finite element method is considered as valid candidate to have stress distribution and displacement plot during loading and unloading processes, that the validation of the experimental and simulation results are well consistent. Meanwhile, to have a viable result of numerical simulation, it depends on many factors, among them, physical properties of the materials, boundary conditions, mathematical modeling considering that the material has elastic-plastic behavior, mesh type and the software.
6 Conclusion
In the LSR-treated Al-2.0 wt.% Fe alloy were investigated the microstructure using the FEG and EDS techniques, at the laser beam scanning, 80, 100, 120 mm/s, also validation experimental and numerical simulation by FEM of micro-hardness in the areas of treated and untreated layers were performed in this work.
The micrography in the untreated region has a lamellar characteristic structure, in it there is the presence of intermetallic Al 13 Fe 4, which is predicted in the equilibrium diagram;
In the treated surface was generated the formation of a thin remelting layered, with refined microstructure, in the molten pool zone the nano-structured has the columnar dendritic growth characteristics and nano-porosities between columnar growth characteristics appear in low laser beam scanning;
For the highest laser beam scanning, the result presented columnar dendritic growth characteristics a lot more compact or fine-grained microstructure than in low laser beam scanning;
In relation to the molten pool geometry, the width has a linear decreasing behavior, nevertheless, the depth, also has a tendency of decrease due to increase of the laser beam scanning speed and this fact is related to the heat transfer magnitude;
The average of the rounded structure had a decreasing linear behavior with the increase of the laser beam scanning;
In the treated region, micro-hardness results are quite similar and have a linear behavior in different laser beam scanning. However, the microhardness of the treated region is much higher than of the untreated region. For micro-hardness measurements and numerical simulation in different laser beam scanning, the validation of results were well consistent.

