


 English (pdf)
 Article in xml format
 Article references
 Send this article by e-mail
 Cited by SciELO
  Cited by Google
  Similars in
SciELO
Similars in
SciELO  Similars in Google
 Permalink
1 Introduction
The critical point is a thermodynamical state that represents the end of the coexistence line between different phases. At the vapor-liquid equilibrium, the difference in density between the liquid and vapor becomes zero at the critical point, the meniscus between the two phases disappears, latent heat of vaporization goes to zero, the refraction index is the same for both phases, and the interfacial tension is zero. The critical point establishes the coordinates of the critical temperature, critical pressure, and critical volume, which define one of the essential physicochemical parameters, the critical compressibility factor Z c.
where P c is the critical pressure, V c is the critical molar volume, T c is the critical temperature, and R is the gas constant. The principle of corresponding states expects a unique and constant value of Z c for all substances, and van der Waals in his famous doctoral thesis predicts a universal value of Z c, being Z c = 3/8. However, it is widely known that Z c is not constant and, furthermore, the critical data shows that the value of Z c is rather far from the prediction of 3/8. In general, equations of state fail to predict the critical properties, and the use of critical exponents to describe changes of density, surface tension, heat of vaporization is a widely employed tool. Guggenheim in his seminal work [1] pointed out the universality of critical exponents.
In the time lapse between van der Waals doctoral thesis in 1873 [2] and his lecture of the physics Nobel Prize in 1910, there was an increased number of critical measured data. Sydney Young [3] provided one of the first high-quality critical data series, and van der Waals refers to them in order to correct the value of Z c:
“Sydney Young determines inter alia the value of PV/RT at the critical point and finds 1/3.77. If P and T have the same values as in my theory, providing b is imagined to be constant, the difference from 3/8, the value which I found for PV/RT , can be ascribed wholly to the volume. And this, we can say, is entirely correct. The critical volume is not 3b... ...And the product PV/RT is not 3/8 but
 [4].
[4].
As van der Waals himself adverts, the insufficiency of his equation evaluating the critical volume promotes the search for equations able to calculate the critical volume.
The construction of theories and models able to describe thermodynamical properties near the critical region is an ongoing field. Velasco et al. [5] represent the critical behavior with a theory of renormalization of groups and warn that consistency problems arise from the vapor pressure and propose an equation to describe the critical point. Li et al. [6] proposed a correlation for the prediction of critical properties for 16 homologous families using molecular descriptors and focused on the critical temperature. Mersmann and Kind [7] can predict among other properties the critical molar volume proposing a correlation based on the corresponding states principle, using the atomic radii and an empirical factor for several homologous series with an acceptable error.
Several semiempirical correlations are based on the relations between critical properties, according to the principle of corresponding states. Correlations near the critical point predict the behavior of substances at conditions where experimental data is scarce, and they are useful to assert the quality of existing data. The critical temperature and pressure are intensive variables and they are easier to obtain than the critical volume, due to the strong fluctuations in density near the critical point, therefore the need of correlations able to predict the critical volume. Cailletet and Mathias were pioneers determining the critical density of several substances successfully. Together, Cailletet and Mathias developed an apparatus that allowed them to measure the density of saturated vapor and liquid phases. They have observed that the density linearly decreases for both phases when approaching the critical point. Consequently, they have enunciated the law of rectilinear diameters [8], an analytical function still valid and used as a comparison for other methods.
Ihmels [9] published selected data, which are presented in critical coordinates of temperature, volume and pressure. Ihmels found a random surface and noticed that when the volume is replaced by the molar volume, the data can be contained in a sail-like surface. Ihmels uses the critical data to qualify the empirical correlations of Young (Equation (2)] [3], Meissner-Redding (Equation (3)] [10], Bird (Equation (4)] [11], and Grigoras (Equation (5)] [12]. Ihmels proposes an optimized expression (Equation (6)] [9]
where V c is the critical molar volume measured in cm3/mol, T c is the critical temperature measured in K, P c is the critical pressure measured in MPa, and R is the ideal gas constant R =8.3144598 MPa cm3/mol K [13]. The constant with a value of 8 in Equation (3) has units of molar volume (cm3/mol). The constants 2.08, 2.02, 2.17 and 2.215 in Equations (3) to (6) have units of MPa cm3/mol K. In Equations (4) to (6), the constants 0.29, -0.29 and 0.0025 have units of pressure (MPa).
In this article we demonstrate that the above empirical equations, published in the literature since 1899 [3],[14],[15],[16] and of current use for the estimation of critical constants, are naturally derived from the van der Waals equation of state at the critical condition.
2 The van der Waals equation at the critical condition
Johannes Diderik van der Waals proposed in 1873 [2] the famous equation of state that provides an adequate approach of phase coexistence and its relation to the critical point. Despite the lack of accuracy on representing the thermodynamical properties in the vicinity of the critical point, the van der Waals equation describes qualitatively gas behavior, liquid-vapor transition, the liquid phase, as well as that of stable states, metastable states, and the critical point. The usual form of the van der Waals equation of state reads:
where V 0 is a parameter that has units of molar volume, initially associated with the concept of a covolume. However, V 0 is negative at low temperatures and changes sign at high temperatures, therefore it cannot be interpreted as the volume occupied by the molecules [17].
The van der Waals equation at the critical condition is given by
The critical condition, in terms of the principle of continuity of the gaseous and liquid phases, can be written as:
Expanding Equation (9)

The usual cubic structure of the van der Waals equation is [18]
Equating the coefficients for the quadratic term V 2 in Equations (10) and (11)
From the coefficients for the linear term V in Equations (10) and (11)
Substituing α = 3P c V c 2 in Equation (8) gives
Equation (15) explicit in the critical volume is
All these expressions are equally valid in the van der Waals context. Neglecting V c = 3V 0, as van der Waals did in his Nobel Prize lecture [4] leaves two proposals for the relation V c vs. T c /P c, Equations (13) and (16). Experimental data shows that Equation (16) is consistent as shown in section 3.2 Critical properties of homologous series and therefore the term α = 3P c V c 2 is appropriate and quantitative at the critical point. The intercept that substitutes V c = 3V 0 is interpreted in the section 3.3 The meaning and content of V 0.
Equation (16) constitutes the fundamental expression to demonstrate that the previously discussed empirical correlations are a consequence of the van der Waals equation. The next section contains a comparison with each of the proposed correlations and the relation with the expressions of the critical compressibility factor.
3 Results
3.1 The empirical correlations
The volume-explicit expressions of Young (Equation (2)] and Meissner - Redding (Equation (3)] are obtained from Equation (16). When V 0 approaches zero, Equation (16) takes the form of the empirical correlation of Young (Equation (2)]
where R/4 is 5% lower than the empirical term R/3.77 suggested by Young.
The Meissner-Redding correlation (Equation (3)] is generated by Equation (16) with R =8.3144598 MPa cm3/ mol K. Note that R/4 in Equation (16) equals 2.0785, 2.08 in equation of Meissner-Redding (3), and the only adjustable parameter is V 0
The volume-explicit expressions of Bird (Equation (4)], Grigoras (Equation (5)] and Ihmels (Equation (6)] are obtained from Equation (16) when V 0 = 0 and R =8.3144598 MPa cm3/ mol K, therefore R/4 = 2.0785 MPa cm3/ mol K. The structure of equations (4), (5) and (6) is similar, the variation of their constants reflect the increasing available critical data. According to the critical properties selected by Ihmels, Equation (6) best fits the majority of critical data. Nevertheless, P c >> 0.025, i.e., the pressure-related constant does not represent a significant adjustment to the critical properties, so these expressions can be written as
The slope R/4 = 2.0785 MPa cm3/ mol K,substitutes the empirical slopes of 2.02 in Bird’s Equation (4), 2.17 of Grigoras (5) and 2.186 of Ihmels (6).
3.2 Critical properties of homologous series
The critical properties of homologous series of organic compounds and some elements were tested under Equation (16), the results are shown in Figure 1. The obtained slope corresponds to the term R/4. If R =8.3144598 MPa cm3/ mol K, then R/4 =2.0785. The slope remains practically constant for the tested families and in agreement with the expected R/4 value (2.065 ± 0.093) and the intercept V 0 is the only fitting parameter. The reported error is obtained by the quotient σ/n, where σ is the standard deviation and n the number of data.
Figures 1a and 1b show the variable T c /P c as a function of V c for the n-alkanes and n-alkenes, respectively. Both homologous series show a linear behavior and obey Equation (23). The slope R/4 is reached, being 2.10 for the alkanes, and 2.03 for alkenes. The fitting parameter V 0 equals 18 for the n-alkanes and 32 for n-alkenes.
The value of V 0 predicted for the alcohols [Figure 1c) is negative, as well as in the carboxylic acids [Figure 1d). Water has been included as a reference for both series. These two series represent hydrogen bonds-forming molecules, leading to an increase in the intermolecular interactions, therefore when V 0 is negative and represents the dominance of attractive interactions. For the carboxylic acids, V 0 is approximately twice the value than that of the alcohols, fact that can be interpreted as the increment of the hydrogen bond provided by the O-OH group present in the acids, that forms double the bonds than the OH group in the alcohols. Figure 1f contains the linear regression for elements. An analysis with confidence bands (0.999) shows that the intercept withholds no significance to the linear regression.
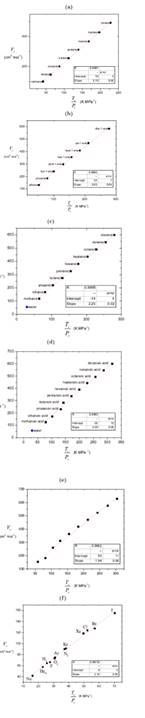
Figure 1 Critical volume V c as a function of the ratio T c /P c for homologous series and some elements, Equation (16) with adjustable slope and intercept. (a) C1-C8 n-alkanes (b) C2-C10 n-alkenes (c) C1-C10 n-alcohols (d) C1-C10 carboxylic acids (e) C1-C10 primary n-amines (f) Elements. Data acquired from Yaws [19] Water added as reference.
3.3 The meaning and content of V o
As it is expected, the critical molar volume in a homologous series shows a linear increment with the increment in carbon units, so the corresponding slope represents an additive and constitutive property. For example, in the alcohols homologous series:

where V c ∗ represents the intercept and m 1 the corresponding slope or contribution for each -CH2- group added to the molecule. The same behavior occurs with the quotient T c /P c; for the alcohols:
(T c /P c)∗ is the intercept and m 2 is the slope. The relation between both slopes is
The difference of the Equation (21) and (22) with R/4 times the Equation (22), is
that corresponds to the fundamental Equation (16). The same result is obtained by substracting the term m 1 n c in both sides of Equation (16). V c ∗and (T c /P c)* represents the non-hydrocarbon group contribution to each property (the hydrofilic portion for alcohols and carboxylic acids) of the molecule, its difference (Equation (24)] represents the value and sign of V 0 in Equation (16).
The evident linear relationship between T c /P c and V c with respect to the number of carbon atoms n c in a homologous series, as shown in Figure 2, allows the extrapolation for the estimation of critical properties. Note that the slope in V c is practically double the slope in T c /P c.
Figure 2 (a) V c and (b) T c /P c as a function of the number of carbon atoms in n-alcohols series. [19]
The critical molar volume of a missing member in a homologous series can be predicted interpolating or extrapolating Equation (16). This represents a major advantage since the direct measurement of molar volume is very difficult due to the fact that, near the critical region, small changes in pressure produce large changes in density. The determination of critical molar volumes by this method constitutes a simple and convenient alternative to the experimental evaluation and the law of rectilinear diameter proposed by Cailletet and Mathias [8].
Equation (16) is useful when it is necessary to extrapolate or interpolate critical constants of compounds. Clear examples of compounds with few or no experimental data at critical conditions are polymers, proteins, surfactants and ionic liquids, due to the low vapor pressures and the high temperatures needed to reach the critical point [20].
The Equation (16) can lose sensibility when the values of critical constants are too close to each other, as in the case of isomers of hydrocarbons. In order to obtain an expression able to represent such families, the Equation (16) can be expressed as a function of the critical compressibility factor Z c
The proposed correlation is generalized by Equation (27) as a function of the critical molar volume V c and the critical compressibility factor Z c note that matches Equation (24). The critical compressibility factor usually ranges between 0.23 and 0.31 for most pure liquids [21]. Figure 3 shows the parameter V 0 as a function of the inverse critical compressibility factor Z c according to Equation (27) for different series, where the critical properties are too similar.
According to Equation (27), when the critical compressibility factor tends to 0.25, V 0 tends to zero. If Z c is lesser than 0.25, V 0 < 0 and in the case of Z c being greater than 0.25, V 0 > 0. When Z c takes the classical van der Waals value of 3/8, the critical molar volume is V c = 3V 0
Z c = 0.25 ⇒ V 0 = 0
Z c > 0.25 ⇒ V 0 > 0
Z c < 0.25 ⇒ V 0 < 0
Figure 3 The parameter V0 as a function of the critical compressibility factor Z c for isomers, Equation (27) (a) Hexane (b) Heptane (c) Octane (d) Decane. Data acquired from Yaws [19]
Figure 4 shows an example of halide compounds with Z c close to 0.25. Note that the intercept is fixed to zero, the slope is equivalent to R/4, and the correlation coefficient is close to 1.
Figure 4 Critical volume V c as a function of the ratio T c /P c for halide compounds with Z c close to 0.25, Equation (16)with adjustable slope and intercept fixed to zero.
Equation (16) can be written as:
where Z 0 = P c V 0 /RT c is called pseudo compressibility factor. Equation (28) constitutes a function to represent the compressibility factor of homologous series. Concerning the values of V 0 and α van der Waals stated that he “never expected this equation, with a and b assigned a constant value, to give results numerically in agreement with experiment and yet people almost always act as though that were my opinion. This astonishes me as in my treatise of 1873 not only did I expressly emphasize the variability of b but also quoted a series of b-values from Andrews’ experiment in which for small volumes the change in b with the volume is calculated.” [4]
4 Conclusions
The van der Waals equation at the critical condition is reduced to a linear equation with one fitting parameter V 0. The critical constants correlation is valid for van der Waals fluids. This linear function represents different homologous series and groups of substances with similar molecular interactions when it is expressed in V c vs. T c /P c coordinates. The exposed method constitutes a convenient tool for the quality assessment of experimental data and theoretical predictions near the critical region.
The critical correlation from van der Waals equation defines a function for the compressibility factor, according to the principle of corresponding states where Z 0 is a pseudo-compressibility factor. The equation explicit in the critical molar volume (Equation (16)] is a more convenient expression than the version explicit in the compressibility coefficient (Equation (28)] since it avoids the propagation of errors created by the product and quotient of the critical constants.
The critical correlation from van der Waals equation entails and improves the Young, Meissner, Bird, Grigoras and Ihmels empirical equations, commonly used in the correlation of critical properties frequently cited in textbooks and handbooks. Several empirical expressions that relate critical constants are naturally contained and based on the van der Waals equation at the critical condition.

