Ciencias agrarias
Applying satellite images to spectral signature development of maize production (Zea mays L. under Colombia's middle tropics conditions*
Aplicación de imágenes satelitales para el desarrollo de una firma espectral en la producción de maíz (Zea mays L. bajo las condiciones de trópico medio colombiano
Aplicação de imagens de satélite para o desenvolvimento de uma assinatura espectral na produção de milho sob condições do trópico médio colombiano
Edier Fernando Ávila-Vélez**
Natalia Escobar-Escobar***
Carlos Francisco Morantes-Choconta****
** Director del Programa Tecnología en Cartografía en la Universidad de Cundinamarca, Fusagasugá Colombia. efernandoavila@ucundinamarca.edu.co, edierf@hotmail.com ID: https://orcid.org/0000-0002-8997-9125.
*** Docente Investigador. Universidad de Cundinamarca. nataliaescobar@ucundinamarca.edu.co ID: https://orcid.org/0000-0002-2206-1432.
**** Docente de tiempo completo Facultad de Ciencias Agropecuarias en la Universidad de Cundinamarca ingenieria.cfm@gmail.com ID: https://orcid.org/0000-0003-4358-3448.
Abstract
Maize is currently the world's second largest crop in terms of production, after wheat and rice. It is the first cereal as for grain yield per hectare and the second, after wheat, regarding total production. Maize has great economic importance worldwide, both as human and/ or animal food, and as a source of a large number of industrial products. New digital technologies are allowing greater monitoring of farming production stages. This research developed the spectral signature of maize fields ground covers across different growth stages (2 months, 2.3 months and 4.3 months). Similarly this research paper proposes the application of a methodology based on four phases: 1. Maize crop georeferencing, 2. Satellite images selection, 3. Radiometric calibration of images 4. Spectral signature development of maize crops. Spectral response or signature of maize crops at visible and near-infrared wavelengths was obtained, indicating significant changes in crops growth. The use of satellite imagery becomes an interesting tool that introduces an approach towards more accurate and controlled monitoring systems in agricultural production.
Keywords: Energy; agriculture; cultivation; agricultural technology
Resumen
El maíz es actualmente el segundo cultivo más grande del mundo en términos de producción, después del trigo y el arroz. Es el primer cereal en cuanto al rendimiento de grano por hectárea y el segundo, después del trigo, con respecto a la producción total. El maíz tiene una gran importancia económica en todo el mundo, tanto como alimento humano y/o animal, como fuente de una gran cantidad de productos industriales. Las nuevas tecnologías digitales están permitiendo un mayor seguimiento de las etapas de producción agrícola. Esta investigación desarrolló la firma espectral de los cultivos de maíz en diferentes etapas de crecimiento (2 meses, 2,3 meses y 4,3 meses). De manera similar, este trabajo de investigación propone la aplicación de una metodología basada en cuatro fases: 1. Georreferenciación de cultivos de maíz, 2. Selección de imágenes satelitales, 3. Calibración radiométrica de imágenes, 4. Desarrollo de firmas espectrales de cultivos de maíz. Se obtuvo una respuesta espectral o firma de cultivos de maíz en longitudes de onda del visible e infrarrojos cercanos, lo que indica cambios significativos en el crecimiento de los cultivos. El uso de imágenes satelitales se convierte en una herramienta interesante que introduce un enfoque hacia sistemas de monitoreo más precisos y controlados en la producción agrícola.
Palabras Clave: Energía; agricultura; cultivo; tecnología agrícola
Resumo
O milho é atualmente a segunda maior safra em termo de produção, depois de trigo e arroz. É o primeiro cereal em termos de rendimento de grãos por hectare e o segundo, após o trigo, em relação a produção total. O milho é de grande importância econômica em todo o mundo, tanto como alimento humano e/ou animal, como fonte de muitos produtos industriais. As novas tecnologias digitais estão permitindo um maior monitoramento das etapas de produção agrícola. Esta pesquisa desenvolveu a assinatura espectral de plantios de milho em diferentes estágios de crescimento (2 meses, 2,3 meses e 4,3 meses). Da mesma forma, este trabalho de pesquisa propõe a aplicação de uma metodologia baseada em quatro fases: 1. Georreferenciamento de plantios de milho. 2. Seleção de imagens de satélite, 3. Calibração radiométrica de imagens, 4. Desenvolvimento de assinaturas espectrais de plantios de milho. Foi obtida uma resposta espectral ou assinatura de plantios de milho em comprimentos de onda visível e infravermelho próximos, indicando mudanças significativas no crescimento dos plantios. O uso de imagens de satélite torna-se uma ferramenta interessante que introduz uma abordagem para sistemas de monitoramento mais precisos e controlados na produção agrícola.
Palavras-Chave: Energia; agricultura; cultivo; tecnologia agrícola
Introduction
The food crisis has caused problems in world production, which have resulted in increased prices, and profits going to an exclusive group of business owners and transnational corporations in the food sector. The same crisis has created uncertainty in food supply, causing a decline in world exports and a reduction in food production (Rubio, 2011). Maize (Zea mays L.) holds a prominent position in Latin American agriculture, as it is intended for human and animal consumption. In recent years, its use as a biofuel has increased. Today, it is one of the most widely grown cereals in the world (Hernández & Soto, 2012). Maize is a cereal that belongs to the Gramineae or Poaceae family, whose taxonomic description corresponds to a monocotyledonous species of annual growth and a very broad vegetative cycle (Grande y Orozco, 2013).
Remote sensing images provide an invaluable source of data for detecting and monitoring changes have a given phenomenon or environmental variable in time and space (Riaño, 2002). Remote sensing is necessary to monitor objects dynamics in space and time, such as photosynthetic activity, leaf moisture content or water stress. This research aimed at developing a spectral response of "Zea mays" (maize) crops, across its multiple growth phases, using satellite spectroradiometry, by calculating the spectral response at visible and near-infrared wavelengths.
This research has been part of the launching of the project "Control strategies for the retamo spiny (Ulex europaeus L) in the municipalities of Sibate, Soacha and Pasca", that were characterizing this invasive plant, with the productive processes in the area, especially with the corn, coffee and potatoes crops, based on spectroradiometry with satellite images, by this way, it was possible to see the behavior and growth of corn, satellite images are included in different wavelengths, in order to evaluate the growth and development rates of the corn plants.
1. Methodology
1.1. Study Area
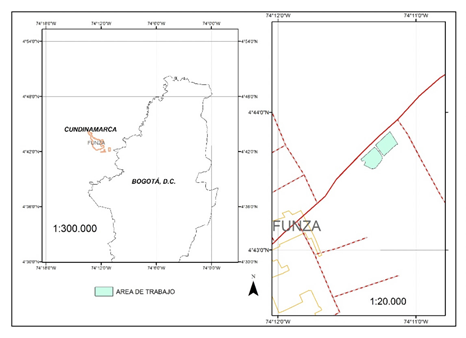
The study area where maize fields were located is 1,1 km from the municipality of Funza, Department of Cundinamarca, Colombia. Approximate coordinates are: longitude 74°M'0" West and latitude 4°43'40" North (Figure 1). The area has a slope of about 1%, altitude is nearly 2,548 m.a.s.l., average temperature is 14° C, cover area is approximately 9.5 ha, where pure pixels can be obtained, i.e., pixel content belongs only to a particular cover, in this case, maize crops.
The data used in this research contained satellite images provided by Sentinel-21 MSI2, with sun-synchronous orbit, and a shooting height of approximately 785 km, which have a spatial resolution of 10, 20, and 60 meters, and a spectral resolution of 13 bands, including visible, near-infrared, and short-wave infrared3. The first scene corresponds to an image dated 09-16-2016, which was called (Tl), the second scene, (T2), was from 10-16-2016, and the third scene, (T3), was from 12-15-2016.
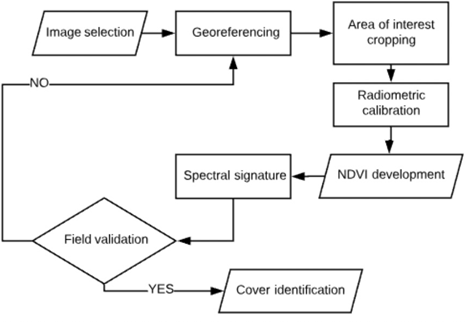
Figure 2 shows the methodology used to develop spectral signature of maize crops across some growth stages; first, there was a selection of cultivated areas in Madrid, Cundinamarca, where crops were georeferenced with GNSS devices. By then, the shot was two months old (60 days after sowing). Then a first Sentinel-2 satellite image (Tl) was downloaded; after 30 days, second and third satellite images (T2) and (T3) were downloaded. The georeferenced crop was located in these images. During a third phase, radio-metric correction of satellite images was performed to obtain the reflectance energy of the cover under study (Ariza, 20l3), translating digital data into physical measurements in order to create a good approach to the temporal spectral signature of maize crops scenes in T1, T2 and T3 satellite imagery. Finally, radiometric reflectance values were plotted.
2. Results
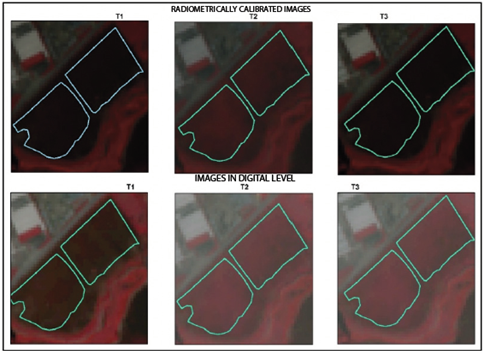
Information about maize fields under study was obtained through physical reflectance measurements, which minimize values influenced by the energy scattered across the atmosphere or Rayleigh scattering4, depending on the different wavelengths, in this case visible and near-infrared waves that comprise the crop. According to Figure 3, the first row includes radiometrically-calibrated images, and the second row shows images in digital level format.
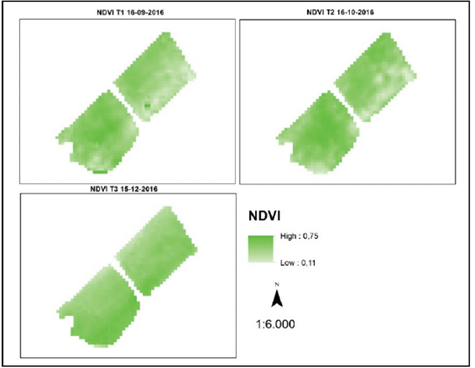
According to the radiometric index; biomass content in crops is shown here, where values of zero (0) show minimum contents while values of one show high contents (Figure 4) (Vaughan P., 2001)
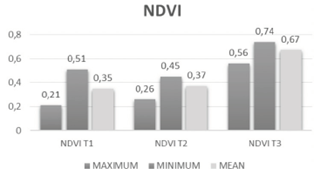
Minimum, maximum and mean values for variable NDVI were obtained from raster algebra, where a high value of 0.67 is observed for image T3, indicating a maize crop bio-mass in good condition and a homogeneous phytosanitary status, according to Table 1.
Table 1 Measures of central tendency and scattering for NDVI
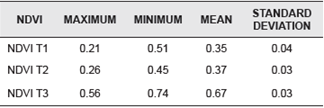
Source: Authors
As observed in Figure 5, particularly values of image T3, the mean value of variable NDVI is almost equal to the maximum value, therefore, it can be inferred that the crop has constant values for the reflectance value and the absorbance in red and near-infrared wavelength.
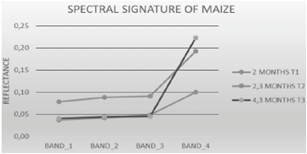
Pixel values were removed and added to a database that included images T1, T2, and T3; the spectral signature (Figure 8) was obtained from the data in Table 2 of maize crops across different times: 2 months, 2.3 months and 4.3 months. Large changes in spectral response for _4 near- infrared band were observed. Standard deviation of data is minimal since pure pixels were georeferenced in the field, ensuring minimum variation.
Table 2 Summary of measures of central tendency and wavelength scattering
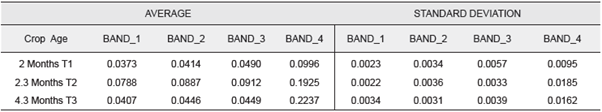
Source: Authors
3. Discussion
Wavelength reflectance data when developing spectral signature of maize crops (Zea maize L.) across different growth stages is strongly influenced by crop's internal and external aspects; since reflectance is a characteristic of the medium, said characteristic is the basis of substance recognition. Just like radiance, reflectance also depends on wavelength, (Alonso, Moreno & Rodriguez, 1999). Based on the above, it can be said that the maximum slope of the line connecting red and infrared wavelength data corresponds to the 4.3-month crop, i.e., T3, which represents 17.9%. Consequently, geographical objects have radiometric differences (Chuvieco, 2002), that allow us to identify such objects on an image made up by the product of the remote capture of the signal emitted by each object (Corrales, 2011).
By applying images digital processing techniques to satellite spectroscopy it is possible to "Differentiate diverse covers present on the Earth's surface such as glaciers, volcanoes, vegetation, soils, water, types of rock outcrops, etc.", (LoVecchio, Lenzano, Richiano, & Lenzano, 2016). Based on those techniques a spectral response of maize crops is generated, giving the possibility to calculate areas of the same variety and time. This is an automated process (Galindo, et al. 2014).
According to Figure 6, a lower spectral slope in the red and near-infrared bands is observed, which may indicate that when implementing methods for extracting parameter REP (Network Edge Position), which indicates physiological and phenological changes of any plant species and satellite image spectroscopy (Ángel, 2012), phytosanitary status of different crops can be validated, since spectral response of the cover would be dramatically affected by this parameter.
If drainage is good (no water saturation), maize grows well in several soils. It has a deep root system (up to 185 cm) and benefits from deep soils that allow water storage during droughts. Optimal pH value for maize ranges between 5.5 and 7.5, although some tropical soils produce good crops with a pH value of 5.0 (Cepeda & Pardo, 2011). Crop yield is given by the ability to accumulate biomass (fresh and dry matter) in the organs intended for the harvest, and a proportional increase in biomass intended for these organs ensures an increase in yield. Thus, the distribution of dry matter among different organs of the plant plays a key role in crop production. Crop productivity is determined by its genetic potential and the environmental impact on its ability to grow and allocate dry matter to reproduction purposes; on the other hand, changes on maize sowing date modify grain yield response. The biomass produced by each individual reflects resources availability throughout the growing season and it is associated with yield (Hernández & Soto, 2012).
According to the results obtained from the spectral signature, some changes in the cover were identified. There are several variables that can have an impact in this regard; for example, temperature is one of the main driving forces in crops growth and development, and it also plays an important role in several phenological stages (Parra, Fischer, Chaves, 2015). Some plants are susceptible to high temperatures in early phenological phases and can later resist high temperatures; others stop certain functions because they are under low temperatures (Granados, Sarabia, 2013). Phenology studies the temporal sequence of the different periodic phases of plants and their relationship with climate and weather conditions; phases such as: appearance of the first leaves, flowering, fruit ripening, etc., are related to the prevailing temperature conditions and the appropriate amount of rainfall (Granados, Sarabia, 2013; Escobar, Mora & Romero, 2013). All these changes are affected by local environmental conditions. The beginning and end of phenological stages are good indicators of crops potential growth, which can be largely diagnosed by spectral signature.
4. Conclusions
By developing a temporal spectral signature of a crop, areas can be calculated to forecast crop volumes or create early warnings based on the level of crop reflectance for a given season, thus allowing for integrated responses of fast and efficient action during agricultural production.
References
1. ALONSO, Carmelo; MORENO, Victoriano y RODRÍGUEZ, Elías. Determinación experimental de la firma espectral de la vegetación. una sencilla práctica de introducción a la teledetección. en: teledetección. avances y aplicaciones. En: Memorias VIII Congreso Nacional de Teledetección. p. 429-432. Recuperado de http://www.aet.org.es/congresos/viii/alb99.pdf.
[ Links ]
2. ÁNGEL LÓPEZ, Yoseline Betzaida. (2012). Metodología para identificar cultivos de coca mediante análisis de parámetros red edge y espectroscopia de imágenes. (Tesis Maestría en Geomántica). Universidad Nacional de Colombia. Bogotá. Recuperado de http://www.bdigital.unal.edu.co/7566/1/7795080.2012.pdf.
[ Links ]
3. ARIZA, Alexander. Descripción y Corrección de Productos Landsat & LDCM [Landsat Data Continiuty Mission]. Bogotá: Centro de Investigación y Desarrollo en Información Geografica IGAC. 2013. 46 p. Disponible en: http://www.un-spider.org/sites/default/files/LDCM-L8.R1.pdf.
[ Links ]
4. CEPEDA, A.; PARDO, A. Evaluación del efecto de abonos obtenidos de residuos orgánicos de fincas cafeteras, sobre el crecimiento y producción de maíz (zea mays) y frijol (phaseolus vulgaris) en la región del Sumapáz Cundinamarca. Trabajo de grado Universidad de Cundinamarca., 2011.
[ Links ]
5. CHUVIECO SALINERO, Emilio. Teledetección ambiental: la observación de la tierra desde el espacio. Barcelona, España: Ariel Ciencia. 2002. 586 p. Disponible en: https://drive.google.com/file/d/0B0KUmy_fthbuX09sUE9RejJJX1U/view.
[ Links ]
6. CORRALES ANDINO, Rafael Enrique. Catálogo de Firmas Espectrales de Especies Florales, en la Ciudad Universitaria, Tegucigalpa, fase 1. Honduras. Universidad Nacional Autonoma de Honduras. Tegucigalpa, 2011. p. 1-12. Recuperado de https://lamjol.info/index.php/CE/article/view/610/435.
[ Links ]
7. ESCOBAR ESCOBAR, Natalia; MORA DELGADO, Jairo y ROMERO JOLA, Néstor. Respuesta agronómica de zea mays l. y phaseolus vulgaris l. a la fertilización con compost. EN; Luna Azul [online]. 2013, n. 37, p.18-29. ISSN 1909-2474. Disponible en: http://www.scielo.org.co/scielo.php?pid=S1909-24742013000200003&script=sci_abstract&tlng=es.
[ Links ]
8. GALINDO, Gustavo. Protocolo de procesamiento digital de imágenes para la cuantificación de la deforestación en Colombia, Volumen 2. Bogotá D.C.: Instituto de hidrología, meteorología y estudios ambientales IDEAM. 2014. 52 p. Recuperado de https://redd.unfccc.int/files/anexo_a_protocolo_procesamiento_digital.pdf.
[ Links ]
9. GRANADOS, Rebeca. Cambio climático y efectos en la fenología del maíz en el DDR. En: Revista mexicana de ciencias agrícolas. Mayo, 2013. vol. 4. no. 3. p. 435-446. Recuperado de http://www.scielo.org.mx/scielo.php?script=sci_abstract&pid=S2007-09342013000300008&lng=es&nrm=iso.
[ Links ]
10. GRANDE TOVAR, Carlos David; OROZCO COLONIA, Brigitte Sthepani. Producción y procesamiento del maíz en Colombia. En: Revista Científica Guillermo de Ockham. 2013. vol. 11. no. 1. p. 97- 100. Disponible en https://doi.org/10.21500/22563202.604.
[ Links ]
11. HERNÁNDEZ CÓDOBA, Naivy; SOTO CARREÑO, Francisco. Influencia de tres fechas de siembra sobre el crecimiento y rendimiento de especies de cereales cultivados en condiciones tropicales Parte I. Cultivo del maíz (Zea mays L.) En: Cultivos Tropicales. Abril -Junio, 2012. Vol. 33. no. 2. p. 44-49. Recuperado de http://scielo.sld.cu/pdf/ctr/v33n2/ctr06212.pdf.
[ Links ]
12. LO VECCHIO, A.; LENZANO, M.; RICHIANO, S. & LENZANO, L. Lithologic identification and characterization using ETM+ (Landsat 7). Study case of the Upsala glacier basin, Argentine. In: Revista de Teledetección. June 2016. n. 46, p. 57-72. ISSN 1988-8740. Available at: <https://polipapers.upv.es/index.php/raet/article/view/4482>. https://doi.org/10.4995/raet.2016.4482.
[ Links ]
13. PARRA-CORONADO, Alfonso; FISCHER, Gerhard y CHAVES-CÓRDOBA, Bernardo. Tiempo térmico para estados fenológicos reproductivos de la feijoa (Acca sellowiana (O.Berg) Burret). En: Acta Biológica Colombiana. 2015. vol. 20. no. 1. p. 167-177. Disponible en http://www.scielo.org.co/scielo.php?script=sci_abstract&pid=S0120-548X2015000100017.
[ Links ]
14. RIAÑO, Orlando. Consideraciones y métodos para detección de cambios empleando imágenes de satélite en el municipio de Paipa. En: Colombia Forestal. 2002. Vol.7 no. 15. p. 41-62 Obtenido de: https://revistas.udistrital.edu.co/index.php/colfor/article/view/3306/4808.
[ Links ]
15. RUBIO-VEGA, Blanca Aurora. Crisis mundial y soberanía alimentaria en América Latina. En: Revista de Economía Mundial. 2011. vol. 29. p. 59-85. Disponible en http://www.sem-wes.org/es/node/416.
[ Links ]
16. VAUGHAN, Patrick. Estimación de contenido de humedad de la vegetación mediante espectro-radiometría. Teledetección, avances y aplicaciones. Alcalá de Henares, España: Universidad de Alcalá. 2001. 105 p. http://www.investigacion.cchs.csic.es/espectroradiometria/sites/investigacion.cchs.csic.es.espectroradiometria/files/files/uploads/TESINA_VAUGHAN%20P_2001_0.pdf.
[ Links ]


 English (pdf)
 Article in xml format
 Article references
 Send this article by e-mail
 Cited by SciELO
  Cited by Google
  Similars in
SciELO
Similars in
SciELO  Similars in Google
 Permalink