


 English (pdf)
 Article in xml format
 Article references
 Send this article by e-mail
 Cited by SciELO
  Cited by Google
  Similars in
SciELO
Similars in
SciELO  Similars in Google
 Permalink
1. Introducción
The peach (Prunus pérsica) is a perennial tree native to northwest China extensively grown in both hemispheres and ranks as the third most important temperate fruit. China, to this day, is the largest peach producer with 62% of world production followed by Italy (4.4%), Spain (3.69%) and the United States (2.86%). It was first introduced into Latin America in the fifteenth century of which Chile (319M tons), Argentina (226M tons) and Brazil (219M tons) together account for 2% of global production (Food and Agriculture Organization, 2020).
In Colombia, peaches are grown at altitudes of 1,800 to 2,800 meters above sea level and in the last two decades, cultivated area and output production have shown an increasing trend reaching 2M hectares and 34M tons, respectively. Peach plantations are concentrated mainly in the departments of Boyacá (41%), North of Santander (28.6%), Santander (12.5%) and Huila (11.5%). Undoubtedly, it has an important place in the Colombian fruit sector, as it is the main source of income for smallholder farmers and hired workers as it is a labor-intensive crop (Agronet, 2020; Villamizar and Fernandez, 2015).
Peach production is mainly traded in distant markets that leads to an increase in post-harvest costs, and supply responsiveness is highly influenced by short and long-term decisions such as market price, input applications, acreage allocation and investment levels. In addition, time lag plays an important role due to the period between initial input and first output; thus, changes in market conditions raise many challenges for smallholder farmers (Laajimi, Guesmi, Mahfoudhi, Dhehibi, 2009).
In view of the above, the analysis of supply response is critical to resource allocation and planting decision. Therefore, understanding how peach production responds to price and non-price factors is important, as it will help smallholder farmers to determine the effects of input shortages and price changes as well as the impact of government policies. Whilst there are various studies on the agricultural and the biological aspects of peach production, supply response analysis receives very little attention in the literature, thus this is the first study in Colombia. In this manner, given that, the underlying aim of the present study was to estimate the peach output supply response to own-price and yield, the Johansen's co-integration analysis and Vector Error Correction Model (VECM) were used to capture the short and long run dynamics between time series, as it is useful in overcoming the problems of spurious regression in supply response function.
The present paper is structured as follows. After the introduction, the theoretical framework and the literature review are presented. The fourth section describes the methodological approach that includes the model specification, the data and variables used and the performed tests. The fifth section includes the empirical results whilst the final two sections discusses the results and summarizes the major findings.
2. Theoretical framework
The supply response analysis is anchored on the neoclassical microeconomic theory of the firm that states that the overall purpose of a company is to achieve maximum economic profit by making "the difference between its total revenues and its total economic costs as large as possible" (Nicholson and Snyder, 2008 p. 369). Therefore, under perfect market conditions a profit-maximizing firm will choose its output level for which marginal cost is equal to the marginal revenue. Furthermore, as producers are price takers the profit maximizing level of production also equates the marginal cost to the market price. Hence, in the short-run the firms supply function is the positively slopped portion of the short-run marginal cost curve where the price is equal to or greater than the minimum average variable cost (Nicholson and Snyder, 2008).
An equally significant aspect of the theory of the firm, according toVarian (2014) is that the factors that influence supply response are related not only to the companies own-price and the expectations among producers of future prices, but also to the price of its substitutes and inputs as well as the level of technology used. In this manner, producers' responsiveness to changes in supply factors is measured by its elasticity, and in most markets own-price elasticities are usually more elastic in the long run than in the short run, as firms cannot easily change their sizes in order to produce more or less of a good (Mankiw, 2009).
With regard to agricultural supply response producers' price expectations and non-price factors such as technological advances, weather and cost structure play an important role in smallholder farmers' behavioral response to production output level. Henceforth, the estimation of agricultural supply response to price and other incentives was first carried out by Nerlove (1958) and the model consists of three linear equations (1, 2, 3):
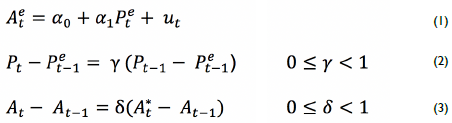
Where
A t and A e t are actual and expected area under cultivation; P t and P e t are actual and expected price; ү and δ are the expectation and adjustment coefficients, respectively.
The Nerlove model considers that the use of area under cultivation as the proxy for output is a more appropriate factor than production as it is the only variable directly under the control of smallholder farmers. Likewise, the model assumes that farmers price expectations are adjusted according to the difference between the actual price in the previous period and the expected price. Although the Nerlovian framework is a widely used approach for agricultural supply response analysis, one of its major criticisms is that by employing the ordinary least square technique spurious regression may occur if variables are non-stationary (Shahzad, Jan, Ali and Ullah, 2018; Mose, Burger and Kuvyenhoven, 2007; Obayelu and Ebute, 2016; Tripathi and Prasad, 2017).
Therefore, in view of the limitations of the Nerlovian supply response analysis, the vector autoregression (VAR) framework,that includes the unrestricted VAR,the structural VAR (SVAR) and the Vector Error Correction (VEC) model, are believed to be an alternative as they provide both short and long run elasticities, are consistent in dealing with non-stationary data and are easily interpreted (Lutkepohl, 2005). In essence, the VAR approach developed by Sims (1980) is a general framework that examines the dynamic interrelationship between time series; it considers all variables as endogenous and allows each of them to depend on the past lag of itself and of all the other variables in a finite order system. Hence, following the works of Engle and Granger (1987), and Johansen and Juselius (1990) the VAR framework was widened by employing the concepts of co-integration and error-correction in order to analyze the short and long run relationship between non-stationary variables. Thus, the vector error correction (VEC) model is a restrictive VAR used in non-stationary series that are known to be co-integrated.
3. Literature review
Since the earlier works of Ady (1949), Bateman (1965) and Behrman (1968) on cocoa, Arak (1968) on coffee and French and Matthews' (1971) pioneer econometric model on asparagus, research on perennial crop supply response has occupied in the past decades an important position in agricultural economics. Many of the empirical studies have used ordinary least squares (OLS) regression models, Nerlove's adaptive expectations and/or partial adjustment framework and alternative econometric techniques such as co-integration and error correction models.
In this manner, Laajimi et al. (2009) estimated the supply response of peach production in Tunisia, covering the period from 1980-2004. The econometric model was represented by three equations, the first two were removal and new plantings and the third was that of yield variation which were estimated according to the OLS method. Acreage response to changes in price was positive, however long-run elasticity was considered weak.
Xu Xu, Shengxiong, Zhijian, Wei (2012) exploited the Nerlove framework to establish a supply response model of grape to planting acreage, producer and import price in China from 1978 to 2007. The analysis showed that the estimated coefficients were consistent with the theoretical specifications and that the grape's planting acreage was not very sensitive to short and long-term price changes.
Wani, Huma, Ranjit and Ishfaq (2015) studied the supply response of apple and pear to own price, temperature and rainfall in Jammu and Kashmir for the period 198I to 2013 using the Nerlove framework, the Engle-Granger test and the Vector Error Correction Model in order to estimate the long and short-run dynamics. The VEC model revealed that estimated lagged price elasticities for both crops were highly significant and positive in the short and long run.
Mesike, Okoh and Inoni (2010) examined the rubber supply response to changes in prices, exchange rate and structural breaks in Nigeria for the period 1970-2008 by employing a co-integration and vector error correction approach. Results indicated that estimated short and long run price elasticities were low suggesting that farmers do not make significant supply adjustments in response to changes in expected prices.
Similarly, Soontaranurak and Dawson (2015) applied co-integration techniques to analyze the acreage supply response of natural rubber in Thailand. The study identified a positive relationship between planted area, rubber price and replanting subsidy and that pricing policies are useful in achieving desired acreage. However, the short and long-run price elasticities of acreage response implies that rubber farmers adjust area by a small amount in the short run in response to price changes, whilst significant adjustments are made in the long-run.
Likewise, Mustafa, Latif and Egwuma (2016) assessed the long-run relationship between Malaysian rubber acreage, relative price of rubber and fertilizer price by also using a vector error correction method. The estimated coefficients suggested that rubber supply is significantly influenced by the relative price of rubber and the price of fertilizer and that although farmers respond rationally to price incentives, rubber supply is inelastic both in the short and long-run.
4. Methodology
A quantitative, correlational and non-experimental research design was selected in order to assess and describe relationships among variables. The information required for the present study was obtained from secondary sources, such as the Food and Agriculture Organization Statistics (FAO-stat), Colombia's Ministry of Agricultural and Rural Development Database (Agronet) and economic and agricultural surveys published by the Colombian government.
4.1 Data and variables
The data consisted of annual time series spanning from 2000 to 2018 and the variables used were production (ton), peach domestic price (COP/ton) and yield (ton/hectares). Peach prices were deflated by the Colombian producers' price index (2018 = 100) and natural logarithms were used throughout for purposes of economic interpretation. The data and regression model were analyzed using E-views®9 package.
4.2 Model specification
Given that, the VAR model's purpose is to analyze time series data of an economic system and consists of a group of equations in which each of the variables is regressed on their own lags and the lags of the other variables it can be expressed as follow (Lütkepohl, 2005):

Where
Y t denotes an (n x 1) vector of time series variables; ϖ t are (n x n) coefficients matrices and εt is a white noise disturbance term that are not related to past values of the variables.
Nonetheless, when there is co-integration and the variables present non-stationary behavior the VAR model in equation 4 can be reparametrized into a VEC model:
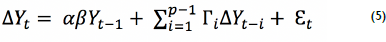
Where
∆Y t = Y t - Y t-1 is a p-dimensional column vector of non-stationary integrated 1(1) endogenous variables.
α =isa vector matrix that determines the speed of adjustment towards equilibrium.
β = represents the (n-I) co-integrating relationships between non-stationary variables.
Γ = is a n x 1 vector matrix that represents the coefficients of lagged variables.
Thus, the VEC framework of peach supply response function can be specified as:
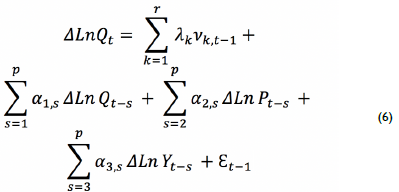
Where ∆LnQ t-s , ∆LnP t _ s , ∆LnY t _ s , are the lagged first difference of the logarithm of production, price and yield; α1, α2, α3 are short run coefficients; v k,t-1 ,.represents the residual from the co-integrating equation and λ k is the adjustment coefficient; ε t-1 refers to the error correction term assumed to be white noise and r and p are respective optimal lag lengths.
4.3 Stationary test
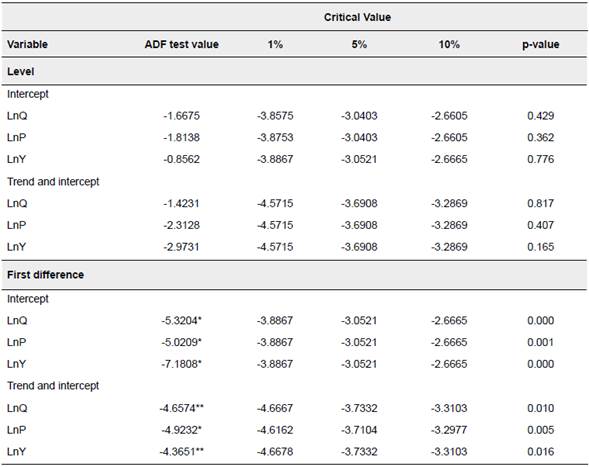
The study performed the Augmented Dickey-Fuller (ADF) (1979) test as it is the most commonly used and accepted strategy for testing time series stationary property. The I ADF tests the null hypothesis of the presence of a unit root in a times series sample and, in practice, if the ADF value is less than the critical value it can be determined that the time series is non-stationary. On the other hand, when the ADF value is greater than its critical value the underlying times series is stationary.
4.4 Co-integration Analysis
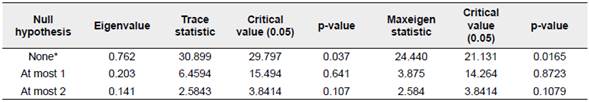
Co-integration in autoregressive processes is a key aspect for identifying the econometric model that best fits the times series, thus the Johansen co-integration method was employed. It uses a maximum likelihood estimation technique, specifically the trace and the maximum Eigen value statistic tests, and its advantage over other approaches is that it can test two or more co-integrated series. In this manner, the test statistics are given as (Johansen, 1991):
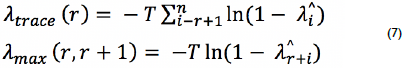
Where
r is the number of co-integrated vectors; T is sample size and λ^ i is the ith estimated Eigenvalues. The trace statistics tests the null hypothesis of r co-integrating vectors against the alternative of m co-integrating vectors whereas the maximum eigenvalue statistic tests the null hypothesis that there are "r" co-integrating vectors against the alternative of "r + 1" (Johansen, 1991).
4.5 Granger test
The study also performed the Granger causality test, which is widely used in literature to determine if one variable is useful in predicting another. It relates to the idea that if variable X is helpful in predicting Y, the regression of Y is based on past values of B and past values of X are added. Thus, X can be called Granger cause of Y or else it can be called non-Granger cause (Granger, 1969).
5. Results
5.1 Unit root test
In order to provide valid statistical results and to determine the econometric model that best fits the data it is essential to address the time series properties of the variables used since it must be of the same order of integration to avoid, as previously mentioned, problems of spurious regression. Therefore, as an initial step, the time series were subject to the ADF unit root test, where the number of lags of the variables was established using the Akaike information criterion (1976).
As shown in Table 1, in the level form, for both intercept and trend and intercept, the ADF test values in absolute terms were lower than the critical values, even at a 10% level. In this manner, the null hypothesis of the presence of a unit root cannot be rejected, hence, the times series are non-stationary. However, in the first difference, all variables are found to be stationary at 1% and 5% significance level, which suggests overall that the variables are integrated of order one, that is 1 (1).
5.2 Johansen's co-integration test
Since the time series data were stationary in the first difference, the Johansen's Maximum Likelihood method was performed. As can be seen from Table 2 the trace and the maximum eigenvalue tests reject the null hypothesis at the 95% significance level, as a result, there is strong evidence that supports the presence of at least one co-integration equation among the time series. Moreover, it can be inferred that there is a long-term equilibrium between peach output supply and own-price and yield; therefore, a VEC modelling can be further conducted.
5.3 Vector error correction estimates
Given the existence of co-integration and taking into account both the Akaike information criteria and the VEC order specification (p-I), a lag length of one was used to estimate the short and long run behavior of the times series. The estimated results in Table 3 show that the short run coefficients had a priori expected sign, were within reasonable range and the R2 (0.87) and the F-statistics (2.78) indicated that the estimated model fits the observed data.
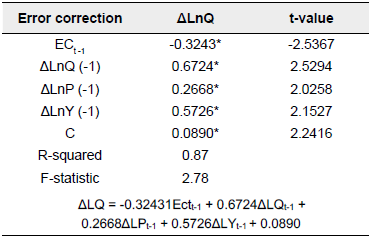
Moreover, the lagged peach price, with a co-integration coefficient of 0.26 (Table 3), suggests that supply output responds positively to the previous year's price. The coefficient was, however, inelastic; therefore, a rise in prices will most likely lead to a less than proportionate increase in peach output supply. With regard to yield, short run elasticity was also positive and statistically significant, hence, a one percent increase in yield will lead to a 0.57 percent increase in peach output supply in the following period.
In addition, the coefficient of the error correction term (-0.32) (Table 3), which measures the conversion towards long-run equilibrium, also presented the expected negative sign and was significant at the 5% level. In this manner, the coefficient suggests that 32% of the deviation of peach output supply from the long-term equilibrium level is corrected within one year. Consequently, any short-run fluctuations will take approximately 3 years to adjust to the long-run equilibrium, suggesting a relatively slow speed of adjustment for output peach supply response.
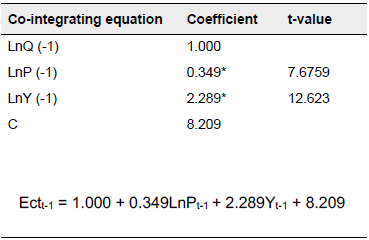
In the long-run, based on the values in Table 4, the estimates of the vector error correction model clearly show that own lagged price was inelastic (0.34) and presented a direct relationship with peach supply output and, therefore, it can be inferred that smallholder farmers supply adjustments are not very responsive to price incentives. Likewise, peach yield elasticity was positive as expected, however, elastic (2.28).
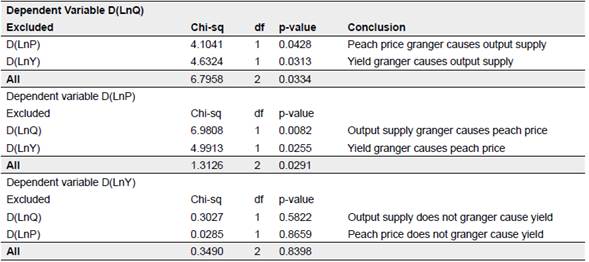
5.4 VECM Granger causality test
The study also examined the cause-effect relationship between the variables based on the Granger Causality test (Table 5). As such, if the p-values of the log time series are lower than the significant level of 5%, the null hypothesis can be rejected, thus confirming the existence of causality among variables. Therefore, the results show that LnQ and LnP granger cause each other and LnY granger causes LnQ and LnP. However, LnP and LnQ do not granger cause LnY.
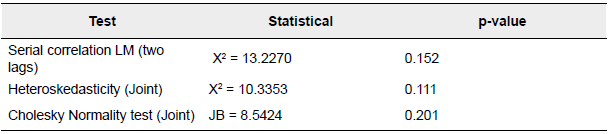
5.5 Diagnostic tests
In order to determine the goodness of fit of the estimated VEC model residual diagnostic tests were performed. From the results outlined in Table 6 it is evident that the model does not present specification errors as the assumptions of no serial correlation, homoscedasticity and normality were not violated.
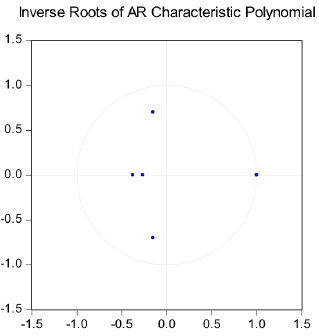
In addition, a stability test was carried out of which Figure 1 depicts the graph of the AR inverse root of the VEC model. Accordingly, the results show that all the polynomial roots fall within the unit circle or are equal to one. This outcome indicates that the estimated model is stable or stationary, and as such reliable.
6. Discussion
The agricultural sector for many lower and middle-income countries contributes significantly to economic growth. In fact, it is an important source of income for smallholder farmers and as such, price and non-price factors play a significant role in resource allocation, investment and planting decisions, thus the need to understand their characteristics and magnitudes (Soontaranurak and Dawson, 2015).
Therefore, according to the proposed VEC model's results, for the short (0.26) and long-run (0.34) coefficient estimates there is empirical evidence for claiming the existence of a positive and inelastic relationship between peach output supply and own-price. However, as own-price elasticity is below unit there is a strong indication that it is not an important factor in the cultivation of peach and consequently, price policies might not be very effective in increasing production levels. The findings corroborate those of Wani et al. (2015) who in their studies determined that for similar crops such as pear and apple estimated own short run price elasticities of 0.32 and 0.28, respectively had a positive relationship with output supply.
In contrast, for the present study the estimates for the long-run yield coefficient (2.28) with respect to output supply was elastic due most probably to the better use of fertilizer, climate, plant age and other biological factors. These results, however, present higher values than those of Laajimi et al. (2015) as in their studies on the response of fruit trees yield in Tunisia to variations in productive area, technology and rainfall, on average, yields only increased by 0.04% each year.
Furthermore, the vector error correction coefficient was negative and in line with theory, which showed that in the long-run, the model converges towards equilibrium, however at a relatively slow pace. A possible explanation for this slow adjustment can be attributed to the fact that smallholder famers may have technical constraints in the short run such as fixed capacity in terms of acreage, equipment and buildings, which can affect the speed of response to changes in output prices and yield. This conclusion is consistent with the findings of Mustafa, Latif and Egwuma (2016) and Mesike, Okoh and Inoni (2010) in the case of perennial crops supply response studies.
7. Conclusion
The contribution of this research to literature is important as it expands the existing knowledge and explores the factors that affect peach supply response. The study employed a co-integration and vector error correction framework to address the problems of spurious regression, which are inherent to other approaches and, as such, more I reliable results were presented.
The findings confirmed the expected hypothesis that price and yield are positively related to peach output supply response, and the existence of a relatively slow speed of adjustment. However, since smallholder peach farmers were found not to respond significantly to price movements, other long-term strategies orientated towards improving farmer's profitability should be put into place such as better payment terms, credit access, and technical support in order to improve fruit quality, as well as cost reduction measures.
Overall, the use of the VEC model contributed to better understand the long and short-term dynamics in peach supply output response, nonetheless, other lines of further research could be pursued by using data panel co-integration methods with a larger dataset or acreage rather than output response.

