


 English (pdf)
 Article in xml format
 Article references
 Send this article by e-mail
 Cited by SciELO
  Cited by Google
  Similars in
SciELO
Similars in
SciELO  Similars in Google
 Permalink
1. Introduction
Food (in)security is a broad and multidisciplinar/ concept that has been built over time and its meaning has changed over the past decades (Rodrigues de Carvalho, 2015). As such, food security exists "when all people, at all times, have physical and economic access to sufficient, safe, and nutritious food that meets their dietary needs and food preferences for an active and healthy life" (World Food Summit, 1996). This definition includes four dimensions: availability which refers to the quantity and quality of appropriate food; utilization of food through adequate diet, clean water, and sanitization; access to resources for obtaining adequate food; and stabilization which is related to reliable access to food periodically. In absence of one or more of these four dimensions, food insecurity arises (Ipek, 2022; Sassi, 2018; Bashir & Shilizzi, 2013).
The importance of food (in)security has been one of the United Nations Sustainable Development's main goals, and after the pandemic and current global economic crisis due to the Russian-Ukraine conflict, this priority has increased. Nevertheless, despite the international community's best efforts to tackle food (in)security worldwide, the number of undernourished individuals has risen. In fact, more than 828 million individuals globally lack access to sufficient food to fulfill their nutritional needs, and nearly 2.3 billion suffer from moderate or severe food insecurity (Randell, Gray, and Shayo, 2022). Hence, an average of 20% of the individuals in Africa, 9.1% in Asia and 8.6% in Latin America and the Caribbean suffered from hunger in 2022 (Food and Agricultural Organization of the United Nations - FAO, 2022).
In Colombia according to the World Food Program (WFP, 2023) out of the 15.5 million of the country's food insecure individuals (30% of the population), 2.1 million are classified as severely food insecure, indicating a critical level of vulnerability, thus the remaining 13.4 million fall under the category of moderate food insecurity. In fact, the findings from the assessment conducted by the WFP reveal a concerning trend when compared to the 2015 National Nutritional Situation Survey (ENSIN) analysis. The evidence clearly indicates a significant deterioration, with the prevalence of food insecurity rising from 54% to 67%. Moreover, it is noteworthy to highlight the significant number of individuals facing food insecurity in specific regions, such as Antioquia, which has the highest count of 1.7 million. This is closely followed by Córdoba and the Capital District of Bogotá, with 1.5 million and 1.3 million individuals, respectively (WFP, 2023).
During the twentieth century, droughts and natural disasters were considered the main causes of food (in)security, and hunger was associated with low food production however, it has become nowadays mostly an economic rather than an agricultural issue. It can be argued that the primary factors affecting food access are high prices, limited purchasing power, and low household real income (Ipek, 2022). As such, in Colombia its main causes lie not in food shortage but rather in the difficulty of obtaining it, which is primarily caused by low household-level income and the inefficiency of the agri-food systems related to the supply and distribution of food, which frequently results in an unjustified increase in prices.
Consequently, food insecurity imposes high direct and indirect costs on people as well as on their families, and it can reduce a nation's ability to accumulate human capital and, consequently, its economic growth capacity (Fogel, 2004). Therefore, in developing countries such as Colombia, it has become an important issue for researchers and policymakers. Although there are various indicators to assess and measure the extent of food (in)security one commonly employed is the number of undernourished people, as proposed by FAO, which is also used in the present study. In effect, it employs a rigorous methodology which its calculation relies on three primary parameters: dietary energy supply (DES), minimum dietary energy requirement (MDER), and the coefficient of variation of dietary energy consumption (CV). Thus, by combining them, the prevalence of undernourishment is obtained, which when multiplied by the population, provides an estimate of the number of undernourished people (Morales-Opazo and Barreiro-Hurle, 2011).
Furthermore, it is a widely employed indicator to monitor and analyze shifts of food insecurity on a global, regional, as well as on a national scale and since 1999, the FAO has published the State of Food Insecurity report, which includes it to monitor progress towards achieving the Millennium Development Goal (Cafiero and Gennari, 2011). Hence by employing a multivariate linear regression model, the present study attempts to examine the factors that affect the number of undernourished people in Colombia by assessing macroeconomic data for the period 2000-2021 including gross domestic product (GDP) per capita, unemployment and inflation rates. It is expected that the findings will contribute to the economic literature on food security and provide information to decision-makers on such an important issue.
The structure of this article is as follows: Following the initial section, the subsequent segments focus on the theoretical framework and literature review, respectively. The fourth segment presents the data analysis, including details on the econometric model and diagnostic tests employed. The fifth section presents the study's findings, while the final two sections provide a comprehensive discussion of the results and outline the main conclusions derived from the research.
2. Theoretical Framework
Food (in)security has always been a widespread problem that has affected people across the globe at various times throughout history. Poor harvests, conflicts, economic downturns, and natural disasters are some of the causes (Milá-Villarroel et al., 2016). The particularity of food (in)security in our time is that it is focused on certain areas and nations. Thus, there are different approaches to explaining food security such as the Food Availability Decline (FAD), the Food Intervention Decline (FID), and the Food Entitlement Decline (FED) proposed by Amartya Sen (1981), among others.
The FAD approach assumes that food security is caused by a sharp decline in per capita food supply due to wars, natural disasters, and epidemics that lead to shortages of food supplies (Belay, 2021). Food costs rise as a result, and those who cannot afford the increase consume fewer calories and nutrients. The most vulnerable begin to cut back on their food consumption causing in some cases starvation and mortality. Thus, food security is a matter of increasing food availability (Belay, 2021; Mila-Villarroel et aL 2016). On the other hand, the FID is a new framework that aims to protect all citizens by facilitating direct food interventions by governments, political institutions, and non-governmental organizations. It argues that food insecurity arises because government food policies and services do not ensure adequate levels of nutrition (Mila-Villarroel. 2016).
As a response, mainly to the FAD approach, Sen in his famous work Poverties and Famines (1981) proposed alternative reasons for food insecurity. As such he shifted his analysis from supply to demand shortages (Bezu, 2018). He claimed that "it is access to food that plays a crucial role in securing command over food, which in turn is determined by the source of entitlement to food" (Bezu, 2018, p.338). As a result, the dynamics of income generation and purchasing power may be the key factors in determining food security.
At the macroeconomic level, changes in income (GDP per capita) are an important factor when examining food (in) security. According to economic theory, the average income per person depends, among other things, on a country's development status and income distribution (Gerbens-Leenes, Nonhebel, and Krol, 2010). It can be argued that GDP per capita growth increases household opportunities to access food and overcome the negative effects of poverty (Mudrak, Lagodiienko, Lagodiienko, Rybchak, 2020). Therefore, a household's ability to provide enough and adequate food for its members depends primarily on the resources it has at its disposal however, in any given period the adequacy of these resources can be affected by national economic conditions. thus unemployment. and inflation play a significant role in food security.
In this manner, unemployment and low return on labor are the two employment-related factors that contribute to food (in)security. The latter depicts those who work for very low wages, whilst the former refers to those who are actively searching for work but are unsuccessful. Hence, both groups are unable to generate income and access an adequate amount of nutrients and calories so as to end food insecurity (Etana and Tolossa, 2017; Osmani, 2005). Concerning inflation. an increase in food prices also results in food insecurity as low-income households are very responsive to price variations and shocks. As a result, an uneven rise in prices inevitably reduces households' purchasing power pushing them into poverty (Hadley, Stevenson, Tadesse, and Belachew, 2012).
2. Literature Review
There is an array of studies that address the aspects of food (in)security from different perspectives. Hassen (2022) for example, analyzed food security and its relationship with food prices at a macro level in Ethiopia for the year 1998 quarter one to 2018 quarter four. The study employed a Bayesian VAR model with seven endogenous and three exogenous variables such as the percentage of undernourished people, food price, rainfall, exchange rate, and income per capita, among others. His findings showed that food prices had an effect on food security and by using the decomposition analysis he identified that the rate at which the number of undernourished people decreases in the short term is higher than in the long term. Aziz, He, Raza, Sui and Yue (2021) conducted a study also using macroeconomic variables to identify the determinants that affect the prevalence of undernourished in South Asia. Their study used a cross-sectional econometric model and overall findings suggested that a rise in food prices increases the prevalence of undernourishment in countries such as Pakistan, Nepal, and Sri Lanka.
Vasilii and Gao (2020), on the other hand, studied the correlation between the number of people presenting food security and food trade. inflation. and currency volatility for 45 developing countries by employing an autoregressive distributed lag model. They concluded that upper-middle income economies were more sensitive to food insecurity than least-developed countries and inflation and availability were the main factors. Moreover. Nord, Coleman-Jensen, and Gregory (2014) analyzed how changes in the prevalence of US food insecurity were associated with the unemployment and inflation rates as well as food prices of other goods in the period 2001-2012. The study employed an ordinary least-squares regression and results identified that an increase of one percent in the unemployment and inflation rates and food prices was related to a rise in the prevalence of food insecurity of 0.5%, 0.51%, and 0.6% respectively.
However, the paper which is probably the closest to what has been proposed in the present study in economic terms is that of Nugroho et al (2022) who examined the association between the number of undernourished people with unemployment, GDP, corruption control, cereal import dependency, and human capital in Asia, Africa, and Latin America for the period 2002-2018. The study used a one and two-step generalized method to analyze the data and their findings showed that the main variables affecting the number of undernourished people were related to production and nonproduction factors such as the food production and corruption index.
In terms of Colombia, there are no studies on the relationship between the number of undernourished people and macroeconomic factors such as gross domestic product per capita. unemployment. and inflation rates. Nonetheless. Bozsik. Cubillos. Bopushev. Vasal. and Magda (2022) analyzed and compared food security policy effectiveness between Colombia and Kyrgyzstan by employing a cross-sectional time-series data analysis during the period 2000 to 2018. They considered factors such as the food production index. food inflation rate. extreme monetary poverty. and food imports and exports. They concluded that access was the main determining component of the food price index, and that extreme monetary poverty was the most important variable in both countries.
3. Methodology
A quantitative, empirical, correlation design was used to examine and explain the relationship between the variables. Secondary data sources were collected from the Food and Agriculture Organization Statistics (FAO-stat), the Colombian National Statistics Department (DANE), and the World Bank databases.
3.1. Data and variables
The research utilized annual time-series data covering the period from 2000 to 2021. Four key variables were employed in the analysis: the number of undernourished people, gross domestic product per capita (serving as an indicator of income), and the rates of unemployment and inflation. The specific details regarding these variables can be found in Table 1.
3.2. Stationarity and validity tests
The Kwiatkowski, Phillips, Schmidt, and Shin (KPSS) test was used since it is an effective technique for short samples to determine whether the time series is stationary (Keblowski & Welfe, 2004). The KPSS method includes examining the null hypothesis that the data are stationary around a mean or deterministic trend against the alternative of non-stationarity. Moreover, diagnostic tests were carried out to ratify that the estimated model met the multicollinearity, stability, normality heteroscedasticity, and autocorrelation assumptions.
3.3. Model Design
On order to investigate the determinants of undernourishment, a time series multiple regression analysis was conducted to examine the strength and direction of the explanatory variables. Thus, in the specified model. the number of undernourished people is a function of gross domestic product per capita, unemployment, and inflation expressed in the equation below (1).

Linear estimation of equation (1) by adding an intercept and a stochastic error term results in the following transformation (2):

β1 = The constant term represents the predicted response of the number of undernourished people when GDPpc, unemployment, and inflation are all equal to zero.
β2 = Measures the response of the number of undernourished people to a change in one gross domestic product per capita unit, while keeping the other explanatory factors constant.
β3 = Examines the relationship between a one percentage point change in the unemployment rate and the corresponding alteration in the number of undernourished individuals, assuming no modifications in other variables.
β4 = Describes the influence of a one percent change in the inflation rate on the number of undernourished individuals, assuming all other factors remain constant.
ε= Captures the impact of unaccounted time series factors that were not incorporated into the model.
The sign and orientation of each coefficient reveals the correlation between the dependent variable and the explanatory ones in terms of their respective effects. Therefore, it is anticipated that the coefficients for UNEMP and INF will have a positive sign, as an increase in both variables is likely to hinder households' ability to access an adequate food supply. On the other hand, the coefficient for GDPpc is expected to have a negative sign, suggesting that higher household income enables greater affordability of regular and nutritious meals, leading to a reduction in the number of undernourished people.
3.4. Causal Relationships using the Granger Causality Test
To evaluate the causality between the variables, the study also used the Granger (1969) test. It assumes that "if a variable X Granger-causes another variable Y, then past values of Y and past values of X are useful in predicting Y", of which four distinct conclusions can be inferred (Cancino, Cancino-Escalante, Cancino-Ricketts, 2021) (Table 2).
Table 2 Granger Test Causality
| Direction of Causality | p-values |
|---|---|
| Unidirectional | |
| Variable X has no statistically significant Granger causal effect on variable Y | p > 0.05 |
| Variable Y has a statistically significant Granger causal effect on variable X | p < 0.05 |
| Unidirectional | |
| Variable X has a statistically significant Granger causal effect on variable Y | p < 0.05 |
| Variable Y has no statistically significant Granger causal effect on variable X | p > 0.05 |
| Bidirectional | |
| Both variable X and variable Y have statistically significant Granger causal effects on each other | p < 0.05 |
| Independent | |
| Variable X has no statistically significant Granger causal effect on variable Y | p > 0.05 |
| Variable Y has no statistically significant Granger causal effect on variable X | p > 0.05 |
Source: Authors based on Cancino, Cancino-Escalante, Cancino-Ricketts, (2021) and Girón (2018)
4. Results
4.1. Descriptive Statistics
As can be seen in Table 3 the statistical data provides insights into various indicators in Colombia, including the mean, maximum, and minimum number of undernourished people, gross domestic product (GDP) per capita, as well as unemployment and inflation rates for the period 2000-2021. Thus, the average gross domestic product per capita was estimated at USD 5.248. The maximum and minimum inflation and unemployment rates were as high as 8.75% % and 19.5% respectively, and as low as 1.61% and 7.7%. In addition, the number of undernourished people fluctuated from 3.5 to 6.9 million achieving its highest value in the year 2009.
Table 3 Mean, maximum, and minimum number of undernourished people, gross domestic product per capita, unemployment, and inflation rates in Colombia (2000-2021)
| Variable | Mean | Max | Min | Standard deviation |
|---|---|---|---|---|
| NUP | 4.74 | 6.9 | 3.5 | 0.87 |
| GDPpc | 5,248 | 8,118 | 2281 | 1966 |
| INF | 4.8 | 8.75 | 1.61 | 2.04 |
| UNEM | 12.35 | 19.5 | 7.7 | 3.30 |
Source: Authors
4.2. Stationarity Test
The presence of stationarity should be verified as a first step in developing the appropriate econometric model specification to prevent issues with spurious regressions. Consequently, the KPSS stationarity test was performed on the number of undernourished people. gross domestic product per capita. Unemployment, and inflation rates in Colombia (2000-2021) (Table 4) and based on the results upon the significance level of 0.05 the LM statical values of all variables analyzed were lower than the critical values. Hence, there is evidence for accepting the null hypothesis of stationarity which implies that the time series are integrated of order cero I (0), therefore allowing for the use of a least squares regression method.
Table 4 KPSS test statistics for the number of undernourished people, gross domestic product per capita, unemployment, and inflation rates in Colombia (2000-2021)
| Variable | LM Statistics | Critical values | Conclusion | |||
|---|---|---|---|---|---|---|
| 1% | 10% | |||||
| NUP | Constant | 0.192 | 0,739 | 0,463 | 0,347 | I (0) |
| Constant and linear trend | 0.103 | 0,216 | 0,146 | 0,119 | ||
| GDPpc | Constant | 0.462 | 0,739 | 0,463 | 0,347 | I (0) |
| Constant and linear trend | 0.115 | 0,216 | 0,146 | 0,119 | ||
| UNEM | Constant | 0.173 | 0,739 | 0,463 | 0,347 | I (0) |
| Constant and linear trend | 0.112 | 0,216 | 0,146 | 0,119 | ||
| INF | Constant | 0.461 | 0,739 | 0,463 | 0,347 | I (0) |
| Constant and linear trend | 0.113 | 0,216 | 0,146 | 0,119 | ||
Source: Authors
4.3 Model Estimation
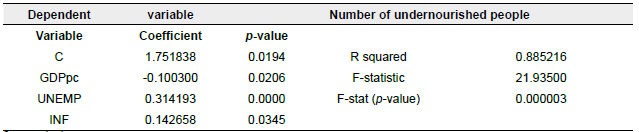
The estimation of the regression model was the next step. and the findings indicated that the time series p-value associated with the t-statistic was highly significant (p < 0.05) and that the joint effects of the independent variables (gross domestic product per capita. unemployment. and inflation rates) accounted for 88% of the variation in the number of undernourished people in Colombia. This suggests that the model has a strong explanatory capacity, which is further supported by the F-value significance (p = 0.000) (Table 5).
Table 5 Multiple regression model result for gross domestic product per capita, unemployment, and inflation rates in Colombia (2000-2021)
Source: Authors
Furthermore, the estimated equation (3) exhibited coefficients that were coherent and aligned with the anticipated signs. The regression coefficient for the number of undernourished people in Colombia was negatively related to GDPpc, while for UNEMP and INF it presented a positive correlation.

Therefore:
βGDPpc = This implies that a USD 1 increase in gross domestic product per capita reduces the number of undernourished people in Colombia by 0.1 million, ceteris paribus.
βUNEMP = This denotes that a 1% increase in unemployment will lead to an increase in the number of undernourished people in Colombia by 0.31 million, ceteris paribus.
βINF = This means that with an increase in inflation by 1%, the number of undernourished people in Colombia increases by 0.142 million, ceteris paribus.
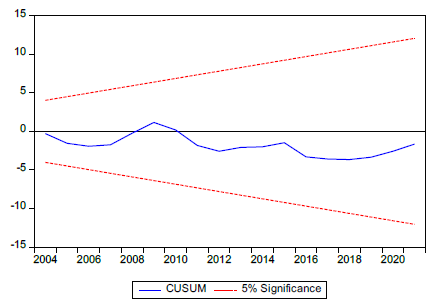
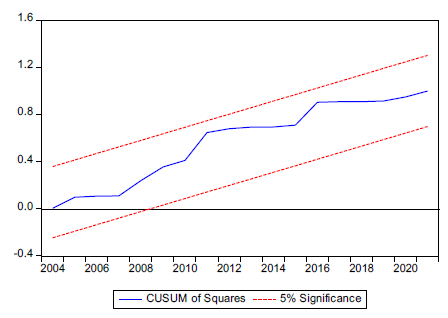
4.4. Model Stability
Concerning the structural stability of the model, the outcomes of the CUSUM and CUSUMQ for the indicators used in this study such as the number of undernourished people, GDP per capita, Inflation, and unemployment rates in Colombia (2000-2021), showed that for both charts the statistics were within the 5% confidence interval, indicating the parameters' strength (Figures 1 and 2).
Source: Authors
Figure 1 CUSUM Plot for the number of undernourished people, GDP per capita, Inflation, and unemployment rates in Colombia (2000-2021)
4.5. Multicollinearity and residual tests for normality, autocorrelation, and heteroscedasticity
The model's appropriateness was verified through various diagnostic tests. The Jarque-Bera statistic provided evidence that the residuals exhibited a normal distribution (JB = 0.271; p-value of 0.87 > 0.05). Additionally, none of the explanatory variables, such as gross domestic product per capita, unemployment, and inflation rates, exceeded the variance inflation factor (VIF) threshold of ten suggesting that collinearity was absent among the variables (Table 6).
When dealing with regression models, it is important to address the issue of heteroscedasticity, as it can lead to asymptotically inefficient conclusions. Therefore, to address this concern, two tests, namely the Glejser and the Breusch-Pagan-Godfrey (BPG) were conducted and the results, as presented in Table 6, indicated that even at a significance level of 35%, the alternative hypothesis of heteroscedasticity was rejected for both tests.
Table 6 Multicollinearity for gross domestic product per capita, unemployment, and inflation rates in Colombia (2000-2021) and heteroscedasticity test results
| Explanatory Variable | Variance Inflation Factor | Heteroscedasticity (non-constant variance) test | X 2 | P-value |
|---|---|---|---|---|
| GDPpc | 2.15 | Breusch-Pagan | 2.83 | Q.41 |
| UNEMP | 1.81 | Glejser | 3.21 | Q.35 |
| INF | 1.75 |
Source: Authors
Moreover, it is essential for a linear regression model that the residuals are not autocorrelated, meaning that the residual of one observation should be independent of the residual of another observation. Therefore, the Q-Statistic Ljung-Box (Figure 3, see page 10) test was employed, and the findings showed the non-existence of a p-value lower than 0.05 which indicates that the hypothesis of the presence of autocorrelation was rejected. The Breusch-Godfrey LM test, employing two lags (p = 0.184) strengthens this result.
4.6. Causal relationships using the Granger Test
The investigation also evaluated the causal relationship among the different factors, namely the number of undernourished people, GDP per capita, inflation, and unemployment rates in Colombia from 2000 to 2021, using the Granger causality test. The findings indicate that in most cases (4 out of 6 variables), there is no causal relationship between the time series, as the p-values exceeded the 5% significance level. However, it revealed a unidirectional causality from unemployment (UNEM) and inflation (INF) to GDP per capita (GDPpc) therefore, suggesting that both unemployment and inflation can contribute to predicting Colombia's gross domestic product per capita (Table 7).
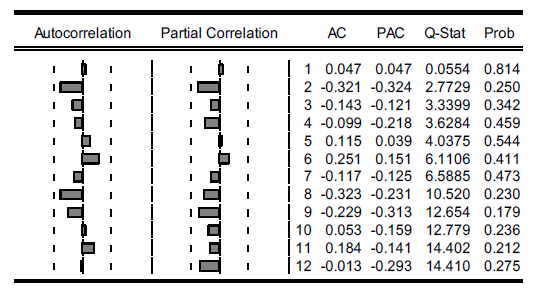
Table 7 Granger-Causality results for the number of undernourished people, GDP per capita, Inflation, and unemployment rates in Colombia (2000-2021)
| Null Hypothesis | F-statistic | Probability | Outcome |
|---|---|---|---|
| NUP does not Granger Cause GDPpc GDPpc does not Granger Cause NUP | 2.275 1.261 | 0.137 0.311 | Non-existent causality |
| NUP does not Granger Cause INF INF does not Granger Cause NUP | 0.473 0.186 | 0.631 0.831 | Non-existent causality |
| NUP does not Granger Cause UNEMP UNEMP does not Granger Cause NUP | 1.301 0.274 | 0.299 0.764 | Non-existent causality |
| GDPpc does not Granger Cause INFL INF does not Granger Cause GDPpc | 2.026 3.671 | 0.138 0.040 | Unidirectional |
| GDPpc does not Granger Cause UNEMP UNEMP does not Granger Cause GDPpc | 1.248 3.192 | 0.315 0.043 | Unidirectional |
| INF does not Granger Cause UNEMP UNEMP does not Granger Cause INF | 0.672 1.896 | 0.525 0.184 | Non-existent causality |
Source: Authors
5. Discussion
The present study was conducted to identify the macroeconomic determinants that affect the number of undernourished people in Colombia and overall findings suggest that it can partly be explained by household income, unemployment, and inflation. According to the proposed econometric model, the explanatory variables proved to be significantly different from zero, consistent with the hypothesized signs, in line with theory and as expected, GDP per capita was negatively related to the number of undernourished people in Colombia, and UNEM and INF presented a positive relationship. Likewise, the model satisfied all statistical diagnostic requirements, including the confirmation of stationarity through the KPSS test. The residuals were found to be normal and stable, therefore, indicating that the proposed parameters contributed to explaining the number of undernourished people in Colombia and as such are important predictors.
These findings are consistent with the results of Hassen (2022) and Enakhe and Tamuno (2021) which showed that higher inflation rates lead to an increase in the number of undernourished people. However, it differs from those obtained by Aziz et al (2021) who identified that for countries such as Afghanistan, India, Bangladesh, and Nepal higher food prices reduced the number of undernourished people. They argue that most probably this occurs because there are government food safety programs that enable households to access adequate food, which in the case of Colombia also exists, however it might not be as effective as in these countries. Undeniably, the country needs to promote a more suitable and institutional plan to improve households' purchasing power and thus, prevent undernourishment.
Moreover, a rise in unemployment exacerbates food insecurity as labor is an important asset that households rely on to earn their living. It can be argued that periods of unemployment increase the odds of low food intake making it more difficult for households to meet their basic nutritional needs. Hence, the results of the present study support this evidence and are consistent with a robust body of past work (Ipek, 2022; Etana and Tolossa, 2017; Huang, Kim and Birkenmaier, 2014; Fikre, 2012) who claim that the national unemployment rate is not only a strong predictor but is also positively related to household food insecurity. Additionally, these studies emphasize that unemployment increases social exclusion and the risk of poverty which in turn increases the risk of food insecurity.
6. Conclusions
This study adds new information to the research literature and investigates the factors that contribute to explaining the changes in the number of undernourished people in Colombia and, if the current trend of its increase continues, the Zero Hunger goal proposed by FAO in the year 2030 will not be achieved. Therefore, there is a need for more reliable and detailed information not only to direct and design government policies but to find out to what extent it affects economic growth and household income.
As a result, the present study concludes that although income shocks brought on by inflation and unemployment undoubtedly impact the number of undernourished people, other factors must also be considered for policy and practice to effectively reduce it. Therefore, it is advised that further research be done, considering factors like political, environmental, information technology, and cultural, among others.

