


Services on Demand
Journal
Article
 English (pdf)
 Article in xml format
 Article references
 Send this article by e-mail
Indicators
-
 Cited by SciELO
 -
 Access statistics
Related links
-
 Cited by Google
 -
 Similars in
SciELO
Similars in
SciELO -
 Similars in Google
Share

 Permalink
Revista de Relaciones Internacionales, Estrategia y Seguridad
Print version ISSN 1909-3063
rev.relac.int.estrateg.segur. vol.10 no.1 Bogotá Jan./June 2015
ARTÍCULO
INCOME DISTRIBUTION AND POVERTY AS OBSTACLES TO THE RECOVERY OF THE CRISIS IN THE EUROPEAN UNION*
DISTRIBUCIÓN DE INGRESOS Y POBREZA COMO OBSTÁCULOS A LA RECUPERACIÓN DE LA CRISIS EN LA UNIÓN EUROPEA
DISTRIBUIÇÃO DE RENDIMENTOS E POBREZA COMO OBSTÁCULOS À RECUPERAÇÃO DA CRISE NA UNIÃO EUROPÉIA
José Nabor Cruz Marceloa
* This research was developed with the support of "Fellow Program Postdoctoral Fellowships 2012 at UNAM".
a Ph.D. Economics at UNAM. Main international prize of economic Investigation (Research) In Latin America and Spain - Jesus Silva Herzog 2012, granted by the IIEC and UNAM. México, D.F.-México. Mail: josenabor7@hotmail.com.
Referencia: Cruz, J. (2015). Income Distribution and Poverty as Obstacles to the Recovery of the Crisis in the European Union. Revista De Relaciones Internacionales, Estrategia y Seguridad, 10 (1), pp.135,158.
Recibido: 1° de agosto de 2013Aceptado: 23 de agosto de 2014
ABSTRACT
This article shows how the income inequality has generated intense debate not only in economic theory but also in the social sciences, since it is considered essential improvement in perceptions of income to generate economic and social welfare. Thus, through three indicators, the Gini coefficient, the share of wages in GDP and an index of income concentration evolution of alternative analyzes income distribution in the countries of the European Union (EU) during the period 1995-2012. In addition, economic scenarios are simulated through an algebraic model that is based on Monte-Carlo method, the effects of some alternative strategies for Public Policy that can be held in the European Union to address the economic downturn and improve social inequality. It is found that while demand shocks do not apply in the economy, the economic downturn will continue, and the reduced purchasing power of wages in the EU. This constitutes factors influencing social discontent and protest which consequently will impact on the security and development of the European economies
Key words: Crisis, Income Distribution, Social Security, Wages.
RESUMEN
Artículo que informa los resultados de cómo la desigualdad de los ingresos ha generado un intenso debate no sólo en la teoría económica sino en las ciencias sociales en general, puesto que se considera imprescindible una mejora en las percepciones de ingresos para generar bienestar económico y social. Por lo tanto, a través de tres indicadores, el coeficiente de Gini, la participación de los salarios en el Producto Interno Bruto y un índice de concentración del ingreso alternativo se analiza la evolución la distribución del ingreso en los países de la Unión Europea (UE) durante el periodo 1995-2012. Además, se simulan escenarios económicos, a través de un modelo algebraico que se basa en el método de Monte-Carlo, los efectos de algunas estrategias alternativas de Políticas Públicas que se pueden llevar a cabo en la Unión Europea para enfrentar la recesión económica y mejorar la desigualdad social. Se encuentra que mientras no se apliquen choques de demanda en la economía, la recesión económica continuará, así como la reducción del poder adquisitivo de los salarios de la UE. Lo cual constituye factores que influyen en el descontento y protesta social que consecuentemente impactarán en la seguridad y desarrollo de las economías europeas.
Palabras claves: Crisis, Distribución del Ingreso, Seguridad Social, Salarios.
RESUMO
A desigualdade de renda tem gerado intensa debate não só na teoria econômica, mas nas ciências sociais em geral, uma vez que é considerado essencial para a melhoria da percepção de renda para gerar bem-estar econômico e social. Assim, através de três indicadores, o coeficiente de Gini, a participação dos salários no PIB e um índice de evolução da concentração de renda de análises alternativas de distribuição de renda nos países da União Europeia (UE) durante o período 1995-2012. Além disso, cenários econômicos são simulados por meio de um modelo algébrico que é baseado no método de Monte-Carlo, os efeitos de algumas estratégias alternativas de políticas públicas que podem ser realizadas na União Europeia para enfrentar a crise econômica e melhorar desigualdade social. Verifica-se que, enquanto choques de demanda não se aplicam na economia, a crise econômica vai continuar, e o poder de compra reduzido de salários na UE que são fatores que influenciam o descontentamento social e de protesto que, consequentemente, terão impacto sobre a segurança e o desenvolvimento das economias europeias.
Palavras-chave: Crise, Distribuição de Renda, Segurança Social, Salarios.
INTRODUCTION
This document is a research project that analyzes the impact of the increase in inequality in the European Union after the economic crisis, both in economically and socially. Since 2009, the vast majority of European economies -principally comprising the so-called Euro Area (EA)- entered into a process of deep economic recession, which highlights the following facts: sharp contraction of gross domestic product (GDP) respective, rising unemployment rates, falling purchasing power and hence labor productivity: therefore expected that economic and other economic variables recovery may not occur in the short term but maybe in the long run.
Undoubtedly, it has managed a discussion about whether the European Crisis presents a paradigm shift in economic policies to be followed in countries of this part of the world, both to overcome the economic crisis and to generate development paths again. For some theorists, the neoliberal model may have shown serious problems (mainly on issues of financial liberalization) so it is questionable whether it is a model for other countries.
However, this paper proposes two central hypotheses, first, that Europe has a longstanding problem, as the paradigm of political economies that has taken place in the last sixty years. that in recent years, despite the neoliberal model came up from the eighties, persisted remnants of the welfare state in public policies that countries like Germany, Spain or France conducted in recent years which, diverting a considerable amount of financial resources to low-productivity activities that did not cause an increase in both the same as in the salaries of the lower classes of Europe. Therefore, as a second working hypothesis states that the income distribution (measured by three indices: Gini Coefficient Wage and Participation Concentration) is an essential indicator to consider when establishing different types of economic policies and to the European case, these policies will demand central axis, as when stimulated, may improve both income distribution and therefore encourage economic growth in the short term.
This document is divided into the following parts, this first introduction, then the presentation of the theoretical framework economist Michal Kalecki 's ideas on the role of demand and income distribution in obtaining growth rescue of an economy, subsequently a concentration index that is valid for European economies is proposed.
Third, review of stylized facts, both the evolution of macroeconomics of the eurozone as a whole, as specified from a set of European countries (Germany, Ireland, Spain, France and England) is performed so that they can establish baseline data for these economies macroeconomic model. Fourth, a macroeconomic model that will allow us to apply demand shocks that may indicate that as crucial in the short term is published, it will be the income distribution and poverty, public policies that can carry out to tackle the economic crisis current, first, a review of the economic adjustment programs, which apparently have only accentuated significantly, the recession in European countries.
THEORETICAL AND EMPIRICAL BACKGROUND
Analyze the factors that explain a given distribution of income and why it evolves in a certain way, over time, has been a recurring theme in the development of economic theory. From the classical view of authors such as David Ricardo and Karl Marx to neoclassical ideas, led by Alfred Marshall, income distribution has been the subject of analysis.
Michael Kalecki made its analysis on the performance of the economy without using some theoretical concepts of its own era, such as perfect competition of businesses therefore assumed as a "normal" functioning of capitalism underutilization of productive resources.
As there is the agglomeration of firms in different shapes and cartel coalition concluded that the price is not a given market, but a result of costs and agreements. Firms produce with excess capacity of plant and equipment, therefore, there is no "taking" of prices by firms.
Such conceptions of companies in capitalism led to Kalecki formulation of the concept of "degree of monopoly", which examines the influence of the power monopoly of the companies on the formation of prices and income distribution. In this context that each monopolist sets the price of companies for your product (or products) by adding an excess of money (premium), above average unit cash costs. This price should allow cover fixed costs and profit.
Kalecki notes that the share of wages in value added for an industry (w) is equal to: (1)
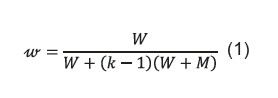
The variable k represents the degree of monopoly, total wages W and M the total cost of raw materials. Therefore, the magnitude of gross profits (plus overhead) equals the volume of total direct costs (W and M) multiplied by the ratio of the surplus, which is determined by the degree of monopoly minus one. If in equation (1) is defined as j, the relationship between the total cost of materials and the total amount of wages j = M / W, we have:
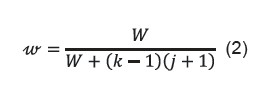
It can be set for the manufacturing industry generally similar to that obtained for a single industry formula in equation (2) is replaced by k and j by k' and j', well, we divide the expression for w': (2')
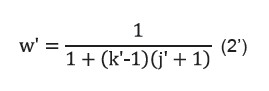
The share of wages in value added (w') will differ from the true participation (w), in an amount that will be due to changes in the industrial composition of value added. That is, the relative share of wages in value added is determined, in addition to the industrial structure of the same, the degree of monopoly and the relationship between commodity prices and wage costs-production unit. Increasing the degree of monopoly or commodity prices rise, relative to wages per unit produced the proportion by them in the aggregate value decreases.
In summary, the involvement of employees in the entire manufacturing industry will be inversely related to both the degree of monopoly in the various stages of production and marketing circuit, as the amount of inputs and raw materials produced outside said circuit , and which therefore constitute the same exogenous factor. Also, of course the participation of employees in the added value saved directly related to the amount of wages paid.
A THEORETICAL PROPOSAL ON THE DISTRIBUTION OF INCOME
After a review of the ideas of Kalecki on the income distribution, then the theoretical foundations on which will rest our analysis of income distribution and impacts of different development strategies and alternative economic policies are established.
Specify a structuralist model for an industrialized economy with a thriving services sector to simulate policy scenarios and alternative growth strategies. In particular, this model seeks to examine the effects of these strategies on the distribution of income. Will be based on a specification where three sectors with different social classes, in which demand will play a central role in the growth of the economy arise1.
By following the approach of Lopez (2005) and Cruz Marcelo (2013), we can formulate an index of simple concentration, consisting of the per capita income of the group with the highest income (tenth decile) on the average per capita income of all lower incomes (the poorest 70 % of the total population). From the foregoing:
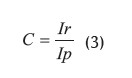
We defined the concentration index like C, which represents the per capita incomes of the rich capitalists Ir and Ip is the sum of the incomes of the poor economy.
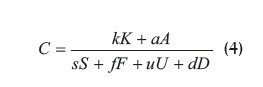
In which:
k = proportion of the industrial capitalists of all rich.
K = per capita income of the industrial capitalists.
a = proportion of wealthy capitalist agricultural sector.
A = income per agricultural or rural capitalists.
s = ratio of the number of working poor in relation to the total poor in the economy.
S = per capita income of the working poor.
f = proportion of workers in the service sector relative to total poor economy.
F = per capita income of workers in the services sector itself
d = proportion of rural poor in the total of these within the economy.
D = per capita income of the rural poor
u = proportion of the total unemployed in poor economy.
U = per capita income of the unemployed.
This concentration index allows us to distinguish the main factors that determine the distribution of income in a semi-industrialized economy. It can be shown that the coefficient C depends primarily on the relative proportions-and the change in the same-different categories of income earners within the rich people and the poor.
Now it is convenient to analyze the historical evolution of some economic variables such as GDP, sectorial and total employment, income, the Gini coefficient and concentration index (C) is proposed in this section to demonstrate the validity of the latter in the analysis of income distribution for European economies in the context of the current crisis. It is noted in Cruz Marcelo (2013) present an extended version of the equations for the calculation of the algebraic model, this data aggregated European economies we will review below.
STYLIZED FACTS
The revised data for both the European Union (EUU) clearly exhibit the dynamics of the two economic models that were applied in the region of 1960-2011. Overall, we find three phases of growth during the fifty years considered, from 1960 to 1975 rates of growth of gross domestic product in the region are reported, which, entering a downward trend in the five years from 1975 to 1980, arrive at a third term, with growth rates virtually stagnant over the past three decades.
In analyzing the first sub-period (1960-1975) the strong growth dynamic that originates in this group of countries from the end of WWII, under the context of Keynesian public policy set forth in section which is apparent commonly called "welfare state", since for the two periods from 1960 to 1970, the growth rates of GDP for both groups (Eurozone and European Union) were greater than 5%, this growth was not report again in the next forty years2.
Clearly, such "welfare state" unfolded with the strengthening of an internal market, since in the first decade considered, the total volume of trade (sum of exports and imports) hardly accounted for forty percent of the GDP of both regions, however, this changed dramatically from year period from 1980 to 1985, so that in the last five years, the volume of total trade, approximates the total GDP of the Eurozone by 80%.
However, it should be noted that both exports and total imports, reported rates of doubledigit growth for the first fifteen years of the period, this can be explained by the growth dynamics in which were made to some extent, goods surpluses whose final destination was selling in the foreign market, in addition to the process in which other branches of the economy, such as services gradually became relevant since the beginning of the period considered.
In fact, the share of value added of the three main sectors of the economy (agriculture, industry and services) reported the same trend worldwide. That is, for example, the agricultural sector in the first three five-year periods, yet reported participation rates in GDP greater than 5%, however, since 1975, the trend is totally decreasing. Meanwhile, the value added of the industrial sector, reported for the same period, 40% of GDP, likewise marks a downward trend in the subsequent sub-periods.
Meanwhile, in analyzing the Total Government expenditure both entities (Eurozone and European Union) atypical behavior is observed, although, when considering the variable as a percentage of GDP, we can say that government spending has increased, especially in the last 30 years, actually, this is not entirely true, since the annual growth rates, presented a decreasing trend as these, in the first sub- period, ranging between 4 and 5%, however, as reported in Table 2, the expansion of government spending has actually been limited and no more than 2% in the past three decades. As a second sub-period is considered a five setting (1975-1980) was presented as a sharp contraction of GDP, in the context of a central discussion of the paradigm shift of public policy to be applied in European countries. It sets aside after the crisis of the mid-seventies, the model of the welfare state, that mainly at England, is established from the eighties, a model of economic liberalism in recent years consolidated under a techno-economic paradigm. Which impacts on variables such as government spending and gross capital formation (negatively) and variables external trade and domestic credit (positively).
The third sub-period represents the last thirty years, with a clear downward trend - cyclical rate of growth of gross domestic product (see Figure 1), where the model of centralized government that empire in previous years, is modified strongly. First, both exports and total imports increased in volume (measured as % of GDP) with a higher rate of annual growth to 5%, which caused the 1980-2011 practically participation doubling in the total product two European areas. However, when reviewing the export destination, you can check that persists a strong centralization of its exports, as approximately 80% of these, target markets "Ingres High" ie (USA Japan), and not only from the late nineties, exports within the European Union has increased from 3% to almost 7% in 2011. While the process after the entry of Euro as the single currency integration helped to increase trade between European countries, their export performance is not a strong leverage in their own "internal market". Since the origin of European imports reported the same profile, ie, a high concentration of High Income countries and an increase in the European market since 2000.
Furthermore, in examining the behavior of both domestic credit to the private sector, such as domestic credit provided by the banking sector, the huge flow of capital which went to European countries during the last fifty years is checked. From 1960 to 1975 represented barely fifty percent of the GDP, however, since 1980, domestic credit was increased, so that in the late eighties, and reached 85% of GDP, to continue their growing trend, in 2000, the two types of loans reviewed, accounted for over 100% of GDP in Europe, however, it is important to check whether these focused capital to invest in productive activities.
In reviewing the evolution of both gross fixed capital formation and fixed capital, for both groups of countries, its volume share of GDP fell during the study period. Since 1965 both variables accounted for a little more than twenty-five percent of GDP, but by 2010, their share was only an estimated twenty percent. Therefore, we can say that the large amount of domestic credit that appeared in the last three decades, there went mostly for capital investments in European countries.
EVOLUTION SELECTED COUNTRIES GERMANY:
GERMANY: From the data reported in the annex, it can be said that the German economy, reports the best indicators for the past 16 years, this due to the higher average annual growth from 1995 to 2010 the countries of the Area Euro (1.8 %) with some stability in most variables checked. However, when examining the Gini coefficient, we find that practically income distribution is virtually the same in 1995 (29) and 2010 (29.3), this means that even though in this period growth rates were reported (the per capita GDP increased by just over five thousand euros per German citizen) actually, improvements in times of growth were not strong enough, so that in times of crisis negatively income is not redistributed. And this, is exactly what happened, since the seven income deciles did not change too much, of 1995 (0.659) to 2010 (0.652) and not respond to the movements of total GDP and per capita (see Table 6 in Annex 1).
However, a possible explanation for the lower income perceptions remain constant, can be found in the employment structure of the Germans, first, there is a persistent unemployment since 2000 has fluctuated average annual rate 8.8 % (although in 2010 the rate fell to 5.9 %) which virtually reduced the possibilities of improving the overall income of the poor to move from the ranks of the unemployed formal work. In fact, the Germans who were self- employed, increased slightly from the nineties (7% on average) to almost 9% in 2010.
At the same time, the trend in sectorial employment confirms European trends of the last twenty years, ie, diminished both agricultural peasants and industrial workers and only employment in the service sector, increased over the review period, of Indeed in 1995 the Germans who worked in services accounted for 64 % of the total, by 2010, 73.8% of all employees were concentrated in that sector. This is paradoxical, because while, exports growth rates almost double digit and increasing its volume (measured as percentage share of GDP) the reality is that no German exports were based on industrial and manufacturing sector, since both value added and employment in both variables were reduced gradually over the last ten years. In addition, gross capital formation, confirms this process to reduce the volume of the industrial sector, which represent almost 22 % of GDP in 1995, moved to only 17 % in late 20103.
The role of the German government could be instrumental in economic recovery policies, however, shows that tax revenue, remained almost constant from 1995 to 2010, inclusive, Government Spending, showed a slight downward trend until 2007, since it heavily hit (almost three percentage points) from 2008 to 2011, however, should be analyzed more thoroughly how effective has resulted in increased demand for government. Because on the one hand, social spending increased only in 2010 for the remainder of the period also presented a slightly decreasing trend. Finally, the public debt (measured as a percentage of GDP) grew from 2001 is again relevant, since similarly, the increase in demand that could have been presented (10% of gross domestic product in the last ten years) not seem that much fundamentally improved income distribution, such as the use of the working poor and middle class in Germany.
FRANCE: Probably the third largest economy to the set of European countries analyzed, France. Immediately, based on the data presented in Table 7 of Annex 1, we can say that the Gini coefficient has certain inconsistencies in recent years. As from 2007, the index increased significantly, indicating that there is a negative income redistribution in the French economy, however this is not true. If we examine in detail the income of both first four deciles as the sum of deciles 1 to 7, it is found that instead of down, the income of the French considered poor, remained constant from 2005 to 2010.
This can be explained in several ways, first, the unemployment rate although its reductionist trend changed in 2007, the reported rate in 2011 is similar to the parameters of the mid-nineties (as presented in the most European countries), which is put into practice policies to cushion the destruction of formal employment, secondly, the French government social spending, increased significantly from 2007 to 2010, this is in line with increases in almost three points percentage of total government spending in the last five years. Importantly, it also lightened the tax burden, as the collection rate and consequently decreased tax revenues in 2009 and 2010. And the French debt (at par with the British case) from 1995 to 2005, reported a steady decline, but from 2005 and especially 2007, the debt ratio measured as a percentage of GDP increased significantly. In general, the various ways that the French government implemented were near demand shocks (perhaps Keynesian and Kaleckian spirit) which first protected the incomes of the poorest French and avoid a collapse in formal employment as presented in the rest of Europe.
Remarkably, in terms of formal sector work, European trends are true, however, employment in the industrial sector fell slightly, which prevents the work in the services sector to grow as strongly as in the rest of the countries analyzed. This is the result that France is one of the few economies (if not the only ) where the gross capital formation keeps increasing over the last 15 years trend, which explains that in relative terms, the decline in employment industry was not as pronounced. At the same time, the dynamics of foreign trade also present but very moderate increasing trend, which explains that the French economic model is not restricted in a high percentage, the movements of the external sector.
ENGLAND: Although it is not integrated into the so-called Eurozone, it remains as a leading country in that region, in the 2007-08 biennium presented negative growth rates, annual average 1995 to 2011 was 2.5%, the highest value among the set of countries reviewed in this paper. However, it is beginning to confirm the trend already discussed in the German case, ie, despite the GDP per capita almost eight thousand euros increased per capita, the Gini coefficient reported in 1995 (32) 2010 (33) makes a negative income distribution. Paradoxically, the income of the first seven deciles remained almost at the same levels during the fifteen years analyzed. So we have a scenario of growth of total output of the economy, lower unemployment but does not translate into an improvement between the perceptions of the poorest deciles of the country (see Table 8 in Annex 1).
Another highlight is that England seem to be remote foreign trade boom was experienced in other European economies during the past fifteen years. Its exports barely increased in volume, though, remained a constant trade deficit to be larger purchases its sales abroad. However, in the structure of employment if we find analogy with the rest of Europe, where employment in the service sector goes from 74% in 1995 to almost 83% by 2010. The other two sectors, agriculture and industry, make the same decreasing tendency in all countries of the European Union.
Finally, the English government tax revenues are the highest among the countries of the area, the couple maintained a spending (demand) increased slightly from 1995 to 2007, and most importantly, the ratio of debt to total expenditure, under a clearly decreasing trend to gradually reduce its public debt, however, this is strongly increased to represent 48% of GDP in 2008 to 74% in 2010. This is possibly explained by increases in English debt focused on increasing demand shocks to cushion the effects of the crisis, but unemployment and income distribution in 2011 will reflect the same levels of 2008.
SPAIN: Along with Ireland, the Spanish case seems to be a successful case of integration from 1995 to 2006, as the average annual growth rate of GDP was 3.7%, the highest among the countries of the region, likewise, GDP per capita increased almost four thousand euros per capita. If we make a cut in 2005, found the lowest Gini coefficient within the period of fifteen years, (see Table 9 in Annex 1), along with a major in perceptions of the four poorest deciles, with a fall in growth income of the richest decile considered, hence the sharp drop both the Gini coefficient and concentration index proposed.
But the analogy with the Irish case is found in the sense that from 2007, the various developments in income redistribution were lost in 2010, since the values of the various indicators considered are virtually identical to the 1995. We can consider a number of hypotheses about the fragility of the Spanish economy, first, the sharp rise in unemployment in the Iberian country, ie, after a major process of creating formal employment (which was supported both Spanish workers as migrants) that led to reduce the historical rate of over twenty percent unemployment, only eight percentage points in 2007, however, practically only three years, the Spanish unemployment rate returned to levels above 20%.
The data provided can assume a relatively weak productive apparatus of the Spanish economy, the value added of the manufacturing sector marked a downward trend in the period analyzed, just as the industrial sector, although less pronounced. However, despite the reduction of industrial scheme, is somewhat contradictory to the increase in gross capital formation from the beginning of the period until 2007, later to reduce their level of participation to return to the 1995 level. Thus from the behavior of capital investment we can infer that the reduction of industrial value added was not as marked as in other European countries, it is clear that is a variable of great fragility, as before the reduction internal demand, gross capital formation declined sharply.
Also, a high percentage of self-employed people, almost twenty percent, which are the most exposed to negative shocks reduction of GDP jobs also reported at beginning of period rates higher than the average of European Union agricultural and industrial employment, this was changed to the last five years, when employment in the services sector rose to follow the European trend.
Finally, the Spanish government, reported an atypical evolution, tax revenues decreased progressively throughout the study period, this means that the Spanish government did not have sufficient resources to increase demand, which is proven to analyze the evolution of government expenditure (measured as a percentage of GDP) since remained stagnant until 2008, when it increased slightly. However, the ratio of public debt if Spanish was reduced by almost half in the first 12 years considered, but as of 2008, government debt increased again to levels approaching the nineties. In addition, the resources of the debt is not necessarily focused to encourage productive activities, but focused on bailouts and the private sphere.
One of the assumptions that we can infer from that that fragility in the economy, the percentage of self-employed workers prevailing in the labor market and the strong presence of industrial workers, since both percentages of participation outperform significantly, the average of other European countries. Therefore, to reduce the production of industrial goods, there is a destruction of formal employment, reducing the demand for workers and population of poor and middle class in Ireland, so that the contraction of the economy is multiplied such as happened after 2007. Obviously you have to analyze in more detail the Irish case, because at first , it seems that offered successful results in the integration process started with the launch of the Euro as a single currency, however, has demonstrated the sensitivity with which that economy reacts to external shocks.
IRELAND: Now, after timely review three of the largest economies (both volume of product as investment and population), the cases of countries that at first, took advantage of the conditions for the integration of the euro area in the early past decade, some certainly successful models and others, like Spain, have fallen too much the advances obtained in the pre-crisis era. Although Ireland reported growth rates of Gross Domestic Product between 2000-05 greater than 5% and a strong reduction in unemployment 12.30% in 1995 to 3.9 % in 2001, and income inequality between 2001 to 2005, the effects of the financial crisis of 2007, the Irish economy produced were placed in 2011, reported levels in 1995, as the incomes of the poor.
While it is true that from 2001 until 2007, Ireland was regarded as the most successful model, the countries of the European "periphery" which was being integrated properly, the powers of the region, of course, as indicated by data in Table 10 of the Annex, Ireland and reported a strong external sector, with an export volume (measured as a percentage of GDP) close to eighty percent in 1995, this is explained because in 1995-2005 the Irish industrial sector remained growth rates higher than the service sector, as well as a dynamic employment also very strong, which resulted, to reduce unemployment and increase GDP per capita by almost 4,000 euros. Another fact that confirms this is that gross capital formation increased by 10 percentage points over the same period.
During these ten years, strong economic growth based on its external sector, allowed the central government of Ireland, kept tax revenues and especially reduced significantly, the debt ratio to represent 60.75% of GDP in 1998 to only 32% in 2004. Certainly a successful case, however, the favorable situation radically changed after 2007, when years have reported negative growth until 2011. While the Irish government debt hand made, as a method to try to increase demand in the economy and thus reduce the effects of the crisis , the results have not been favorable, since the income the poor were reduced in the last four years , standing again at 1995 levels.
A MACROECONOMIC MODEL FOR EUROPE
As discussed in the first part of this paper, the importance of analyzing the distribution of income is because we believe that this reflects a synthetic way how growth affects the level of welfare of the population4. When using as a basis the Kaleckian theoretical essence of the role of demand and its impact on income distribution -and the precedents established by Lopez (2005) and Cruz Marcelo (2013)- the following macroeconomic model to an industrialized economy but is formulated a large services sector.
From these simulations, we study the effects of different types of shocks, and different policy options on global growth, and on the peculiarities of that growth, that is, what in the past was called "the style of development" These simulations allow us to have a basis for arguing rigorously, what the possibilities are and what limits, if Europe is to overcome some of the fundamental problems, such as stagnation, poverty, unemployment, structural heterogeneity, and the unequal distribution of income.
SIMULATED SCENARIOS
As we have noted, we believe that increases in non-agricultural wages can help to equalize the distribution of income. A common criticism of the policy of wage increase decreases argues that profits, therefore discourages private investment and further expansion of production and employment.
However, this is not necessarily true. Given the existence of unused productive capacity, increases in real wages can reduce the unit profit margin, but on the other hand, expanding the demand for employees and therefore the total sales.
This neutralized, at least in part, the initial negative impact on profit margins. Therefore if and only if an economy full use of its productive capacity, income redistribution could have main and possibly only generating inflationary pressures, obviously, in the light of different statistics the effect this is not the now if the European economy. According to the above, the first simulation of this section allows us to identify the effects on the economy when prices move towards presented by the capitalists to an increase in industrial nominal wage.
In reviewing the results shown in third picture actually is a positive income redistribution by reducing the concentration index. However, this decrease is less when compared with some other simulations involving direct increases to the income of some of the members of the poor class of the economy. Importantly, the total income of the poor, despite the restriction via prices affecting the rest of the poor and middle class, is increased by a significant amount, because when compared to the first two scenarios, this expansion Total income of the poor is almost double, which directly affects the decline reported by the variable (C).
Note the data in each column represent the mean value for each variable after estimating ten thousand scenarios. Source: calculated by the software package model R, statistical analysis and graph.
Given the characteristics of the model, it is possible to review in two phases the effects that occur in the system from the initial course. In column A of the table four we present the results obtained in the first process of the simulation, ie, excluding the change in prices and how these affect the purchasing power of service workers and poor peasants.
If not taken into account the ideas of Kalecki how capitalists (in this industrial case) applying a mark-up, consider erroneously that an increase in workers' wages would be a very successful measure to alleviate the unequal distribution of income in the economy as well as a mechanism that favors a strong expansion of sectoral demand.
Given the characterization of the model, it is possible to define, and in a second phase of the simulation, the demand for urban services and rural poor decreases due to higher prices, leading to a fall in purchasing power by about fifty percent. This can be seen clearly, since the total demand in the economy is increased on average only 0.95%.
Note: The results in both columns set rates percentage change in average ten thousand scenarios in each of the scenarios.
Overall, the results certainly positive this scenario are biased on one side, there is a redistribution of income, but on the other, the expansion of the sector if demand is affected by rising prices in the economy.
Note: the data in each column represent the mean value for each variable after estimating ten thousand scenarios. Source: calculated by the software package model R, statistical analysis and graph.
Given the above, the following scenario will allow us to analyze what is the effect of an increase in wages when prices remain constant and thus the margin which is affected, more precisely, it will decrease. We assume again that the wages of industrial workers 10% rise. The increase in wage costs can impact prices, however we believe that the capitalists want to transfer the increased costs, therefore, the margin will be the variable that will be modified and whose change will impact the system of equations of the model. Indeed there is a strong redistribution of income, decreasing the concentration index on average 4%. Sectorial demands are increased by the effects of raising the incomes of the poor class. However we can again do a little analysis further. When comparing the results between the column labeled Phase A of Table 5 with the final results of the second simulation, it is clear that the latter values are slightly lower.
One possible explanation for this is the change in profit margins of the industrial capitalists, however remember that one of the assumptions of the model is that the actual spending - capitalist remains constant basic conjecture in the theory of Kalecki- by thus, capitalists do not necessarily decrease their spending when their profit margin is reduced.
Given the characteristics of the model, the possible capture both the extreme heterogeneity of social classes, and the sectors of the European economy, we can determine that by showing an increase in income of urban workers, the results are more positive in the whole economy, if capitalists choose not passing higher wage costs to prices. It is also true, that if the above transfer case cost prices, the redistributive effect and increased sectorial demand (there by expanding employment requirements in subsequent phases) can contribute to growth and redistribution of positive income is presented in an economy with the current recessionary conditions as experienced in Europe.
CONCLUSIONS
From the results of a first set of simulations we highlight the importance of its application in the working poor, self-employed, workers in the service sector and the rural poor. First, it is somewhat paradoxical that although both countries of the European Union as a whole set of countries reviewed, there is a strong disparity of income, ie the first seven deciles concentrated between 55 and 65 percent of total income, measures that help to address the economic crisis, from an increase in their income, are not considered as of today in the medium term.
That is, if we review some experiences, like Brazil in recent years, a demand shock via wage increases can be carried out fully, thus improving income distribution as a progressive increase in gross domestic product. As revised, if you stick to the vision of Kalecki, imperfect competition (presence of monopolies) under this scheme, firms are price setters (not seeking an equilibrium price as the classical school suggests) then it could be viable policy of increasing wages in some European countries.
In general, European countries have tended toward the service economy, i.e. services provide both the greatest amount of value added in final goods production, as the most formal employment is growing in this sector, therefore published a policy that focuses on progressively increasing the income of the workers may be feasible, as these consisted of monopolistic firms is assumed at first that the profit margin, or what Kalecki called mark up, is certainly broad which could definitely increase the wages of urban workers, without implying a transfer of the cost increase to end- product prices.
This shows that whether or not there, transfer of resources, a strong increase in total demand in the economy would be presented, although industrial workers are not the majority of the European labor force, if a strong multiplier effect is brewing, since it would require increases in formal employment to increase total demand, leading to both a reduction in unemployment (by about three percentage points) as well as increased production of the three sectors of the economy.
Undoubtedly the European crisis is a problem of employment and debt, while the second term is somewhat more complicated deal, the government of each European country should focus both on protecting its workforce, to prevent the destruction of employment is progressive (as is the case of Spain) as well as try to help to increase formal employment. Obviously, it also notes that of the three indicators considered is the concentration ratio proposed, the best way to capture the movements in income distribution by integrating the perceptions of middle and poor classes of Europe, it is therefore important not only to propose measures to be focused on increasing production but also on improving income distribution.
Along with an increase in wages of European workers, given the profit margin could improve income distribution and increase overall demand in the economy, we can consider some alternatives, such as it is, increase demand of government, both via transfers to the self-employed, informal or poor, or increasing productive activities, to enhance industrial competitiveness peasants.
In a scheme where the devaluation of the exchange rate is not feasible, and only has changes in interest rates as a monetary measure, fiscal policies are a real option, in order to face the current crisis. Obviously countries like Greece, with a very expensive public debt, is a totally unworkable way but peripheral economies like Spain and Ireland may, instead of applying budget cuts, with high social costs, stimulate the economy through demand shocks, provided and when there is full coordination between the government, unions and businesses, to establish alternative public policies cutting.
NOTES
1 However we found various applications Keynesians models for the analysis of income distribution in Europe such as: Hein, E., & Tarassow, A. (2010), Dosi, et. al. (2012) and Onaran, Ö., & Galanis, G. (2013) Volver
2 To analyze the recent developments in the European economy review Dolls, M., Fuest, C., & Peichl, A. (2011), and Lancee, B., & Van de Werfhorst, HG (2012) Volver
3 The German case is analyzed in depth in Peichl, A., Pestel, N., & Schneider, H. (2012) Volver
4 Some cut Kaleckian models, but with different methodologies for the European case, consider Stockhammer, E., & Stehrer, R. (2011), Von Arnim, R. (2011), Nikiforos, M., & Foley, DK (2012), Sasaki, H., & Fujita, S. (2012) and Hein, E. (2013). Volver
REFERENCES
1. Afonso, A., Schuknecht, L., & Tanzi, V. (2010) "Income distribution determinants and public spending efficiency". The Journal of Economic Inequality, 8(3), 367-389. [ Links ]
2. Behringer, J., & Van Treeck, T. (2013). "Income distribution, aggregate demand and current account: a sectoral perspective" IMK Working Paper, 125. [ Links ]
3. Cruz Marcelo, José Nabor (2013) "La distribución del Ingreso y los modelos de desarrollo en México" Instituto de Investigaciones Económicas, UNAM. [ Links ]
4. Dosi, G., Fagiolo, G., Napoletano, M., & Roventini, A. (2013). "Income distribution, credit and fiscal policies in an agent-based Keynesian model". Journal of Economic Dynamics and Control, 37(8), 1598-1625. [ Links ]
5. García-Peñalosa, C. (2010). "Income distribution, economic growth and European integration". The Journal of Economic Inequality, 8(3), 277-292. [ Links ]
6. Hein, E., & Tarassow, A. (2010). "Distribution, aggregate demand and productivity growth: theory and empirical results for six OECD countries based on a post-Kaleckian model". Cambridge Journal of Economics, 34(4), 727-754. [ Links ]
7. Hein, E. (2013). "Finance-dominated capitalism and re-distribution of income: a Kaleckian perspective". Cambridge Journal of Economics, 38. [ Links ]
8. Iglesias, E. M., López, J. A. P., & Sántos, J. M. S. (2013). "Evolution over time of the determinants of preferences for redistribution and the support for the welfare state". Applied Economics, 45(30), 4260-4274. [ Links ]
9. Jagielski, M., & Kutner, R. (2013). "Modelling of income distribution in the European Union with the Fokker-Planck equation" Physica A: Statistical Mechanics and its Applications, 392(9), 2130-2138. [ Links ]
10. Kalecki, M. (1976) "Economía socialista y mixta: selección de ensayos sobre crecimiento económico" Fondo de Cultura Económica, México. [ Links ]
11. Lancee, B., & Van De Werfhorst, H. G. (2012). "Income inequality and participation: A comparison of 24 European countries". Social science research, 41(5), 1166-1178. [ Links ]
12. López, J. (2005) "Income distribution in Latin America. Theoretical considerations and Mexico's experience" Economie Appliquée (81-104) [ Links ]
13. Nikiforos, M., & Foley, D. K. (2012). "Distribution and capacity utilization: conceptual issues and empirical evidence". Metroeconomica, 63(1), 200-229. [ Links ]
14. Onaran, Ö., & Galanis, G. (2013). "Income distribution and aggregate demand: A global Post-Keynesian model". Working Paper Greenwich Academic Literature Archive (GALA). [ Links ]
15. OCDE (2008) "Growing Unequal?: Income Distribution and Poverty in OECD Countries". [ Links ]
16. Paul, F. J., & Francesco, S. (2010). "Europe: How deep is a crisis? Policy responses and structural factors behind diverging performances". Journal of Globalization and Development, 1(1), 1-19. [ Links ]
17. Peichl, A., Pestel, N., & Schneider, H. (2012). "Does size matter? The impact of changes in household structure on income distribution in Germany". Review of Income and Wealth, 58(1), 118-141. [ Links ]
18. Sasaki, H., & Fujita, S. (2012). "Income distribution, debt accumulation, and financial fragility in a Kaleckian model with labor supply constraints", Working Paper, No. e-12-007. Kyoto University [ Links ]
19. Stockhammer, E., & Stehrer, R. (2011). "Goodwin or Kalecki in demand? Functional income distribution and aggregate demand in the short run". Review of Radical Political Economics, 43(4), 506-522. [ Links ]
20. Von Arnim, R. (2011). "Wage Policy In An Open-Economy Kalecki-Kaldor Model: A Simulation Study". Metroeconomica, 62(2), 235-264. [ Links ]
STATISTICAL TABLES OF A SET OF EUROPEAN ECONOMIES
