


 English (pdf)
 Article in xml format
 Article references
 Send this article by e-mail
 Cited by SciELO
  Cited by Google
  Similars in
SciELO
Similars in
SciELO  Similars in Google
 Permalink
Introduction
In the economics literature there is a wide discussion around the relationship between income and price elasticities and economic growth1. Most studies show a strong correlation among these variables2. Progress in financial and economic integration worldwide in recent years has boosted the process of trade cooperation toward liberalization. In some cases, it has caused severe imbalances in the balance of payments. The elimination of these imbalances has been performed essentially with the sequence of structural adjustment programs that the International Monetary Fund (IMF) has recommended; they have focused on suggesting measures such as the devaluation of the national currency, reduction of public consumption, limited expansion of domestic credit, increase in taxes, wage restraints, etc. (Gafar, 1995).
The success of devaluation as a policy for exchange-rate adjustment depends on the elasticities of export and import prices, that is, whether it meets the Marshall-Lerner condition (Gafar, 1995). High elasticity of exports means better prospects of success for real devaluation to generate income from exports (Senhadji y Montenegro, 1998).
Since consumer income grows continuously, modern literature marginalizes the importance of price elasticities and their role in achieving competitive advantages3. This statement is convincing, especially for rich countries, where consumer decisions are based on quality, technology superiority, and advanced services. Based on this assertion, it is clear that the countries attempting to improve the competitiveness of characteristics not related to export prices (captured through the income elasticity of the demand for exports) create an environment for increased economic growth (Nilsson, 2002).
For this reason, the greater the income elasticity of exports, the more significant its role in achieving economic growth. The sensitivity of the import demand to changes in domestic income and relative prices is also significant in economic developments. As mentioned by Palley (2003), under conditions of increased income in the importing country, if the price elasticity of import is high, import demand will increase significantly, which a deterioration of the trade balance will reflect. However, imports may decrease if domestic income increases and domestic production grows simultaneously. If prices are lower than those abroad, this will contribute to a fall in imports4.
Consequently, in this context, it is evident that deducing the estimate of the export and import sensitivity to changes in prices and income is a transcendental feature of macroeconomic policy. Thus, estimating the price and income elasticities is critical for a country, as they can apply itto many relevant issues of macroeconomic policy: The effect of monetary and fiscal policies and the expenditure-changing policies (such as exchange rate policies, subsidies, and tariffs), the balance of payments, the impact of restrictions of external equilibrium on domestic policy measures, the international transmission of changes in economic activity and prices, and the effects on employment of changes in trade restrictions in the countries themselves or their partners (Algieri, 2004).
The estimation of trade elasticities has practical use in macroeconomic models to forecast economic growth5. The economic literature has widely explored the relationship between exports and economic growth is a topic that. Many analyses confirm their strong correlation. The long-term relationship between trade balance and economic growth is calculated from conventional equations for export and import demands based on Thirlwall’s Law (Araujo, R. Lima, G., 2007).
The first studies that attempted to estimate foreign trade elasticities came from the IMF foundation. In fact, within the framework used in the IMF creation, they raised the possibility to keep exchange-rate control as the core that cannot be changed without IMF authorization. For this purpose, they estimated on the effect of changing prices related to trading flows (Harberger, 1957). This led the first articles to focus on calculating the price elasticities of exports and imports, to establish whether devaluations were effective or not to correct the trade balance (Orcutt, 1950).
This range of studies includes the pioneers: Houthakker and Magee (1969). This study focused on establishing how changes in aggregate demand transmitted from the industrial developing countries through the growth of real income in industrialized countries and the growth of exports in groups of developing countries. Using simple equations of demand, Houthakker and Magee (1969) noted that the real income in importing countries and the competitiveness of prices in exporting countries are the main determining factors of exports in several developing countries. As a result, estimates of income elasticities of importing countries compared to exports of individual developing countries (excluding Europe and Israel) go from 0.34 (for Brazil) up to 2.01 (for Peru). Moreover, the average income elasticity calculated in individual developing countries is approximately 0.9.
In the case of Colombia, studies by Misas et al. (2001), Zuccardi (2002), and Hernández (2005) have estimated income and price elasticities for the demand of total imports, consumer goods, intermediate goods, and non-traditional exports, using different econometric methods. However, they have not extended the analysis incorporating Multilateral Thirlwall’s Law. We can state that the closest evidence to this topic lies in the study by Ramirez and Florez (2017), which estimates the price and income elasticities of demand for non-traditional exports from Colombia, sent all around the world and towards three specific destinations: The United States, the European Union, and Latin America. The main conclusion is that the demand for non-traditional Colombian exports is more elastic than for income than prices in the analyzed regions.
In short, the document presents a novel contribution, from Thirlwall’s approach, of the effects on Colombia’s economic growth of its six main trading partners. It shows that the devaluation policy is not an effective tool to boost the external sector and, consequently, the country’s growth. Thererfore, we can conclude that the incentive to exports and their diversification is the most effective economic policy to increase the growth of Colombia.
The main objectives of this research are: (i) To estimate the income and price elasticities for imports and exports of Colombia’s main trading partners and (ii) to estimate the Multilateral Thirlwall’s Law for the 1986-2015 period. In consequence, the structure of this paper includes: the introduction; the second section, which provides an extension of Thirlwall’s law (1979, 2011) in multilateral trade relations, and the third section, that explains the methodological aspects of the estimation of equations for the demand of exports and imports and the reasons to select the error correction model (ECM).
The ECM is obtained through a two-stage process. In the first stage, a regression among the variables in levels or logarithms displays long-term relationships; subsequently, the residual is removed from the equation regression to analyze its order of integration. Suppose the estimated residual turns out to be stationary. In that case, it can be argued that there is a long-term relationship among the analyzed variables, or better yet these variables are cointegrated. The coefficients obtained in this first stage represent the long-term dynamics of the model and stand out as long-term elasticities.
The empirical results are presented in the next section, focusing on a practical application of the estimated income elasticities in the framework of a Multilateral Thirlwall model, attempting to explain the low growth of the Colombian economy. The conclusions and bibliography are in the final section.
Thirlwall's Model and Some Extensions
Thirlwall’s model is an important alternative to explain differences in growth between developed and developing countries (Cimoli et al., 2009). Thirlwall’s law states that the ratio between the income elasticity of the demand for exports and the income elasticity of imports multiplied by the growth rate of the world’s GDP can determine the growth rate of a country in the long term. Although Thirlwall, in his original 1979 article, studied only a group of developed countries, McCombie (1997) subsequently reinforced this law by taking a more significant number of countries.
The search for more evidence of Thirlwall’s Law has produced some extensions because it has been found that developing countries often have a growing deficit in their current accounts primarily funded by capital inflows. Thus, Thirlwall’s equation has been amended to allow capital flows. They applied the transformed model to a group of developing countries, and found that capital flows are relevant to explain some of their growth rates; for example, Brazil, Tunisia, Pakistan, and India. They developed two direct extensions of Thirlwall’s model (1979) in the 2000s, based on McCombie’s theoretical model (1993).
In 2003, Professor Nell extended the analysis of Thirlwall’s law to bilateral relationships. Although there has been strong criticism around this model because it considers that a country should have a balance of payments with all partners, we cannot ignore that it has provided relevant information on the importance of considering the multilateral agreements of countries. This model was extended initially by incorporating a country’s trade relations with the rest of the world. Subsequently, a more generalized version was developed, considering that a country may have multilateral trade relations. The author showed that trade partners might affect the exports of a different country. The main finding of this model referes to the fact that the policy implications of the generalized growth model of the balance of payments present a different perspective than the specific balance of payments.
In Nell’s model, they explain a country’s longterm growth rate by the relationship between the weighted average of exports of each trading partner and the weighted average of income elasticities for imports of each trading partner. Although the model originally considered only two partners, it can be extended to several countries.
Incorporation of the multilateral model into the original Thirlwall's law
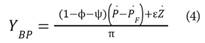
To derive the multilateral model, it is necessary to begin with the original Thirlwall model (1979). In this model, the growth rate in the long term comes from a simple model of the current account balance that finds its support in three equations: 1) The role of import demand, 2) the role of export demand, and 3) the condition of balance. We represent these functions as follows:
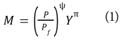
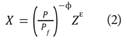
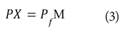
M gathers imports in real terms, P are domestic prices, and are external prices (both expressed in foreign currency), Y is the national real GDP, X are exports in real terms, and Z is the world’s real GDP. The Greek parameters are (positive) elasticities. By taking the growth rates and replacing the first two equations (1) and (2) in the condition of balance (3), and by solving the national real growth rate, we can obtain Thirlwall’s Law (). In this case, the dots on the variables indicate growth rates.
To extend equation (4) to a multilateral model, we assume that each country “i” has “n” trading partners j = 1,.... n. By exploiting the fact that the country exports “i” to country coincide by definition with the imports from country “j” from a country “i”, then . Thus, using equations (1), (2) and (3), we can extend the model by using the following equations:
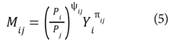
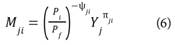
Where represents the actual imports of partner “j” and country “i”, Pi are the prices for country i, are the prices for country j, i is the real GDP of country i, are the actual exports of country i to partner country j, and j is the real GDP of country j.
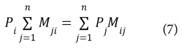
By replacing (5) and (6) in (7), we obtain the following:
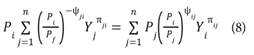
Considering that the shares of imports and exports in the market of country; in country i can be expressed by the following equations:
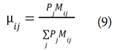
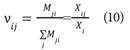
Substituting (9) and (10) in (8) and making algebraic manipulations, we can observe multilateral ThirlwaH’s Law in the following mathematical expression:
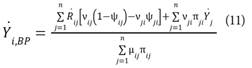
In this equation, are the relative bilateral prices, is the import share of country; within country i. ij is the relative price elasticity of imports of country i compared to partner;, is the export share in the total of country; compared to country i. ji is the relative price elasticity of imports of country; compared to country i. is the income elasticity of imports of country; compared to country i. j represents the GDP of partner;, is the income elasticity of imports of country i compared to partner;. All parameters have a positive sign, and the dot on the variables indicates the growth rate.
Assuming that the relative prices are constant, that is to say, is equal to zero, we reduce equation (11 ) to the following expression:
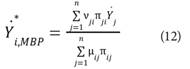
In equation (12 ), we found that the rate of longterm multilateral growth () depends on the structure of imports and exports and the difference in the growth rate of trading partners. We can arrive to some insights from the above equation:
(i) An increase in the growth rate of country j; (i.e.,) has a positive effect on . Similarly, a higher income elasticity of exports and a higher participation of partner; within the total exports implies an increase of multilateral Thirlwall’s Law; (ii) an increase in the market shares of the bilateral exports, , has a positive effect on , provided that the actual bilateral exports are growing at a positive rate; (iii) an increase in the market share of bilateral imports,, has an ambiguous effect on, since it is more likely to be negative if the income and price elasticities of bilateral imports are higher; (iv) an increase in the growth rate of relative bilateral prices,, has a negative effect on, provided that the weighting of market shares between i and; fulfills the Marshall-Lerner Law.
Empirical Estimate for Colombia
Methodology, sources of information, and data
The data used to calculate income and price elasticities for exports and imports of the six selected countries are drawn from the national accounts based on the information collected from the World Bank, the National Administrative Department of Statistics (DANE, 2020), and the Bank of the Republic of Colombia. Therefore, 1986 to 2015 is the analysis period, and we express the series in 2010 prices.
The model
Through an ECM6 we performed the calculation of income and price elasticities for exports and imports. This model is used regularly to relate integrated variables of I order (1) that show relationships of balance.
ECM7 is obtained through a two-stage process. In the first stage, a regression among the variables in levels or logarithms is estimated to display longterm relationships. Subsequently, the residual is removed from the equation regression to analyze its order of integration. If the estimated residual turns out to be stationary, i.e., integrated of I order (0), it can be argued that there is a long-term relationship among the analyzed variables, or better yet that these variables are cointegrated8. We obtained the above because the linear combination of I order integrated variables (1) results in a variable of a lower order of integration. The coefficients obtained in this first stage represent the model’s long-term dynamics and stand out as long-term elasticities.
The second stage is to estimate the short-term relationships9 obtained upon calculating the model using the variables in differences and adding the residual of the one-period-lagged, long-term equation as an explanatory variable. The coefficient of this last variable is known as the error correction term; it measures the diversion percentage of the long-term relationship corrected in each period. The higher its value, the quicker errors are corrected. Coefficients of this model are short-term elasticities and we can interpret them as changes that occur over a period compared to the prior period.
Mathematical representation of the ECM
Based on equations (5), (6), and (7), we can estimate the ECM for exports and imports through the following equations:
Imports:
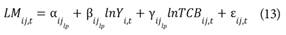
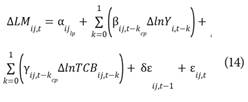
indexes the actual imports of Colombia from each trading partner at each moment in time represents Colombia’s GDP at each moment in time “t”; is the type of bilateral real exchange rate of Colombia with each trading partner “j” at each moment in time “t”; is the income elasticity of Colombian imports with each trading partner is the price elasticity of Colombian imports with each trading partner and refer to the shortterm and long-term, accordingly; 6 is the error correction factor; In is the Napierian logarithm; and A is the first-difference operator.
Exports:
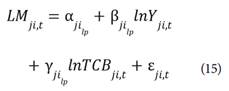
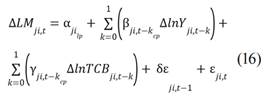
In this case, represents the actual exports of Colombia to each trading partner “j” at each moment in time “t”. represents the GDP of each trading partner “j” from Colombia at each moment in time “t”. gathers the bilateral real exchange rate of Colombia with each trading partner at each moment in time “t”. is the income elasticity of Colombian exports with each trading partner “j”. is the price elasticity of Colombian exports with each trading partner and refer to the long-term and short-term, accordingly. 6 is the error correction factor, is the Napierian logarithm, and A is the first-difference operator.
Empirical results of the model
We implemented the following phases o estimate the export and import elasticities:
Unit root- The first step was to apply the Augmented Dickey-Fuller (ADF) Test and the Phillips-Perron (PP) Test to determine the order of integration for each variable involved in the import and export models. We applied both tests to all the time series included in each equation-regression, both in levels and first difference. Table 1 shows in the first column the order of integration of each of the variables involved in the model. The second and third columns reflect the values obtained for the Augmented Dickey-Fuller and Phillips Perron tests of the series in levels. Third and fourth columns present the critical values of the two tests. Fifth and sixth columns show the values of the two tests (Augmented Dickey-Fuller and Phillips Perron) for the series in differences. The last columns show the critical values of the two tests in differences.
Equation
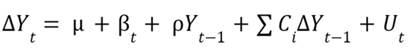
Table 1. Unit Root Test
| Ip | Zt | 5% Valor | ∆Z(t | 5 % valor crítico | |||||
|---|---|---|---|---|---|---|---|---|---|
| Variable | ADF | PP | ADF | PP | ADF | PP | ADF | PP | |
| LPIB (USA) | I(1) | -2.11 | -0.74 | -2.97 | -3.57 | -3.17 | -3.11 | -2.97 | -2.97 |
| LPIB Brasil | I(1) | -2.06 | -2.06 | -3.57 | -3.57 | -4.17 | -4.29 | -3.58 | -3.58 |
| LPIB México | I(1) | -2.20 | -1.89 | -3.58 | -3.57 | -5.61 | -11.41 | -3.58 | -3.58 |
| LPIB Canadá | I(1) | -2.09 | -1.23 | -3.58 | -3.57 | -3.56 | -3.42 | -2-97 | -2.97 |
| LPIB Holanda | I(1) | -1.30 | -0.43 | -3.58 | -3.57 | -2.99 | -2.98 | -2.97 | -2.97 |
| LPIB China | I(1) | -0.36 | -0.49 | -2.97 | -2.97 | -4.02 | -3.86 | -2.98 | -2.98 |
| LPIB | I(1) | -1.83 | -1.66 | -1.83 | -1.66 | -3.32 | -3.30 | -2.97 | -2.97 |
| Lx USA | I(1) | -1.92 | -1.92 | -3.57 | -3.57 | -4.91 | -4.95 | -3.58 | -3.58 |
| Lx Brasil | I(1) | -1.70 | -1.71 | -2.97 | -2.97 | -4.22 | -6-23 | -2.98 | -1.95 |
| Lx México | I(1) | -3.02 | -1.79 | -3.59 | -3.57 | -4.96 | -5.04 | -3.58 | -3.58 |
| Lx Canadá | I(1) | 1.66 | 1.66 | -1.95 | -1.95 | -6.02 | -7.57 | -1.95 | -1.95 |
| LxHolana | I(1) | -0.90 | -1.13 | -2.97 | -2.97 | -4.63 | -4.63 | -2.97 | -2.97 |
| Lx China | I(1) | 1.11 | 1.26 | -1.96 | -1.95 | -1.16 | -8.84 | -2.98 | -1.95 |
| Lx Lm USA | I(1) | -2.36 | -2.39 | -3.57 | -3.57 | -5.50 | -5.50 | -3.58 | -3.58 |
| Lm Brasil | I(1) | -3.39 | -2.10 | -3.61 | -3.57 | -4.47 | -4-39 | -3.58 | -3.58 |
| Lm México | I(1) | -3.52 | -2.28 | -3.58 | -3.57 | -4.84 | -5.34 | -3.58 | -3.58 |
| Lm Canadá | I(1) | 0.93 | 1.35 | -1.95 | -1.95 | -9.10 | -8.88 | -1.95 | -1.95 |
| Lm Holanda | I(1) | 0.44 | 0.68 | -1.95 | -1.95 | -6.87 | -7.87 | -1.95 | -1.95 |
| Lm China | I(1) | -1.66 | -1.51 | -3.57 | -3.57 | -4.15 | -4.55 | -3.58 | -3.58 |
| LITCB USA | I(1) | 0.40 | 0.30 | -1.95 | -1.95 | -3.44 | -3.57 | -1.95 | -1.95 |
| LITCB Brasil | I(1) | 0.74 | 0.97 | -1.95 | -1.95 | -7.21 | -7.50 | -1.95 | -1.95 |
| LITCB México | I(1) | 0.73 | 0.58 | -1.95 | -1.95 | -3.75 | -3.70 | -1.95 | -1.95 |
| LITCB Canadá | I(1) | 0.27 | 0.23 | -1.95 | -1.95 | -4.19 | -4.13 | -1.95 | -1.95 |
| LITCB Holanda | I(1) | 0.11 | 0.15 | -1.95 | -1.95 | -5.52 | -5.64 | -1.95 | -1.95 |
| LITCB China | I(1) | -0.26 | -0.16 | -1.95 | -1.95 | -7.05 | -6.95 | -1.95 | -1.95 |
Notes: The test is performed for all variables. The GDP is the Gross Domestic Product of the corresponding country,/are exports, M are imports, and RERI is the real exchange rate index. All the variables are taken in logarithms (L).
Source: Author calculations. Data from DANE, Bank of the Republic, and the World Bank.
The results let us to conclude that the values obtained (Zt) for the variables in levels for the Dickey-Fuller Augmented and Phillips Perron contrasts do not permit rejecting the null hypothesis of the existence of a unit root, which suggests that the variables considered in the study, have no constant meaning and its variance varies over time. This result is the opposite when we differentiate the variables from the statistics obtained (∆Zt), which allows rejecting the null hypothesis and accepting the alternative hypothesis, that is, that they do not have a unit root.
Estimate of long-term and shortterm elasticities
Upon verifying the unit root test for the variables involved in each model, we estimated equations or the export and import demand in Brazil, Canada, China, the United States, the Netherlands and Mexico. These countries were selected taking into account their share in the total foreign trade and various trade agreements they have entered into with Colombia. The GDP growth rate in Colombia for the 1986-2015 period was 3.56 %. The share of the external sector in this growth was 29.4 %. The countries that made the more significant contribution were: United States (34.5 %), Venezuela (6.4 %), Germany (5.1 %), Japan (4.2 %), China (3.9 %), Mexico (3.6 %), Brazil (3.0 %), the Netherlands (2.1 %), and Canada (1.9 %).
We outline the used equations in section 3.2.1, and performed the procedure described in the initial section of 3.2.1, i.e., we estimated the relationships of exports and imports in logarithms, and extracted its residual, such residual was then subject to the stationary test (Table 2)10. Then the difference equations were estimated, adding the one-period-lagged residual of the equation in logarithms.
Table 2. Unit Root Test of the residuals for long-term equations
| Critical Values Me Kinnon (2010) | |||||
|---|---|---|---|---|---|
| Country | "t" Exports | "t'Tmports | □=0,01 | □=0,05 | □=0,1 |
| Brazil | -3.757 | -4.510 | -4.293 | -3.740 | -3.452 |
| Canada | -4.809 | -6.350 | -4.663 | -4.119 | -3.835 |
| China | -4.793 | -3.929 | -4.663 | -4.119 | -3.835 |
| United States | 3.748 | -3.783 | -4.293 | -3.740 | -3.452 |
| The Netherlands | -4.561 | -4.106 | -4.663 | -4.119 | -3.835 |
| Mexico | -4.064 | -4.528 | -4.293 | -3.740 | -3.452 |
Notes: All waste were stationary.
Source: Calculation by the authors based on data from the DANE, Bank of the Republic, and the World Bank.
Tables 3 and 4 show the income and price elasticities of exports and imports, in the long-term and short-term for all the remaining variables considered. They also show the magnitude of the error correction factor.
Table 3. Long-Term Elasticities for Six Trading Partners of Colombia
Notes: The coefficients of income elasticity are significant at 0.99, while they were not significant for prices. Columns 2, 3,4 and 5 are income and price elasticities of exports and imports, accordingly. The last two columns (6 and 7) are the difference between income and price elasticities in exports and imports, accordingly.
Source: Calculation by the authors based on data from the DANE, Bank of the Republic, and the World Bank.
Table 4 Short-term Elasticities for Six Trading Partners of Colombia
Note: The coefficients of income elasticity are significant at 99 %, while they were not significant for prices. V. Adjustment is the annual percentage rate used to correct the diversion of the long-term relationship for both imports and exports.
Source: Calculation by the authors based on data from the DANE, Bank of the Republic, and the World Bank.
Analysis of Results
Based on the estimates in tables 3 and 4, we can argue that -except for China- Colombia has a long-term income elasticity of exports that is more elastic than imports of the selected trading partner group. As for the price elasticity of imports and exports, although most coefficients yielded the expected signs for most countries, they turned out to be not significant, allowing us to conclude that the exchange rate does not offer a strong influence, at least with these countries. However, since each trading partner’s characteristics vary, and estimates’ values vary, the income and price elasticities are analyzed below in disaggregated manner to extract individual characteristics.
In the case of Brazil, the results show that Colombian exports are highly sensitive to changes in Brazils income. While the income elasticity of exports shows a value of 2.86, the income elasticity of imports was 1.62. The price elasticity of exports in both functions was not significant (although the sign for the price elasticity of export demand was the expected sign), reflecting the scarce strength of the real exchange rate on trade with Brazil. The error correction term shows a higher speed of adjustment on the side of exports (48 %) compared to imports (23 %).
Concerning trade with Canada, the results indicate that, in the long term, if the domestic income of this trading partner increases by 1 %, then the demand for goods from Colombia (exports) will increase by 1.46 %, and the imports will only affect by 0.75 %, in the case of a GDP increase in Colombia. Concerning price elasticity, the signs were those expected in both cases (although the coefficient of price elasticity for exports was not significant), i.e., positive for exports and negative for imports, indicating that a devaluation of the real bilateral exchange offers advantages to increase exports and disadvantages for imports. The adjustment speed of errors has similar values, suggesting that the two functions are adjusted period by period at an average rate of 94 %.
The China estimates for the elasticity of imports and the elasticity of exports reveal that both are elastic, although the difference between these two is almost double. Long-term income elasticity in the import model reached a value of 6.95, whereas for exports, that figure was 2.78. Thus, if Colombia’s internal income increases by 1 %, imports grow by almost 7 %, i.e., 4.17 % higher than the percentage achieved by a 1 % increase in China’s GDP. The estimators for price elasticity of import and export demand were not significant for imports and significant at 10 % for exports. These results suggest the lack of effectiveness of the real exchange rate to reverse the negative trade balance that Colombia experienced with this country. Exports reach the adjustment factor at 98 %, while imports reach it at 11 %.
The United States results indicate that the elasticities of import and export income are elastic (greater than 1), although it must bear in mind that the difference is only 0.27. This means that -in the long term- if the US domestic income increases by 1 %, then the export demand increases by 1.47 %, whereas if the Colombian GDP increases by 1 %, imports from the United States will be affected by 1.19 %. The statistical data that collect the price elasticities of exports and imports were found to be non significant, thus showing the little relevance of the exchange rate in the decisions of foreign trade with this country. The error term adjustment occurs more on the export side (39 %).
The Netherlands’ elasticities show that if the economic agents in the Netherlands raise their income by 1 %, Colombian exports to this country will increase by 1.39 %. The effect is lower on the import side (0.73 %) since the import demand is inelastic to changes in the Colombian GDP. The price elasticity of import and export demand was insignificant, showing that the exchange rate policy does not exert pressure on foreign trade with this country. The error correction term shows a higher adjustment on the side of exports (48 %) compared to that of imports (23 %).
Finally, the elasticities estimated for Mexico show a positive difference in exports compared to that observed in imports. While a 1 % increase in Colombia’s domestic income increases imports from Mexico by 2.90 %, exports increase 3.44 % when the Mexican GDP grows. As for the price elasticities, the coefficients for both variables were significant for exports and not significant for imports, suggesting that the real exchange rate is not neutral for exports, contrary to the situation of imports. Furthermore, since the error correction term dropped 0.61 % for exports and 0.31 % for imports, we can infer that the adjustment is faster on the export side.
In conclusion, among the countries in the study, except for China, Colombia has a long-term income elasticity of exports that is more elastic than imports; and the exchange rate does not offer a strong influence, at least with this cohort of countries. Despite the existing papers in Colombia, there is no other paper with characteristics similar to this research. Ramirez and Florez (2017) made an inquiry that approaches this study; they estimated income and price elasticities of demand but in non-traditional exports. In any case, the main conclusion of these authors is that the demand for non-traditional Colombian exports is much more elastic for income than for prices in the analyzed regions.
Multilateral Thirlwall's Law and the Bilateral Contribution
Equation (12) is used to estimate Multilateral Thirlwall’s Law for Colombia, and the contribution of each trading partner to its total. In this regard, we can obtain the bilateral contribution for the six countries involved in the study through the following equation (see Nell 2003):
Table 5 shows the values for each expression contained in equation (17). Column (1) gathers the elasticity of exports for each trading partner (; column (2) outlines the elasticity of imports (; column (3) shows the growth rate of six trading partners (; column (4) captures the share of exports within the total (; column (5) reflects the participation of imports in the total (; column (6) represents the product between column (1) and (4), i.e., the elasticity of exports multiplied by the percentage share of exports within the total; column (7) gathers the result of multiplying the elasticity of imports by their share within the total against the GDP growth rate for each country; and column (8) contains Multilateral Thirlwall’s Law,.
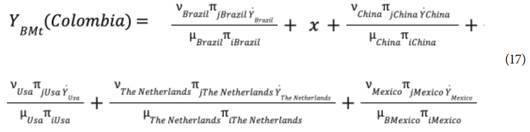
Table 5. Thirlwall's Law and its contribution to six trading partner countries of Colombia
Notes: This table shows the values for each expression contained in equation (17). Column (2) gathers the elasticity of exports for each commercial partner (; column (3) is the elasticity of imports (; column (3) shows the growth rate of six commercial partners (; column (5) captures the share of exports within the total (; column (5) reflects the participation of imports in the total (; column (5) represents the product between column (1) and (4), i.e., the elasticity of exports multiplied by the percentage share of exports within the total; column (8) gathers the result of multiplying the elasticity of imports by their share within the total against the GDP growth rate for each country; and column (10) contains Multilateral Thirlwall's Law,.
Source: Calculation by the authors based on data from the DANE, Bank of the Republic, and the World Bank.
Upon analysis of the results of this table, the following can be inferred: Multilateral Thirlwall’s Law for Colombia (taking the six trading partners) for the period 1986-2015 is 2.06, a figure that is below the growth rate of the economy, and reached 3.56 %. This indicates it is a good predictor to forecast the growth of Colombian economy.
The most interesting analysis of this result is seen when the review is extended to the contribution of each country to the obtained (23.68 %). The greatest contribution is made by The Netherlands with 14.98 %, due to two important facts: (i) while the share of their exports reaches 3.3 %, their contribution to the total import market does not reach 1 %, and (ii) the income elasticity of exports is elastic, while the income elasticity of imports is inelastic; this generates a trade surplus for Colombia.
It is not surprising to see that a country like China -which yields the highest growth rate of its GDP (8.77) - does not represent a significant weight in its contribution to 1.03). We can explain this situation dut to the strong difference between the income elasticity of imports and exports (4.17 in favor of imports) and the contribution to foreign trade by this country (4.2 %, the difference between the contribution of imports and exports within each total).
We explain the United States contribution in (3.73) with two reasons: (i) The difference between the income elasticity of the external sector (exports and imports) is not significant (0.28 %), and (ii) while the contribution of this country in the external sector reaches 37.8 %, their share in total imports represents 31.2 %; i.e., there is a positive difference toward the export sector at only 6.6 %.
The contribution of Canada in reaches the 1.987 %; which we by a greater elasticity of exports compared to imports, and a greater difference within the total exports compared to imports.
Although Brazil and Mexico show greater export elasticity than the import elasticity, they represent a very low contribution in (1.16 and 0.78 %, respectively); we explain this by their small contribution to the export market and their high contribution to the total of total imports.
Dynamics of the multilateral contribution of each trading partner.
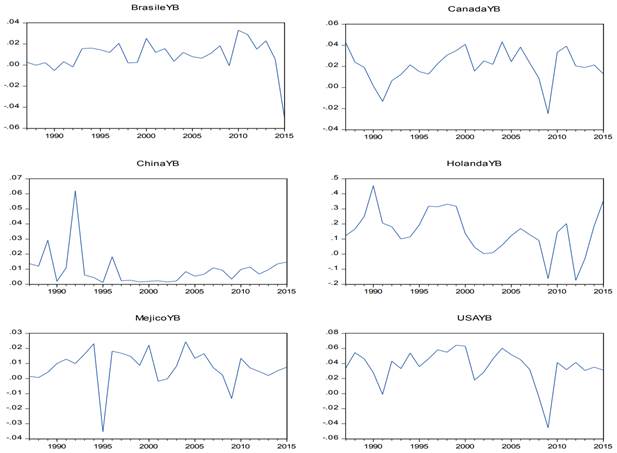
Figure 1 contains the dynamics of the multilateral contribution to Colombian growth under Multilateral Thirlwall’s Law, for each of the six countries considered in the analysis. We obtained the calculation of for the 1987-2017 period assuming that the income elasticities of imports and exports remain constant over time. In general, we note that Multilateral Thirlwall’s Law has been moving within the circle of its average in all countries. However, it is important to note that the movements of the numerator (ⱱ ji π ji Ý j ) have been mainly due to changes in the countries’ domestic income growth rate.
Source: Calculation by the authors based on data from the DANE, Bank of the Republic, and the World Bank.
Figure 1. Dynamics of "Multilateral Thirlwall's Law" for each trading partner.
The component that corresponds to the contribution of exports within the total has not recorded substantial amendments (except for the Netherlands) to allow inferring that trade relations with these countries have been evolving toward a positive balance, i.e., a larger movement of exports compared to imports.
It is worth highlighting that China, Colombia’s largest trading partner with the greatest average growth rate (8 %), has a null dynamic in the numerator because it has been cushioned with a higher increase in the share of imports compared to the findings for exports. The United States does not reflect significant changes in because, although a higher elasticity of exports and a significant share of them affects the numerator (ⱱ ji π ji Ý i ), the denominator (μ ij π ij ) exerts an upward force caused by a significant market share of imports within the total.
Conclusions
The comparative analysis of income elasticities of exports for Brazil, Canada, the United States, the Netherlands, and Mexico proved to be more sensitive to income changes in these countries than the elasticity of imports affected by changes in Colombia’s GDP; it means that if the domestic income of this countries grows, the demand for Colombian exports increases. The opposite was found in the case of China, i.e., the elasticity of imports nearly doubles in sensitivity to the elasticity of exports, evidencing that Colombia is at a disadvantage in the trade share with this country. This implies that one way to stimulate growth in Colombia is to promote trading activity with these countries, especially exports, except for China.
Although the coefficients that accompany the price elasticity of exports and imports -i.e., the real bilateral exchange- yielded the expected sign in most cases, they turned out to be statistically not significant; this allows arguing that this index (devaluation) is not effective as a tool to influence the trading outcome or, in other words, a large part of the products and services are marketed independently from the variability of the real exchange rate. This implies that the exchange policy is not useful in boosting the external sector of Colombia, at least with the six countries in this study. This result contrasts with the devaluation policy that has traditionally been applied in Colombia to boost exports.
The results of the short-term dynamics of the model show that the difference in the bilateral real exchange rate (exports and imports) in the logarithm is not statistically significant. In contrast, the results of the difference between Colombia’s domestic income in the logarithm and the countries analyzed were significant (at a 5 % level). This means that the demand for imports and exports reacts immediately to domestic income changes and not to actual bilateral exchange variations.
The coefficient that collects the error correction term (ECM), which is the speed of adjustment in time, was significant, and the expected sign was obtained for all countries. However, it was found that the highest values of this coefficient occurred in Canada, China, and Mexico, showing signs of a quick adjustment to the balance. In the case of Canada and China, around 91 % of the imbalance in the previous (annual) period is adjusted to the long-term balance in the current period. In other words, in the absence of changes in other variables, the high coefficient indicates a quick adjustment to the balance among variables. The country that showed the lowest adjustment in long-term relationships was the Netherlands with 12 %. On the side of imports, the highest coefficients were obtained by the Netherlands (85 %) and Canada (93 %), while the lowest was China (11 %).
Multilateral Thirlwall’s Law of Colombia yielded a value of 2.06 % that, compared to the economy’s growth rate in that period (3.56 %), is lower, suggesting that it is a good predictor of behavior for the economic growth of the economy. However, it only gathered the effects of six countries.
The analysis of the contribution by each country to Multilateral Thirlwall’s Law showed that the Netherlands is a favorable partner for Colombia, mainly due to the positive difference in its weighting or trading share (i.e., the share of exports within the total was more dynamic than that offered by imports). China, on the contrary, showed a higher sensitivity of imports to the Colombian GDP, and its contribution to foreign trade was higher in imports.
Brazil and Mexico are countries that -considering the income elasticities of exports and imports and their trading shares in the external sector- do not offer important advantages for Colombia. The results of the United States show that, while it is true that they are the leading trading partner of Colombia, their contribution to exports and imports and the slight difference in the income elasticities do not show any structural dynamics that allow changing such composition or any greater trading advantages for the future.
The domestic income of partner countries is the factor that has mainly determined the behavior of Multilateral Thirlwall’s Law, indicating that Colombia’s commercial structure with these countries has not changed substantially. This shows there have been no policies and strategic and determining bilateral and multilateral agreements that allow the country to take advantage of its trade balance, particularly derived from the higher income elasticity of exports that Colombia has with this set of countries.
From the point of view of the trade balance, these results indicate that -given the situation of Colombia with these countries - significant changes or reductions in the trade deficit could occur if there are greater dynamics of the GDP of such partners and a final recomposition of the country’s export structure. The results indicate that for Colombia to boost its growth, it is necessary to rethink its trade policy and productive structure.
Finally, in terms of commercial and economic policy, this work shows that (i) the Thirlwall model is a valuable and adequate tool to explain and understand the effects of the external sector on the growth of the Colombian economy; (ii) the promotion and diversification of exports are the most appropriate economic policies to boost the external sector and Colombian growth; and, (iii) devaluation is an inefficient policy to boost the Colombian external sector. These results largely coincide with the national and international literature Gouvea, R. Lima, G., 2010 y 2013; Romero, J., McCombie, J., 2016.

