


Services on Demand
Journal
Article
 English (pdf)
 Article in xml format
 Article references
 Send this article by e-mail
Indicators
-
 Cited by SciELO
 -
 Access statistics
Related links
-
 Cited by Google
 -
 Similars in
SciELO
Similars in
SciELO -
 Similars in Google
Share

 Permalink
Tecciencia
Print version ISSN 1909-3667
Tecciencia vol.8 no.15 Bogotá July/Dec. 2013
https://doi.org/10.18180/tecciencia.2013.15.1
DOI: http://dx.doi.org/10.18180/tecciencia.2013.15.1
Automatic Quantification of the Degree of Flexion on Upper Extremity through Analysis of Monocular Video
Cuantificación automática del grado de flexión en extremidad superior por análisis de video monocular
José D. Ávila1, Gerardo Ceballos2, Valentín Molina3, Hermann Dávila4
1. Universidad de los Andes (ULA), Mérida, Venezuela, jdavilapaz@gmail.com
2. Universidad de los Andes (ULA), Mérida, Venezuela, gerardoacv@gmail.com
3. Escuela Colombiana de Carreras Industriales (ECCI), Bogotá, Colombia, amolinam@ecci.edu.co
4. Escuela Colombiana de Carreras Industriales (ECCI), Bogotá, Colombia, coordinacion.biomedica@ecci.edu.co
Received: 13 Jun 2013 - Accepted: 28 Oct 2013 - Published: 30 Dec 2013
Abstract
A method is introduced to obtain information on the movement of a human upper extremity based on automatic video analysis. This study used basic techniques of image segmentation and contour curvature calculation of the segmented extremity, as well as temporary dynamic alignment of sequences to track the two critical points that mark the elbow. Additionally, the median axes of the arm and forearm were calculated to then obtain curves of the extremity’s flexion angle over time. This methodology was used with seven individuals and the proposed automatic measurement was compared to the semi-assisted measurement in which a physiatrist conducted measurements on images by using a computer. The results suggest that this methodology could serve as a support tool in medicine for the evaluation of different diseases that affect the mobility of the extremities.
Keywords: Temporary dynamic alignment, Flexion-extension angle, Quantification, Curvature of a signal, Segmentation.
Resumen
Se presenta un método para obtener información del movimiento de una extremidad superior humana en base al análisis automático de video. Se usan técnicas básicas de segmentación de imágenes, cálculo de la curvatura del contorno de la extremidad segmentada y se utiliza Alineamiento Dinámico Temporal de Secuencias para hacer seguimiento de dos puntos críticos que marcan el codo. Adicionalmente, se calculan los ejes medios del brazo y antebrazo para luego obtener curvas del ángulo de flexión de la extremidad en el tiempo. Se aplica esta metodología en siete personas y se compara la medición automática propuesta con la medición semiasistida en la que un fisiatra realiza las mediciones en imágenes haciendo uso de un computador. Los resultados sugieren que esta metodología podría servir de herramienta de apoyo en medicina para la evaluación de distintas enfermedades que afectan la movilidad de las extremidades.
Palabras clave: Alineamiento dinámico temporal, Ángulo flexo-extensión, Cuantificación, Curvatura de una señal, Segmentación.
1. Introduction
Visual systems to track human extremities on video can be classified into two categories from the use or not of anatomic markers. Using markers to indicate the region of interest largely simplifies the problem of tracking human movement, hence, these have been successfully used in sports analysis environments and in capturing movement to create animations. However, this type of technology is quite costly and is only executed in supervised environments.
Video analysis systems are only practical without markers, given that they are more economic, simple, and rapid regarding patient preparation. Methods based on models are the most popularly used, varying from a simple 2D model to others more sophisticated in 3D [1] [2]. This type of tracking is conducted by making the image characteristics coincide with the shape model, using the knowledge of the characteristics of the human body and its movement. Most of these tracking systems require manual starting according to specific parameters for each subject under study [3], which could be a disadvantage for clinical applications like evaluation of patients with motor problems during a medical consultation.
This work consists of a real-time visual tracking system without anatomic markers. The system uses a low-resolution (1.3 MP) web camera to capture images. Each video frame acquired is segmented, thus, extracting the contour curvature of the region of interest (upper extremity). Tracking of the contour frame by frame on video is carried out through the temporary dynamic alignment of sequences of the contour curvature from the previous frame with that of the present frame [4] [5]. Two key points are detected, which mark the elbow articulation and which serve to divide the upper extremity into arm and forearm. On each segment, arm and forearm, the medial axis is extracted. The angle between the medial axes will be the extremity’s flexion-extension angle. After this process a curve of angles is available whose information is used to make the respective calculations of the extremity’s range of motion and the mean rates with which its flexion and extension movements are executed.
1.1. Problem approach
Seeking a methodology for the quantitative analysis of the motion of the extremities of the human body represents an important task to implement low-cost systems aimed at evaluation and diagnosis of patients with trauma on the upper or lower limbs of the body [6] [1] [2].
2. Method proposed
The methodology proposed to obtain the range of flexion motion (RMflex), range of extension motion (RMext), rate of flexion (Vflex), and rate of extension (Vext) comprises the following processes applied to each video frame (352 x 288 pixels):
- Segmentation:
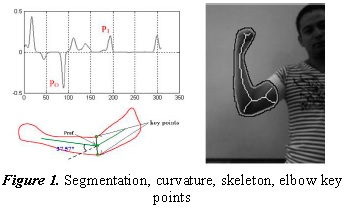
The segmentation method was applied via Otsu’s gray scale image thresholding [7] [8] [9], and the object with the centroid closest to the center of the image was selected, which must correspond to the human extremity under study. It should be noted that using controlled lighting, light colored clothing on the patients and a white background reduced considerably the problems caused by unbalanced lighting during the segmentation process (Figure 1).
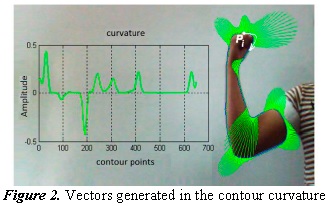
The curvature vectors can, thus, be observed in Figure 2 as an additional representation of the concept of curvature. In said figure, Pi is the starting point to generate the contour curvature.
- Contour curvature:
From the segmented object, select the pixel closest to the upper left corner of the image and from there track the contour of the object [10]. To obtain a softer contour, an averaging filter was applied to the contour’s coordinates. Thus, we obtained the closed contour c(n)=[x(n), y(n)], as observed in Figure 1. The contour curvature is calculated according to the following formula:
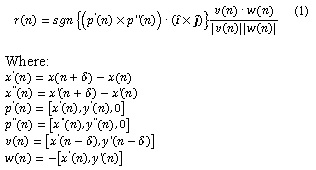
î and ĵ represent the unit vectors in the direction of coordinates x and y of the contour’s pixels. We used a value of x=15 and the sgn{x} function represents the sign of x. Figure 1 shows the curvature signal corresponding to the segmented extremity.
- Alignment of the curvature:
By applying temporary dynamic alignment of sequences, the current contour curvature is aligned to the contour from the prior video frame. The algorithm of temporary dynamic alignment of two curvature signals, a=[a1,a2,…,an] and b=[b1,b2,…,bm], is based on the construction of a dynamic programming matrix in which each matrix element [î,ĵ] represents a similarity measurement between a=[a1,a2,…,ai] and b=[b1,b2,…,bj]. The dynamic programming matrix, M, is constructed in the following manner:
Initialization:
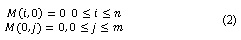
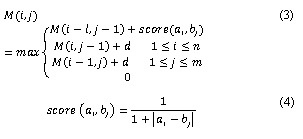
Where (4) represents the similarity between the value of curvature ai and the value of curvature bj. As noted in Eq. (3), the value of an element from the matrix stems from considering the maximum among four elements, we will call case 1, 2, 3, 4, when the maximum turns out to be the first, second, third, or fourth of the arguments of the function. d has a value of 0.4 (called penalization through insertion of space) if the summand with d in Eq. (3) stems from a case 1 and has a value of -0.05 (called penalization through extension of space) in another case.
It is necessary to construct a Ptr matrix of pointers where each Ptr(i,j) element points to an element from the M matrix, depending on what case comes from the value of M(i,j):
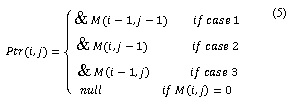
“means direction in memory of”. The construction of each alignment between the two is carried out by seeking the maximum in the programming matrix, M. From the position of the local maximum follow up of the pointers until reaching a null pointer. Each position [k,g] pointed in that follow up represents the corresponding pairing between ak and bg. For a detailed description of this procedure see [4] [5].
The curvature signal corresponding to the first video frame is aligned to a curvature template belonging to a pre-established dictionary of contour curvatures of human extremities. The two curvature values corresponding to the elbow have been labeled on the templates (see P0 and P1 in Fig. 1 and Fig. 2), which is why in the subsequent alignments follow up can be conducted of these characteristic points of the elbow.
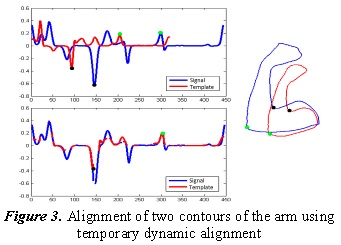
An example of alignment between two curvature signals, one from the first video frame with a template from the data base, can be seen in Figure 3. It can be noted how the alignment algorithm inserts spaces to maximize the alignment of similar curvature values. This alignment, one from a curvature template with that from the first video frame is the most critical; from the second video frame on, the alignments are more exact given that little variation is expected in the shapes of the contours in consecutive frames.
The fact that in a video frame the starting point of contour tracking is in a different anatomical position to that of the prior frame could be considered a problem, given that curvature waves appearing at the beginning of one of the signals will have their corresponding at the end of the other curvature signal. This could be solved if, before applying the process of temporary dynamic alignment of sequences to one of the curvature signals (that of the current frame or of the prior) an exact version of itself is concatenated, producing the effect of going over the closed contour twice. If the algorithm always tracks the contour in the same sense, it ensures that the curvature of the prior frame achieves its similar pattern in the current frame.
- Skeletonization:
Using already known algorithms on image analysis [9], we obtain the skeleton of the segmented extremity. The skeleton is a first approach to the contour’s medial axis (Figure 1). Separation of arm and forearm: upon aligning the curvature of the current frame with that of the prior frame, we obtain the two critical points of the elbow from the current frame. By drawing a straight line between them, the segmented object is divided into two parts; one belonging to the arm and the other to the forearm.
- Calculation of median axes of the two segments of the extremity:
The line dividing the arm into two parts also cuts the skeleton obtained from the complete extremity. In each skeleton segment obtained (arm and forearm) we select the skeleton branch closest to the segment’s centroid. For each segment of the extremity, the medial axis is constructed by prolonging a line from the distal end (with respect to the elbow) of the skeleton branch selected toward the midpoint between the two characteristic points of the elbow. For the forearm, the skeleton branch selected is truncated by selecting only 70% of its pixels proximal to the elbow to keep the part of the skeleton, given by the shape of the hand, from influencing on the inclination of the forearm’s medial axis.
Upon obtaining the between the medial axes for each video frame, we can construct a flexion-extension angle curve over time. From the analysis of the flexion-extension angle curves over time, we can obtain the range of motion in flexion and extension and the rate of flexion and of extension in the following manner.
- Range of motion:
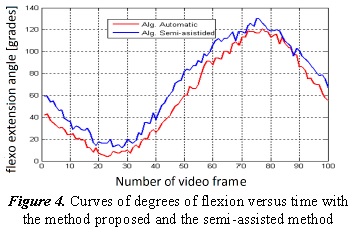
The measurement of the angle between the median axes frame by frame produces an undulating signal for several flexion and extension actions of the extremity, where each rise represents a flexion movement and each drop represents an extension movement (Figure 4). By averaging the value of the peaks of this oscillating signal, we obtain the range of flexion motion; by averaging the values of the valleys, we obtain the range of extension motion.
- Flexion-extension rate:
The difference of the angle measured between frame and frame divided into the camera’s sampling period (30fps) determines the forearm’s rate of angular motion with respect to the arm. If we average said calculation for each of the points of the ascending segments from the oscillating curve (degrees vs. time) we obtain the rate of flexion and if we do this for the descending segments we obtain the mean rate of extension.
3. Results
The methodology proposed was evaluated in four patients from the Neurology service at the Universidad de Los Andes Hospital and in three healthy individuals. Table I shows the range of flexion, range of extension, mean rate of flexion, and mean rate of extension measured automatically in the seven subjects.
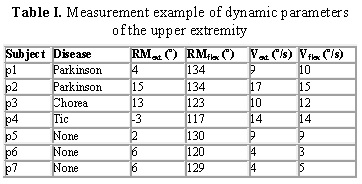
In Table I, Parkinson, Chorea, and Tic are names of pathologies that affect motor control of the extremities. A p2 and p3 limitation in the arm’s extension range of motion can be noted. Additionally, it is interesting that the flexion and extension rates measured in patients with neurological problems are higher than in normal subjects. In any case, these observations only seek to illustrate the usefulness offered by implementing these types of automatic measurements. To classify pathologies and correlate the data, a more exhaustive and specific study would be needed.
Figure 4 shows an example of a segment of the curve of degrees of flexion versus time obtained via the automatic method proposed, along with a curve of the measurement with the semi-assisted method. The semi-assisted method consists in a physiatrist using a computer to mark in each image the key points of the extremity and who measures the flexion angle of the extremity according to that professional’s anatomic and procedural knowledge. In the example in Figure 4, we note that the curve resulting from the automatic process presents a tendency to represent degrees of flexion below those measured by the semi-assisted method. We think this difference could be the result of a better location of the key points to be used by the physiatrist’s measurement. A factor that could, thus, influence the automatic measurement and which we think will be worth dealing with in future research is the effect produced by the folds between the arm and forearm, formed on the anterior face of the elbow, which could deviate the median axes from their ideal location in the skeletonization process. The ideal orientation of the median axes should be following the osseous structures.
4. Conclusions
The results obtained suggest that the implementation of a system based on our methodology could serve as support in evaluating patients with neurological diseases, given that it would offer the possibility of performing an objective follow up of the evolution of the disease or its improvement with treatment. It would be possible to keep a record in days and months of the patient’s evolution regarding the flexion and extension range of motion, flexion and extension rate, and other variables extracted from the curve of degrees of flexion versus time. Not using markers for recognition of key points in the image represents an advantage when reducing the patient’s preparation time to take the video. However, a more specific study is required to contrast our method with others using markers and, thus, analyze in detail the advantages and disadvantages of one modality over another. It would be very interesting to conduct a morphological analysis of the degrees versus time curve, seeking to detect and classify neuromuscular pathologies. This work could evolve into the study of morphological images of the arm by using machine learning methods to achieve a training process to better recognize the location of bones on the plane and, thereby, have a better reference of the medial axes of arm segments.
References
[1] T. A. Zessiewicz y R. Hauser, «Medical treatment of motor and non-motor features of Parkinson's disease.,» American Academy of Neurology, vol. 3, nº 1, pp. 12-38, 2007. [ Links ]
[2] F. G. a. E. R. F. Martinez, «Video analysis for estimation of human movement.,» Revista facultad de medicina, vol. 17, nº 1, 2009. [ Links ]
[3] H. Hu, Y. Tao y H. Zhou, «Integration of Vision and Inertial Sensors for Home-based Rehabilitation,» de Workshop on Integration of Vision and Inertial Sensors IEEE International Conference on Robotics and Automation, Barcelona, 2005. [ Links ]
[4] G. Ceballos y L. Hernández, «Data processing and pattern recognition in high-throughput capillary electrophoresis,» de Signal Processing Conference, Glasgow, 2009. [ Links ]
[5] V. Molina, G. Ceballos y D. Hermann, «Ecg Signal Analysis Using Temporary Dynamic Sequence Alignment.,» Revista TECCIencia, vol. 7, nº 14, pp. 11-16, 2013. [ Links ]
[6] American Academy of Child and Adolescent Psychiatry., «Facts for Families. Technical Report 35.,» American Academy of Child and Adolescent Psychiatry., 2004. [ Links ]
[7] M. Sezgin y B. Sankur, «Survey over image thresholding techniques and quantitative performance evaluation.,» Journal of Electronic Imaging, vol. 13, nº 1, pp. 146-168, 2004. [ Links ]
[8] N. Otsu, « A threshold selection method from gray level histograms.,» Systems, Man and Cybernetics., vol. 9, nº 1, pp. 62-66, 1979. [ Links ]
[9] W. Pratt, Digital Image Processing: PIKS Scientific Inside, Willey, 2007. [ Links ]
[10] L. da Fona Costa y R. Marcond, Shape Classification and Analysis: Theory and Practice, Second Edition (Image Processing Series), CRC Press, Taylor & Francis Group, 2009. [ Links ]
