


Services on Demand
Journal
Article
 English (pdf)
 Article in xml format
 Article references
 Send this article by e-mail
Indicators
-
 Cited by SciELO
 -
 Access statistics
Related links
-
 Cited by Google
 -
 Similars in
SciELO
Similars in
SciELO -
 Similars in Google
Share

 Permalink
Tecciencia
Print version ISSN 1909-3667
Tecciencia vol.8 no.15 Bogotá July/Dec. 2013
https://doi.org/10.18180/tecciencia.2013.15.8
DOI: http://dx.doi.org/10.18180/tecciencia.2013.15.8
Generation of a mobility device for disabled people drive, using the method of quality function
Generación de un dispositivo de movilidad para personas con discapacidad usando el método de función de calidad
Leonardo Emiro Contreras Bravo1, Wilmar Augusto Granados2
1. Universidad Distrital Francisco José de Caldas, Bogotá, Colombia, lecontrerasb@udistrital.edu.co
2. Universidad Distrital Francisco José de Caldas, Bogotá, Colombia, wagranados@udistrital.edu.co
Received: 28 Oct 2013 - Accepted: 05 Nov 2013 - Published: 30 Dec 2013
Abstract
This article shows the selection and development of a design to generate a mobility device for physically disabled people between 8- 15 years with T12 pathologies and comorbidities are not in upper. Begin with obtaining the customer’s requirements, and the transformation of these from the tool called quality function (QFD- Quality Function Deployment) and the use of different assessment methods ending condensing all the various elements for the two parts: the client and the producer.
After a quantitatively decipher the qualitative, we proceed to develop a systemic process that generates particular elements to reach the design concrete steps by joining the technical elements and requirements of the client (user). Each design methodology used for the elaboration of the designs is explained briefly.
In the final part are done several designs and select a model. Whereby it is the result of quality house in graphical and clear. Also shows which were the characteristics, materials and devices selected by the tool called Quality Function Deployment (QFD) to take them into account in the final design.
Keywords: Disability, Engineering, Mobility, QFD, Quality.
Resumen
Este articulo muestra el desarrollo y selección de un diseño para generar n dispositivo de movilidad para personas con discapacidad motriz entre 8 a 15 años, con patologías T12 y que no tengan patologías concomitantes en miembros superiores. Inicia con la obtención de los requerimientos del cliente, y la transformación de estas a partir de la herramienta llamada función de calidad (QFD Quality Function Deployment) y el uso de diferentes métodos de evaluación que finalizan condensando todos los distintos elementos a favor de las dos partes: la del cliente y la del productor.
Después de descifrar de una manera cuantitativa lo cualitativo, se procede a desarrollar un proceso sistémico que genere elementos particulares para llegar a concretar el diseño por medio de pasos que unen los elementos técnicos y los requisitos del cliente (usuario). Cada metodología de diseño usada para la elaboración de los diseños es explicada brevemente.
En la parte final se realizan varios diseños y se selecciona un modelo. Por medio del cual se representa el resultado de la casa de la calidad de una manera gráfica y clara. Además muestra cuales fueron las características, materiales y dispositivos seleccionados por medio de la herramienta llamada función de calidad (Q.F.D.) para tenerlos en cuenta en el diseño final.
Palabras Clave: Calidad, Discapacidad, Ingeniería, Movilidad, QFD.
1. Introduction
According to [1], Colombia has around 4'992 .000 disabled’s equivalent to 12% of the population, on the other hand by 2005 it was determined that there are about 6.3 per 100 persons with a permanent disability (Census 2005) where part of the disabled population is between 8 and 13 years. (Figure 1)
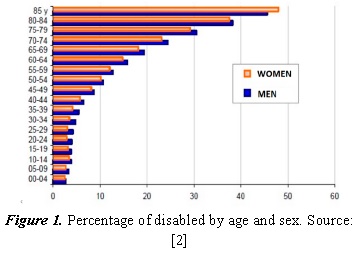
Important information from the 2005 census is that the populations with some disability are in the ages between 5 to 9 representing 3 and 4%, and the ones from 10 and 14 are about 4 and 5 %. This means that there is a population group that may need assistance to come from a mechanical device such as a wheelchair or other mobile device.
At present the population between 8 and 15 years is a complex population because the natural development of the individual does not allow to establish a pattern of measures defined leading to have a shortage of designs that allow flexibility on anthropometric measures, in addition nowadays a person with disabilities who needs to use wheelchairs may need an auxiliary aid from another person, a wheelchair has different prices, based on factors such as materials, functionality, etc. But there are few that can be low in price and easily adapt to a disable person. According to preliminary data from the Census, the prevalence rate for the total population in Colombia in state of disability is (6.3 %) being higher in men (6.6%) than in women (6.1%). “ [2].
Considering the number of limitations. (Figure 2) per person, 71.2 % have a limitation, 14.5 % of the people reported to have two, three limitations 5.7% and 8.7 % three or more permanent limitations. Of all persons reporting limitation, 29.3% have limitations to move or walk.
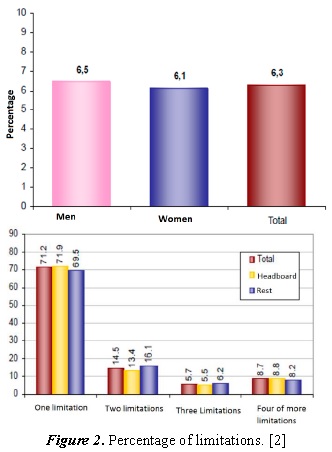
“According to the data obtained from [2], 29.3 % have disabilities to move or walk, a portion of that percentage is part of young people 8 to 13 years, and it is also very interesting to note that one of the main limitations of the disabled population is conforming by young people as evidenced by Figure 2. This suggests that it is important to help those people with some mobility device.
2. Overview Q.F.D. - the role of quality
QFD was developed at the end of the 1960s, coinciding with the introduction of original Japanese products. From the beginning it was considered part of the total tooling quality management, known in that country as Total Quality Control (TQC), and was specifically designed for the creation of new applications and products.
2.1. Structure Q.F.D.
The analogy used to explain how it is structured QFD, is a house [3]. Figure 3 shows how a QFD matrix is structure. Basic. The left side, part 1, is the input of the client. This is the stage in which the process of the customer requirements are determining related to the product. To satisfied the requirements of customers, the producer works with certain performance specifications, and asks its suppliers to do the same. This is the interior of the ceiling of the home or component 2. One of the questions we will answer the QFD process will be: Are there enough our current manufacturing requirements to satisfy or exceed the requirements of our customers?
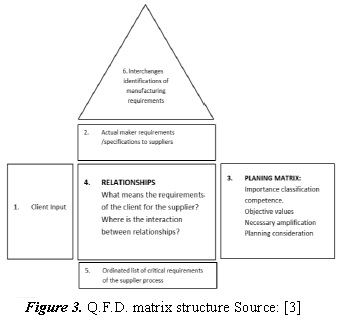
The right wall of the home, component 3 is most widely associated with QFD component; it is used to translate customer requirements or plans to meet those requirements. Includes the setting of customer requirements in a matrix and the processes of manufacturing in other, prioritizing customer requirements and taking decisions regarding the necessary improvements in the manufacturing processes.
In the center of the house, component 4, customer requirements are translated in terms of manufacturing or expressions. Answering questions as: How the design will be? Which are the manufacturing processes? The bottom or base of the home, component 5 is where the process requirements that are critical are prioritized. What manufacturing requirement is more important in terms of meeting or exceeding customer requirements? What is next, and so on? The exterior roof of the house, part 6, is where the trade- offs are identify. These are trade- offs that have to do with the requirements of the producer. In view of the requirements of its customers and their manufacturing capabilities.
2.2. The process Q.F.D.
A complete cycle of the QFD process (Figure 4) it is six constituent by six similar matrixes to the figure above. The purpose of each matrix is explained in the following sections:
- The matrix 1 is used to compare customer requirements with the technical specification of the product. All other matrix originates from this first matrix.
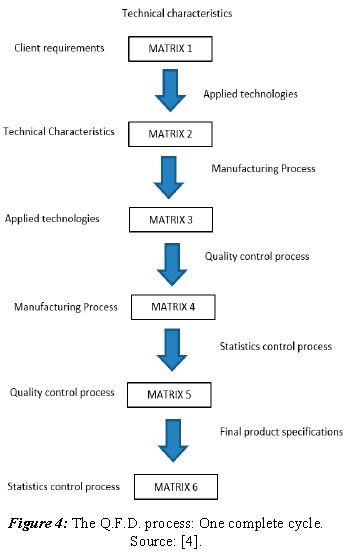
The matrix 2 is used to compare the technical characteristics in matrix 1 with their associated technologies applied. They serve to answer questions like: What the customer want? What are the technical requirements related to the features that the customer wants? What technologies are needed to meet or exceed customer requirements? In this paper only these two arrays are used because they are necessary to develop the design of the mobile device.
- The matrix 3 is used to compare the technologies applied to the matrix 2 with its associated manufacturing processes.
- The matrix 4 is used to compare the manufacturing processes of the parent 3 processes associated quality control.
- The matrix 5 is used to compare the processes of quality control processes with statistical process control.
- The matrix 6 is used to compare the parameters of statistical process control specifications that have been developed for the finished product.
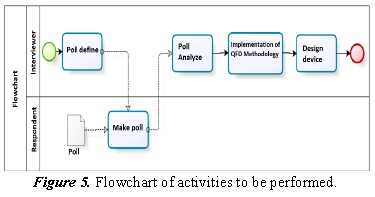
The methodology used in the development of the two QFD matrices necessary for product design is briefly described, this summary is shown in Figure 5.
2.3. Capturing customer demands (voice of the customer).
In order to capture customer requirements (RC), the survey was chosen because it is a very easy method of working which sources that will communicate with people directly affected ( SCI pathology of T12 down and have no comorbidities in upper limbs ) [5], centers for the disabled, disabled families, research centers, and self-knowledge.
To develop the first matrix, it was necessary to have information on four factors:
- The real needs of customers.
- How customers value each of the demands.
- What are the main complaints raised by customers about the product.
- What is your opinion of our product customers and competitors leaders, by reference each of the identified needs?
From the above sources, 120 customer requirements (CR) were obtained.
2.4. Structuring customer requirements.
To handle customer needs, these should be structured in hierarchies. The primary needs are generally the first 5-10 needs to set the strategic direction of the product. For example, “that it will be comfortable“ is a primary need for the carrier. Secondary needs are developed from basic needs; each primary need generates approximately 3 and 10 secondary needs. [6] /P>
2.5. Prioritization of customer requirements.
Not all customer requirements (RC) are equally important in the eyes of customers, the hierarchical analysis method also known as (AHP) based on pairwise comparison, to correctly determine the importance of each application will be used. In this case, technicians and customers utilize a ranking of 1 to 5, where 5 indicate the highest priority and 1 the lowest.
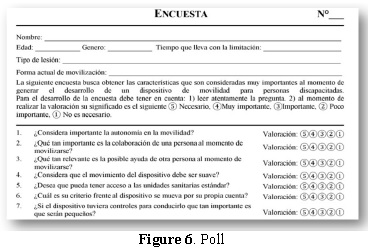
The priority is one of the factors that contribute to the calculation of the total weight of each characteristic CT technique (the intensity of the relationship between customer requirements (CR) and Specifications (CT) is the other). Each question was evaluated considering conduct the valuation shown in Figure 6.
2.6. Customer rating
The target population evaluates existing search criteria to know what their level of satisfaction and determine the bias of the selected criteria; these criteria are communicated through questions that are stored in a survey.
According to [7], interviewing about 20 or 30 customers would be sufficient to identify 90% or more of the requirements in a relatively homogeneous segment. So after the implementation of the survey, tabulation of data is performed by a matrix analysis done with the help of Excel software. Performing the analysis showed that there were 41 primary needs: autonomy, collaboration to move, smooth movement, access to medical units, human energy, light, medium wheel for steering, mechanical brakes, sitting position, among others.
2.7. Preparation of the list of parameters the technical specifications (ct).
Technical specifications, also constitute a hierarchical tree . Through the brainstorming method ( brainstorming ) the following elements are obtained, and are listed below: Full Weight, Weight chassis, Height, Width, Length,Diameter of front wheels, Height of the seat, high backs .
2.8. Weighting, evaluation and correlation
2.8.1. Relations between client and technical specifications.
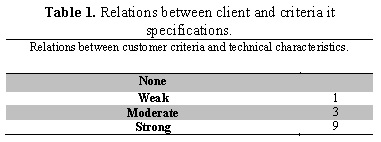
In the central frame of the matrix was assigned a value to inform the level of importance that the relationship has between the rows of RC and the columns of CT. This correlation expresses quantum affects to each, RC one CT specific.
- First criterion: weak, states that the relationship found between the technical characteristics and the requirements of the client remains of great importance. (Table 1).
- Second criterion: moderate, this criterion is assigned when a relationship between the variables exists.
- Third criterion: Strong, that represents the existence of one high dependence on the relationship between the criteria to be analyzed.
2.8.2. Relationship between specifications.
The relationships between technical features are described briefly below:
- First criterion is: very strong, it is related with the symbol “+“means that the relationship of the technical characteristics has a level of dependence very high.
- Second criterion is : strong, it relates to the symbol "+" this relationship is a dependency but no very strong.
- Third criterion is: nothing there is any degree of relationship.
- Fourth criterion is: weak and it symbolizes " - " represents a high level of independence
- Fifth criteria is: Very weak, and it is assigned the symbol “- “that he wants to represent a high level of independence.
2.9. Level of difficulty.
There are 5 levels which are described to determine the level of importance that exists for clients, starts with easy approach with an assigned value of 1 to a very complicated one weighted with a value of 5.
2.10. Absolute rating.
It is the value that is generated when evaluating the technical characteristics relating to customer requirements and is called the absolute score; this score is related to the level of difficulty assigned to each of the specifications.
The formula is:
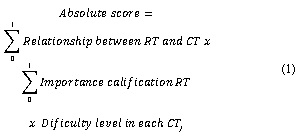
Where i is the number of customer requirements and j is the quantity of technical characteristics.
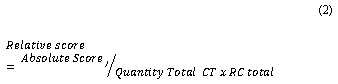
3.9 Relative score.
Relates to the way in which absolute positioning is calculated, it is a technical characteristic score with the absolute score of the number of technical characteristics that are analyzed.
3. Results and analysis of results
3.1. House of Quality First
The first result obtained is from the first house of quality, which is shown in Figure 7. Which provides the technical characteristics that influence, or that may solve customer requirements. This first matrix shows that there are 36 technical characteristics (Ct).
Morphological Analysis
The Morphological Analysis is an analytical-combinatorial method aimed at solving problems by analyzing the component parts. It is based on the concept that any object of our thought is made or composed of a number of elements and in the consideration that they have their own identity and can be isolated. The criteria, by which the features that are part of morphological analysis are determined, are made from the recommendations [8] to successfully perform a morphological diagram:
- Generalities and independence between features or functions.
- Feasible properties or functions.
- A reasonable and manageable list, must have 4-8 features or functions
- Given these recommendations, the initial group of QFD is reduced to the morphological features shown in Table 2.
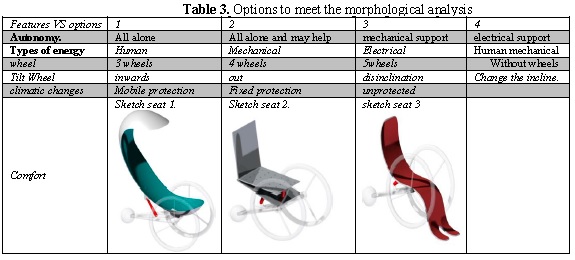
3.1.1. Sketches of mobile devices
These sketches were done by the software Solid Edge, taking as starting the technical characteristics obtained from the first house of quality and which were subsequently reduced by the method of morphological analysis. The different features and options of morphologic analysis are shown in Table 3.
As an important part of choosing the three sketches (for example) has given an objective assessment based on criteria of value that is why the weighted objectives method is chosen. Here in Table 4, the selection of the proposal is demonstrated using weight objectives. It shows how the valuation to help determine the way to achieve objectively chooses the best proposal states. The rating is described in a manner that will be 1 when the target compliance is low, 3 when it meets in partially and 5 when is fully satisfied.
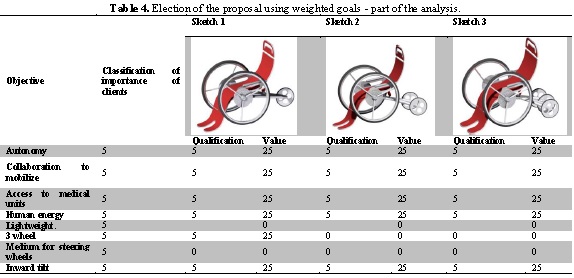
Table 4, Election of the proposal using weighted goals [9], it is possible to find that Proposal 1 is the one with greater compliance with customer requirements, the values of the rating of the importance of customers is obtained from the first array of quality house, with that value multiplied by the skill level we get the value of that feature.
3.2. Selected Proposal
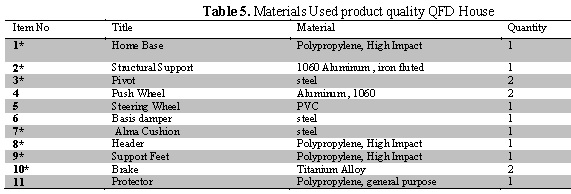
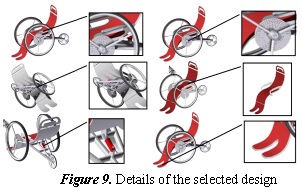
Then relevant aspects of the selected proposal (Sketch 1) appears briefly. For the selection of suitable materials (Table 5), we took into account the second house of quality (QFD not shown in this article).
Some additional elements in the chair supports are essential to the design as part of the elements of comfort you need in the device buffer system, disc brakes, support around the body of the person arms, foot rest and head rest with option to extend them because as mentioned, people are in the growth phase (Figure 9).
4. Conclusions
In the development of the house of quality is important to emphasize that one of the advantages is the elimination of subjectivity throughout the process. It means that every decision is bound to a method that eliminates it, as morphological analysis for the decision making chosen sketch and / or weighting method to determine the level of relationship between the features that are evaluated in the matrixes of the house of quality.
It is not easy to find customer requirements without carrying out a level of empathy in order to find the explicit requirements that would be fundamental. It means that although more than 100 questions are established looking to fill all the requirements it was found that there are several very critical issues that only people with disabilities could know, is the case of why the device will be light, and it has to be designed to withstand the weight of people plus a load caused by the legs, the arms are not designed for this work, that is why if the muscles of the arms are required for these tasks, lesions may occur, given previous justification, it is logical that the device has to be as light as possible .
There are many innovative ideas that break with the paradigms of mobility that are established, but is not known how they came to the proposals made, the proposal generated in this project is explicitly based on the needs of disabled people, following the development of the house of quality prototypes that does not depart from the basic form that currently has generated.
The QFD method really helps to easily determine what are the requirements that are truly important at the moment of creating a possible solution giving greater efficiency to build a prototype. You cannot meet all needs, although this is the approach pursued by QFD, but contradictory elements discard the possibility that the wheel chair become light. So given the complexity in decision -making is better to develop this proposal by a group of people that increase the selection criteria that would further give more arguments and more diversity in design options.
References
[1] World Health Organization., «World report on disability,» Alana Officer (WHO), 2011. [ Links ]
[2] DANE, «Censo,» Departamento Administrativo Nacional De Estadística, 2005. [ Links ]
[3] E. Yacuzzi y F. D. l. I. J. Martín, «Aplicación del método de Kano en el diseño de un producto framaceutico,» 1997. [En línea]. Available: http://www.ucema.edu.ar/publicaciones/download/documentos/224.pdf. [ Links ]
[4] D. L. Goetsch, «Quality Function Deployment,» de Introduction to Total Quality, Merrill, 1997. [ Links ]
[5] B. Guillon y I. Laffont, «Silla de Ruedas,» de Encyclopéde Médico-Chirugicale, Paris, Elsevier, 2002, pp. 26-170. [ Links ]
[6] G. Hauser, «Voice of the Customer.,» Marketing Science, vol. 12, nº 1, p. 127, 1993. [ Links ]
[7] J. Alcaide, Diseño de producto, métodos y técnicas, Valencia: Editorial de la UPV, 2001. [ Links ]
[8] F. Martin y E. Yacuzzi, «Matrices de calidad y diseño de nuevos,» Intherpharma. [ Links ]
[9] E. Yacuzzi, «La gestión Hoshing: Un marco para la calidad,» Intherpharma, 1996. [ Links ]
