Serviços Personalizados
Journal
Artigo
Indicadores
-
 Citado por SciELO
 -
 Acessos
Links relacionados
-
 Citado por Google
 -
 Similares em
SciELO
 -
 Similares em Google
Compartilhar
Tecciencia
versão impressa ISSN 1909-3667
Tecciencia vol.9 no.16 Bogotá jan./jun. 2014
https://doi.org/10.18180/tecciencia.2014.16.3
DOI: http://dx.doi.org/10.18180/tecciencia.2014.16.3.
Identification of eight bird species of Bogotá wetlands using pattern recognition and component analysis
Identificación bioacústica de ocho especies de aves de los humedales de Bogotá empleando caracterización por patrones y componentes
Javier Leonardo Ramirez1, Helbert Eduardo Espitia2
1 Universidad Distrital Francisco José de Caldas, Bogotá, Colombia, lramirezc@udistrital.edu.co
2 Universidad Distrital Francisco José de Caldas, Bogotá, Colombia heespitiac@udistrial.edu.co
How to cite: Ramirez, J., et al., Identification of eight bird species of Bogotá wetlands using pattern recognition and component analysis, TECCIENCIA, Vol. 9 No. 16., 33-42, 2014 DOI: http://dx.doi.org/10.18180/tecciencia.2014.16.3.
Received: 09 Apr 2014 Accepted: 28 May 2014 Published: 30 Jul 2014
Abstract
This paper seeks to identify eight native birds from Bogotá wetlands by recognizing the characteristics of their songs. Sounds are subjected to digital processing for sampling, normalizing, filtering, and scaling the frequency spectrum to extract the characteristics. The survey shall determine if an input file belongs to the pattern identified. According to the variables used different characterizations exist, whose performance is evaluated in terms of True and False Positives for a training group and test group. The characterization uses a combination of variables extracted by pattern recognition and Principal Component Analysis. This proposal received 90% performance in identifying and 6% of wrong recognition, being the lowest false positive rate compared to that obtained by using the methods separately. This study provides patterns of 8 species from Bogota' wetlands. The results provide a tool for automatic identification of bird sounds, contributing to the study and conservation of vulnerable ecosystems. This helps to assess the status of endangered populations and supports strategic ecosystems monitoring.
Key words: Bioacoustics, Computational intelligence, identification, pattern recognition, Principal Component Analysis, signal processing.
Resumen
En este documento se propone el reconocimiento de 8 especies de aves nativas de los humedales de Bogotá identificando las características de sus cantos. Los sonidos son procesados digitalmente para muestrear, normalizar, filtrar y escalar el espectro de frecuencia con el fin de extraer las características de cada especie que coinciden en un rango común. El reconocimiento consistirá en determinar si un archivo de entrada pertenece al patrón identificado. Según las variables usadas se tendrán diferentes caracterizaciones, cuyo desempeño se evaluó en términos de Falsos y Verdaderos Positivos para un grupo de entrenamiento y otro de ensayos Finalmente se propone una caracterización combinada usando Reconocimiento de Patrones y Análisis de componentes. Este algoritmo híbrido obtuvo un acierto del 90% y un 6% de reconocimientos errados, siendo la menor tasa de fase positiva con respeto a la obtenida usando los métodos por separado. El estudio los patrones de 8 especies de aves y evaluó el desempeño de una propuesta aplicada previamente en el reconocimiento de voz [1]. Los resultados son una contribución al desarrollo de herramientas para la identificación automática de aves como estrategia para su conservación [2] y apoyo al monitoreo de ecosistemas estratégicos [3].
Palabras clave: Análisis de Componentes, bioacústica, Inteligencia Computacional, procesamiento de señales, reconocimiento de patrones.
1. Introduction
Birds are indicators of environmental changes [4] because they help to establish human affectations on the environment [5], [6] Conservation of avifauna requires analyzing and processing timely information from bird census. In these, sonorous identification must overcome spatial limitations and limitations of continuity over time [7] like obstacles in sensitive areas and birds with nocturnal activities. Automation of detection and processes and data collection from the environment contribute to monitoring the ecosystem by permitting efficient processing and classification of sounds [8]Inaddition, it Recognition and documentation of acoustic signals have application in taxonomy, studies on biodiversity, monitoring, and conservation [9].
The data obtained aid in the characterization, identification, and calculation of the population density. Bioacoustics provides non-invasive and economic techniques to classify and analyze sound signals, permitting to address the complexity and diversity of the biological communities [6].
Within this context, a tool to identify bioacoustics of birds from the Bogotá wetlands could help in the conservation of these endangered strategic ecosystems, given that the wetlands are currently considered the ecosystems with the highest risk of disappearing in Colombia [10]. The Bogotá savannah registered a loss of 99% in wetland extension, which from 50,000 hectares dropped to have 500 during the 20th century [2]. In spite of this, the region offers refuge to endemic, threatened, resident native, and migratory species and subspecies [3]. The city calculates 150 bird species [11] and 270 in the savannah [12].
Conservation of avifauna from the wetlands requires a biodiversity monitoring program [13]and tools to support environmental management. Implementation of an automated monitoring system will permit having broader data at temporal and spatial scales [14].
These advantages coincide with demands for conservation of Bogotá wetlands and respond to the guidelines of management plans and conservation policies of endangered avifauna, which seek to increase the quality and quantity of investigations on the biology of the birds [12], assessment of the state of the populations of the species threatened [11], and monitoring in strategic ecosystems [13].
Automatic bird recognition has been addressed from different approaches like Artificial Neural Networks , Support Vector Machines [15]Hidden Markov Models [16]], Temporal Dynamic Distortion and Gaussian mixtures [17]Linear Discriminating Analysis and Decision Trees [18], Synthetic songs [19] and Acoustic Digital Print [14]Nevertheless, identification of bird calls in natural environments continues being a challenge [6]In spite of various classification approaches applied in signal characterization, few studies have compared their precision [20]. Progress is still required to diminish computational costs, treatment of positive phase, and diminish the number of data required. favors data processing to transmit them through information technology networks that provide resources for storage, search, analysis, and dissemination of information Studies have concluded that alternative representations of sounds give way to varied results in different species [9], hence, birds provide a test medium for automatic learning algorithms; besides, the design of specific algorithms for species at risk of extinction is a field of application [6].
This work develops a proposal to identify eight bird species from the Bogotá wetlands through processing the signals of their songs and hybrid characterization based on the recognition of patterns extracted from the frequency spectrum and Principal Component Analysis.
2. Methods
This section exposes communication concepts in birds and the methods of pattern recognition and Component analysis that provide conceptual support to the proposal.
2.1. Communication in birds
Bird song is an evolutionary adaptation made possible through a specialized vocal organ called syrinx, composed of muscles that create tension on a vibrating membrane. The quality and complexity of the song depends directly on this musculature; hawks have two pairs of muscles and emit some shrieks, while passerines (like canaries) have up to seven and nine pairs with diversity of songs [21]
Communication among birds comprises a great variety of sounds like calls, shrieks, and songs [22], with functions like claiming a territory, alerting danger communicating food sources, supporting courtship and breeding, permitting nocturnal communication, and identifying other specimens.
The complexity varies among species and populations, evidencing the learning capacity of the individuals. The vocal learning process comprises a sensory stage to listen to and memorize the song pattern and a motor stage for gradual emission, comparison, and correction of sounds [23].
Bird sounds are differentiated into calls and songs Calls are brief sounds, which are acoustically simple, intuitive, ambiguous, composed by a pair of syllables that do not follow a pattern [24]. They are used to emit signals or warnings to other birds. Songs are complex voices, of long duration with specific characteristics and require a learning process.
Songs can be segmented into phrases, syllables, and elements. Syllables are brief sounds of a specific vocabulary of the species [25]. Song is an organized sequence composed of various syllables with a pattern over time and a melody. Syllables with a common pattern define phrases. A syllable is the sound produced by the bird with a single stroke of air from the lungs. Complex syllables are composed of elements, whose separation is difficult and ambiguous; hence, the syllable is the fundamental unit. The waveforms of songs tend to be coupled as groups of bursts, that is, in pairs, trios, or quartets. A song generally contains a periodic repetition of bursts [19]
2.2. Pattern Recognition
Pattern recognition is a numerical procedure to classify vectors of characteristics according to an optimum criterion through the partition of the characteristic space in regions [1]. It is the study of how machines can observe the environment, learn to distinguish characteristics of interest and make decisions. In general, a pattern is an entity that can be identified with a name [26] that describes or categorizes it .
In automatic pattern recognition, an object is represented through its characteristics via a vector of m components, that is, in the m-dimensional space. The study on the space of characteristics is the usual work form in classification [26].
The objective of pattern recognition is to identify, characterize, classify, and conduct prognosis on objects, physical or abstract, establishing properties and relationships among the sets of objects [27].
The procedure implies some phases of segmentation or acquisition, extraction of characteristics and description. At the end of the process, each object will be represented by an ordered and structured collection of descriptors, called pattern [28]. Patterns that describe objects from the same class have similar properties that can be differentiated from other classes.
The acquisition phase is the transference and transformation of knowledge to an information system for its representation [29], storage, and operation. The phase of extraction of characteristics seeks to collect the necessary information to identify the patterns. The objective is to eliminate redundant information and maximize discriminating traits. Selection of properties is in function of criteria like reasonable cost, tolerable calculation time, non-correlation with other variables, homogeneity of characteristics from the same class and dispersion with respect to characteristics from different classes.
Selection of the variables for classification is done to improve classification or processing [30].
The purpose of the extraction of characteristics is to generate a new set of variables; the characteristics selected will be the vectors resulting from the selection or extraction process. The classification phase assigns the patterns to categories that allow the system to make decisions. Classifying is synonymous to associating a series of elements to classes according to certain properties. The recognition process consists in assigning an unknown pattern to a class according to how they coincide with reference patterns. Classification provides new prototypes to the system that permit labeling the new inputs according to the set of classes available [28].
Election of the pattern recognition technique was because it presented performance above 90%, verified during the documentation and state-of-the-art phase; additionally, during preliminary tests it permitted a simple and differentiable representation of the characteristics of each species.
The pattern recognition technique based on detection of events and estimation of bird son grate of repetition can achieve a good identification rate even in poor acoustic conditions [6]. This is because special purpose algorithms adapted to specific signal types detect simple spectral events with the presence of noise or work with signals that are characterized by periodic repetition of elements often found in animal vocalizations. Bardeli [6] obtained improved recognition rates through species specific algorithms and considering the type of signal.
2.3. Principal Component Analysis
Principal Component Analysis (PCA) is a statistical technique that permits reducing the dimension of a dataset, supported on the fact that the variables are interrelated and, hence, have common information that is extracted in the principal components, with the guarantee that loss of information is minimum upon selecting the most important sources of variability in the dataset [31].
The fundamental purpose of the technique consists in reducing the dimension of the data to simplify the problem studied. It is applied when a high correlation exists among the variables because it indicates that redundant information exists and, hence, few factors will explain much of the total variability.
The objectives of the Principal Component Analysis are to extract the most important information from the dataset; compressing its size, but maintaining the important information; simplifying the description; permitting analysis of the structure of observations and variables [32].
Principal Component Analysis consists in finding orthogonal transformations of the original variables to achieve a new set of uncorrelated variables, that is, it has no linear correlation. The new variables are the principal components, which are obtained in decreasing order of importance.
The components are linear combinations of the original variables and it is expected that a few gather most of the data variability, obtaining their dimension reduction.
Election of the factors is done so the first factor gathers the biggest proportion possible of the original variability. The second factor must gather the maximum variability possible not included in the first and, thus, successively. From the total of factors, those gathering the variability percentage considered sufficient will be elected [33].
The use of Component analysis is done to evaluate its effectiveness in reducing the dimension of the problem and test it as a characterization of the alternate signal to pattern recognition.
2.4. Experimental Framework
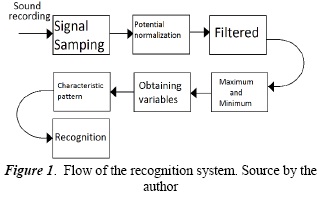
A procedure was taken as reference to identify phonemes in children with cerebral palsy [23], which consists in digitally processing sounds, filtering them, separating the frequency spectrum into bands to identify a characteristic pattern that should be identified through direct comparison of the variables obtained. This process distinguishes some phases of pre-processing, spectrum analysis, and identification of characteristics and classification that can be seen in Figure 1.
An alternate characterization consists in calculating Principal Components like linear combination of the previously obtained variables. From this, a combined characterization of Component analysis and pattern recognition is proposed.
2.5 Data
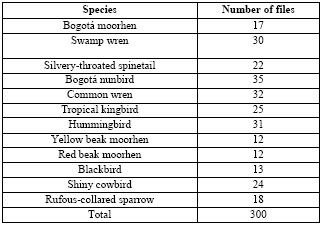
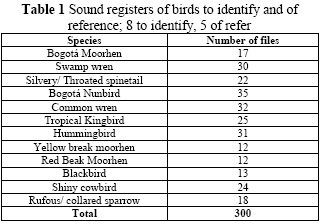
Characterization 206 bird songs were used from eight typical species of the wetland ecosystems or of particular interest for conservation, 25 files on average per species. Another 94 files of reference species that are not recognized but.
Permit discarding false positives for a total of 300 files used in the training phase. Another 40 different songs are used for external tests. Table I shows the number of files available per each species.
Songs downloaded from sound banks, correspond to five native species of the Bogotá wetlands: the Bogotá moorhen (Rallus semiplumbeus), the swamp wren (Cistothorus apolinari), the silvery-throated spinetail (Synallaxis subpudica), green beak moorhen (Gallinula melanops bogotensis), the Bogotá nunbird (Chrysomus icterocephalus bogotensis). The first three species are endemic of the Cundinamarca-Boyacá plateau. The two others are endemic subspecies of the wetlands of the plateau. The green beak moorhen, Bogotá moorhen, and the swamp wren are species in danger of extinction. The group is completed by Hummingbird, the Tropical kingbird (Tyrannus melancholicus), and the common wren (Troglodytes aedon), common species in these ecosystems number were the wrens (common and swamp), tropical kingbird, and hummingbird.
The species used as reference to evaluate and correct the incidence of positive phases are: blackbird (Turdus fuscater), red beak moorhen(Gallinula chloropus), shiny cowbird (Molothrus bonariensis), rufous-collared sparrow (Zonotrichia capensis), and yellow beak moorhen (Fulica americana). It was felt convenient to include some of these species because they share habitat or belong to the same bird family to identify; case of moorhens (Rallidae family). The rufous-collared sparrow is also a frequent interference in sound registers of other birds.
2.6. Pre-processing
The files downloaded from the sound bank were cut and converted to wav format. Files from 5 to 20 seconds were used, with one, two, or three song bursts. The recordings were not normalized over time, given that individuals from a particular species have variable behavior in the length and structure of their song. However, it was observed that recordings over 20 seconds require more computational sources.
The digital signal from each sonorous record was sampled with 15 kHz frequency, 15,000 specimens, 8-bit mono channel format. The 15 kHz frequency yielded better behavior of the bands in which the spectrum was divided because it reaches higher magnitudes and the information is distributed in a higher number of intervals with respect to 8-kHz or 45-kHz samplings.
Note that the original sampling at 45 kHz has variable behavior with peaks of elevated or null magnitude and the sampling at 8 kHz registered a lower interval of characterization.
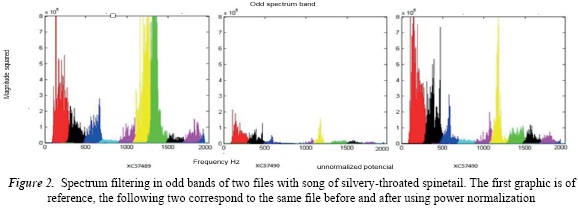
The vector was normalized in power, unlike [1] what is done in frequency. This variation permits unifying the songs into comparable magnitudes, an indispensable aspect to make the characterization. Normalization permits scaling a set of heterogeneous data. To visualize the effect of normalization, Figure 2 shows the silvery-throated spinetail song as reference, followed by a song from another file from the same species without applying normalization and a third graphic is the result of applying the procedure. Note common characteristics between the first and third image.
The power of a signal x(n) with period N is given by equation 1.
2.7. Separation of bands
After digitizing the audio file as a data vector, it is passed to the domain of the frequency through the Fast Fourier Transform, algorithm that permits calculating the Discrete Fourier Transform (Eq.2)
This is necessary to extract characteristics from the frequency and work the sound as a signal and not as a series of data [34].
But the most significant maximums and minimums of the signal must first be scaled to attenuate the least significant and increase the discriminating traits [23]. For this, the signal is separated into operation bands, given that the minimums and maximums vary in distinct points of the signal.
The separation of bands was worked every 200 Hz in the range from [0, 3200] with a fifth order Butterworth passband filter. Equation 3 is the filter's frequency response, where N is the filter order, ωc the cut frequency and ω the complex analog frequency.
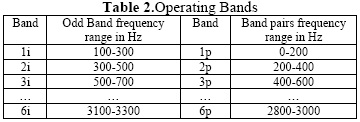
This separation of the operating bands into evens and odds according to Table II improves visualization in each interval, which facilitates finding the characteristic variables of each species.
2.8 Characterization
For each even or odd interval apply the same procedure described of filtering and obtaining the frequency response. At this point the variables that will permit characterizing each species will be calculated.
The variables to take will be the maximum magnitudes of the spectrum and the powers calculated for each interval in which the signal spectrum was fragmented every 200 Hz. The pattern that describes each species will be the set of variables that coincide within some common ranges.
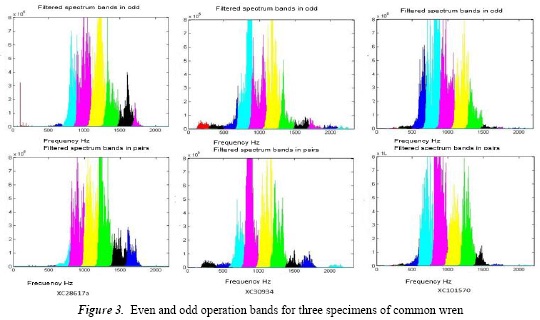
This representation already suggests the presence of patterns for characterization. Figure 3 shows the frequency spectrum in even and odd bands for three specimens of common wren. High and similar magnitudes are observed for the odd intervals.
[700, 900], [900, 1100], [1100,1300], [1300,1500] and for the even intervals [600, 800], [800,100], [1000, 1200] and [1200,1400]. In the range from 0 to 700 Hz and for values higher than 1700 Hz, the scores are not relevant on the even or odd bands.
The Hummingbirds presented scores on the 1700-3000 interval with lack of activity in the 0-1500 interval. In Cystotus apolinari records were observed on the 0 - 1200 interval without important activity characteristics or calculated variables that coincide in on the rest. In Rallus semiplumbeus, activity was recorded principally on odd intervals [1100,1300], [1300,1500] and on even intervals [1000,1200], [1200,1400]. For Tyrannus melancholicus, the impulses are constant on [1700,1900], [1900,2100] intervals in the odd band and [1600,1800], [1800,2000] in the even band; likewise, for the other species.
For all the training songs variables were extracted per each range (even or odd) in which the spectrum was divided, giving way to a data grouping that relates a file with a set of variable.
The resulting data per species were discriminated. For each species we calculated on the dataset the minimum and maximum value of variables per frequency range. The set of values found between the maximums and minimums obtained define the pattern associated to each species.
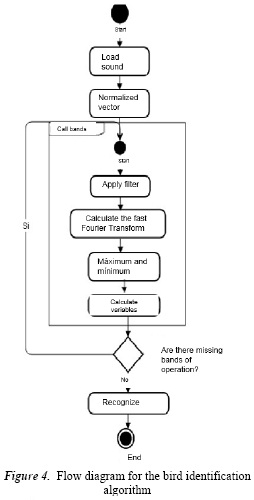
In synthesis, the general scheme of the algorithm can be seen in the flow diagram on Figure 4.
2.9. Identification
The pattern of each species will be equivalent to the set of characteristics or calculated variables that coincide in a common range. Hence, recognition, will consist in comparing and determining if the variables of an input file are within that range to give as output the species to which it belongs.
Identification is a direct comparison. A control structure was used that compares the coincidence of the magnitude of the bands with the constant characteristics elected. This procedure is performed for each variable. The set of characteristics included sound intervals and silence intervals.
The criterion to construct the algorithm was to assign variables to each interval and test its value between a minimum and a maximum of the dataset that characterize each species.
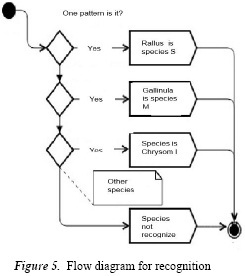
The identification scheme is shown in the diagram on Figure 5. It is a basic procedure.
Of exhaustive search that offers a field of action for future works upon replacing it with automatic learning techniques.
2.10. Characterization through principal components
An alternate characterization was evaluated through the Principal Component Analysis to tests its effectiveness as information synthesis technique or to reduce the dimension of the problem.
The inputs of this procedure were the data obtained from the pattern recognition. As characteristics we used the maximum magnitudes and the averages of the frequency spectrum calculated in the Spectrum was divided. The principal components will be a linear combination of these variables, independent from each other.
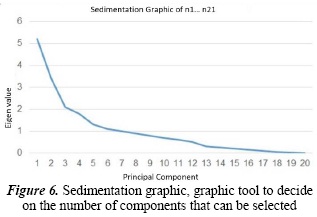
To select the factors, the variance explained is interpreted From Figure 6, we deduct that we need at least 14 components to represent 98% of the variance. When the graphic stabilizes at 0, it is because the variance accumulated from the components has reached 100%. The higher the slope of the graphic segment, the greater the importance of the respective component when representing a higher percentage of the variance.
The matrix of components or matrix of loads will indicate the weight of each variable for each component. Los factorial weights determine the degree of the relationship with the variables. The matrix permits defining each component as the linear combination of the variables.
In total, 20 components were used. Bearing in mind that for the patterns up to 32 variables were used (without counting additional variables of the power), reduction of the dimensions is only a bit over 10 for the identification, the strategy applied on pattern recognition was maintained. The values for each component were extracted for the set of training data.
The minimum and maximum values were calculated per component to define the set of characteristics and the coincidence of the file to identify within these ranges.
2.11. Hybrid Characterization Algorithm (HCA)
From the algorithm based on Component analysis characterization was maintained for species registering more positive phases and only 12 components were used in species showing good behavior
Each species from the training group was evaluated given the presence of positive phases, the patterns previously defined were tested, identifying only the conditions that upon being evaluated yielded a value of 0 (false) and, hence, permitted distinguishing the species. The conditions identified were added to the original pattern.
Thus, the definite algorithm used characterizations obtained from the component analysis and variables extracted from the maximum and average frequencies calculated for each interval in which the spectrum was divided, or variables derived from these, and the variables of the powers.
3. Tests
Depending on what variables are taken as pattern, variations will be available of the algorithm that can be tested and compared, establishing which offers a better response to the problem. The following variations are proposed:
- Method 1: Characterization is done by taking the maximum magnitudes from each interval of the frequencies.
- Method 2: Characterization based on maximum magnitudes and on the powers of each interval of the frequency spectrum.
- Method 3: Characterization is done by taking the average of the magnitudes associated to each interval of the frequency spectrum.
- Method 4: Characterization based on Analysis of Principal Components.
- Method 5: Hybrid Characterization Algorithm HCA.
The main criteria to evaluate the algorithms were the positive phase rate (PPR) and the rate of true positives (RTP). The RTP is the percentage of specimens correctly assigned to the class in relation to the number of specimens that belong to it. The PPR is the percentage of specimens assigned incorrectly as belonging to each class with respect to the number of specimens that do belong to it.
In terms of these performance measures we evaluated and compared the performance of the methods proposed during the training phases and external tests. The external tests have a set of 40 data different from those used during training.
The external tests permitted adjusting the algorithm so the ranges were corrected to include new files presenting an important coincidence of the variables.
Tests with the group of reference birds evaluated the robustness of the algorithms proposed, given that they test their behavior against unexpected data from common species it was evident that increased components does in wetland ecosystems.
During the external tests phase, the algorithms were tested with 40 additional data not used in prior phases, on average five new files were worked for each of the eight species.
4. Discussion
The RTP is a predictable measure during training, given that as of the characterization phase it was possible to distinguish what files respond to a common pattern and which do not. For the pattern of each species, only the files with common characteristics were used; hence, files discarded will appear as not recognized. However, during training the positive phase rate will be important because the behavior the species will have in relation to others is unknown a priori and it is convenient to analyze how close the patterns are or are not among species.
The results varied according to the species Success was related to the audio quality available, the number of training files and the tendency to confuse or not with another specie. Results were variables for the different methods tested The results for the five methods proposed and the average of the rate of true positives and positive phases are seen in Table III.
The percentage of identification was above 90%, tropical kingbird and hummingbird, with the highest identification rate and lowest confusion.
The species provoking more positive phases were Bogotá nunbird and silvery-throated spinetail. Bogotá nunbird was the biggest cause of positive phase. Table IV shows the species causing positive phase per method. This information can help to evaluate the effectiveness of the characterization, given that a lower number of positive phases produced by a species implies that the pattern tends to greater uniqueness.
Reduction of positive phases was achieved through additional variables of power with respect to the algorithm, which only used the maximum magnitudes of the spectrum However, it should be highlighted that the incidence of false positives of a species depends on the quality of the characteristic patterns of the remaining species and not on the pattern itself. Method 3, used the averages obtained a better recognition rate with respect to methods 1 and 2, but its rate of FP was higher, except for the Bogota moorhen.
From the implementation of the Component analysis, three important results are highlighted
-
It was evident that increased components does in wetland ecosystems.not influence on the reduction of positive phases. The final algorithm incorporated 20 components, even so the positive phase rate is on average 37% and in the silvery-throated spinetail it reaches a high of 87%. The behavior was maintained using maximum magnitudes and averages.
-
In spite of the high positive phase rate affecting characterization these concentrate on two or three species. Hence, through principal components, we can accomplish acceptable characterization for the remaining species using a lower number of variables. For species in conflict, we should consider a different characterization. This supports the work with a hybrid algorithm with characterizations product of different procedures.
-
Regarding the need to reduce the dimensionality of the problem, an important compromise was not observed of the computational cost (time and memory) on increasing or reducing the number of variables, given derive from simple calculations although the species presented variable behavior. In general, the best characterization was achieved for the methods a considerable increase exists when recordings surpass 20 seconds of duration. Due to this, sound registers were cut to not exceed 20 seconds, thus, improving performance.
The results of the external tests are shown in Table V and present a similar behavior to the tests carried out with the other 300 sound registers. The hybrid algorithm maintains the lowest positive phase rate
5. Conclusions
The search for characteristic patterns from normalization and segmentation in even and odd bands of the frequency spectrum permits identifying the songs of birds through simple algorithms. The solution proposed concentrates efforts on the analysis phase, where it is necessary to study the data to identify characteristics, and on the test phase for their adjustment. Identification is achieved through a direct comparison of the characteristic variables obtained.
Normalization in power and not in frequency permitted conducting the sound registers at comparable magnitudes, facilitating characterization, and admitting songs of variable quality. In all cases, identification was above 90% and through alternative characterizations; we managed to bring the positive phases to a tolerable proportion.
The variable behavior of each species in terms of true positive rates and positive phases in the different algorithms tested led to evaluating the possibility of achieving better performance with a hybrid algorithm, which gathers the methods or variables that managed the best results for each species. The result was the lowest positive phase rate of all the methods tested.
Component analysis may be combined with other techniques for better characterization. This technique can help to reduce the number of variables in some species, but does not manage to make up a reliable pattern in others. It is convenient to evaluate the species that generate more positive phases to propose alternative characterizations that can combine procedures.
Use of additional variables did not imply a notable increase in terms of resources (time or memory), given that these derive from elemental mathematical calculations. Hence, it is more effective to place restrictions on the length of the records that to seek to reduce the number of variables.
The results suggest that aspects like diversity of habitats of species, climatic or seasonal factors or variations of the songs do not affect the characterization of the signal. However, it is convenient to evaluate if the high positive phase rate in Chrysomus icterocephalus is related to having used sounds that do not correspond exclusively to the distribution range of the bogotensis variety due to the scarcity of files.
References
[1] J. Franco, «Reconocimiento de voz para niños con discapacidad en el habla.,» Universidad de las Américas Puebla, Puebla, 2004. [ Links ]
[2] L. Renjifo, «Los humedales de la Sabana de Bogotá,» Ambiente capital, 1192. [ Links ]
[3] M. Andrade y H. Benitez, «Los Humedales de la Sabana de Bogotá: Área Importante para la Conservación de las Aves de Colombia y el Mundo,» Instituto Humboldt, 2003. [ Links ]
[4] A. J. Green y J. Figuerola, «Aves acuáticas con biondicadores en los humedales,» Ecología, manejo y conservación de los humedales, pp. 47-60, 2003. [ Links ]
[5] A. Gonzalez, S. Llanes, O. Sanchez y B. Rodriguez, «Estado de las comunidades de las aves residentes y migratorias en ecosistemas cubanos en relación con el impacto generado por las comun,» Cuba, 1999. [ Links ]
[6] R. Bardelia, D. Wolffb, F. Kurth, M. Koche, K.-H. Tauchertf y K.-H. Frommoltf, «Detecting bird sounds in a complex acoustic environment and application to bioacoustic monitoring,» Pattern Recognition Letters, pp. 1524-1534, 2010. [ Links ]
[7] T. Burg, R. Drew y P. Pulgarín, «Representaciones de disimilitudes en bioacústica computacional: una metodología para el monitoreo automatizado de aves,» de III Congreso Colombiano de ornitología, Medellín, 2010. [ Links ]
[8] J. E. Botero, D. Arbeláez y G. Lentijo, «Método para estudiar las aves,» Cenicafe, vol. 8, 2005. [ Links ]
[9] E. P, b. Kastena, P. K. McKinleyb y S. H. Gagea, «Ensemble extraction for classification and detection of bird species,» Ecological Informatics, vol. 6, nº 3, p. 153-166, 2010. [ Links ]
[10] J. Botero, D. Arbeláez y G. Lentijo, «Métodos para estudiar las,» Centro Nacional de Investigaciones de Café Cenicafé., 2005. [ Links ]
[11] A. B. d. Ornitología., Aves de la Sabana de Bogotá, Guía de Campo, 2000. [ Links ]
[12] «La biodiversidad bogotana. Biodiversidad Una,» Revista Universidad Jorge Tadeo Lozano., pp. 89-98, 2002. [ Links ]
[13] G. Andrade, Los Humedales del Altiplano de Cundinamarca Boyacá. Ecosistemas en Peligro de Desaparecer, Instituto de Investigación de Recursos Biológicos Alexander von Humboldt,, 1998. [ Links ]
[14] P. Caycedo, M. Orozco y J. Ruiz, «Reconocimiento automatizado de señales bioacústicas: Una revisión de métodos y aplicaciones,» Revista Ingeniería y Ciencia. Universidad EAFIT, 2013. [ Links ]
[15] C. Huang, Y. Yang, D. Yang y Y. Chen, «Frog classification using machine learning techniques,» Expert Systems with Applications, 2007. [ Links ]
[16] J. Kogan y D. Margoliash, Automated recognition of bird song Automated recognition of bird song warping, University of Chicago, 1998. [ Links ]
[17] H. Tyagi, R. Hegde, H. Murthy y Prabhakar, Automatic identification of bird calls using spectral ensemble average voice prints., Indian Institute of Technology Madras, 2006. [ Links ]
[18] M. Acevedo, C. Corrada-Bravo y H. Corrada-Bravo, «Automated classification of bird and amphibian calls using machine learning,» Ecologic informatics, 2009. [ Links ]
[19] A. Franzen y I. Gu, «Classification of Bird Species by Using Key Song Searching,» IEEE, p. 885, 2003. [ Links ]
[20] M. Acevedo, C. Corrada-Bravo y H. Corrada-Bravo, «Automated classification of bird and amphibian calls using machine learning A comparison of methods,» Ecologic informatics, 2009. [ Links ]
[21] F. Gil Cano, «Anatomía específica de aves: aspectos funcionales y clínicos,» Facultad de veterinaria, Universidad de Murcia, [En línea]. Available: https://www.um.es/anatvet/interactividad/aaves/anatomia-aves-10.pdf. [ Links ]
[22] A. Navarro y H. Benitez, «El dominio del Aire, Capítulo 8,» La ciencia para todos, [En línea]. Available: http://bibliotecadigital.ilce.edu.mx/sites/ciencia/volumen3/ciencia3/138/htm/dominio.htm. [ Links ]
[23] P. L. Tubaro y E. T. Segura, «Aprendizaje vocal y dialectos de canto en las aves,» Revista latinoamericana de psicología, vol. 21, nº 2, pp. 195-217, 1989. [ Links ]
[24] W. E. Castillo, «Las manifestaciones sonoras en el mundo de las aves,» Universidad Tecnológica OTEIMA, 2010. [ Links ]
[25] C. K. Catchpole y P. J. Slater, Bird Song: Biological themes and variations, London: Cambridge University press, 2008. [ Links ]
[26] A. Jain, R. Duin y J. Mao, «Statistical pattern recognition: A review,» IEEE Tran. on Pattern Analysis and Machine Intelligence, vol. 22, nº 1, 2000. [ Links ]
[27] F. Vázquez Torres, «Caracterización e interpretación de descripciones conceptuales en dominios poco estruturados. Tesis de Maestría,» Instituto Politécnico Nacional (IPN), 2009. [ Links ]
[28] F. Shih, «Image processing and pattern recognition: Fundamentals and Techniques,» Wiley- IEEE Press, 2010. [ Links ]
[29] M. V. Galarga, «Reconocimiento de firmas usando redes neuronales artificiales,» Unidad tecnológica ERquinoccial, Quito, 2004. [ Links ]
[30] J. A. Carrasco Ochoa, «Reseña de "Enfoque Lógico combinatorio al reconocimiento de patrones. Selección de variables y clasificación supervisada,» Computación y sistemas, vol. 4, nº 1, pp. 68-69, 2000. [ Links ]
[31] J. L. Vicente V., «Prácticas con SPSS. Análisis de componentes principales,» [En línea]. Available: http://biplot.usal.es/problemas/practicas/PractSPSS.pdf. [ Links ]
[32] H. Abdi y L. J. Williams, «Principal Component analysis,» Wiley interdisciplinary reviews: Computational statistics, vol. 2, nº 4, pp. 433-459, 2010. [ Links ]
[33] M. Terradez, «Análisis de componentes principales,» Universidad abierta de Cataluña, Cataluña, 2005. [ Links ]
[34] J. L. Plaza Aguilar, «Reconocimiento de voz para personas con discapacidad en el habla. Tesis de maestría,» Universidad de las Américas Puebla, Puebla, 2004. [ Links ]


