


Services on Demand
Journal
Article
 English (pdf)
 Article in xml format
 Article references
 Send this article by e-mail
Indicators
-
 Cited by SciELO
 -
 Access statistics
Related links
-
 Cited by Google
 -
 Similars in
SciELO
Similars in
SciELO -
 Similars in Google
Share

 Permalink
Tecciencia
Print version ISSN 1909-3667
Tecciencia vol.9 no.16 Bogotá Jan./June 2014
https://doi.org/10.18180/tecciencia.2014.16.10
DOI: http://dx.doi.org/10.18180/tecciencia.2014.16.10.
Measurement of the Carbon Footprint in the Company Sistemas Operativos Móviles, Transmilenio
Medición de la huella de carbono en la empresa sistemas operativos móviles, transmilenio
Carlos Díaz1, William Rodríguez2, Esp. Erik Pinzón3, Adm Stephanie Vega.4
1 Universidad del Bosque, Bogotá, Colombia, cardiro@gmail.com.
2 Universidad Distrital Francisco José de Caldas, Bogotá, Colombia, .willirodel@gmail.com
3 Universidad Distrital Francisco José de Caldas, Bogotá, Colombia, epinzon@somos.co
4 Universidad Distrital Francisco José de Caldas, Bogotá, Colombia, svega1216@gmail.com.
How to cite: Diaz., C., et al, Measurement of the Carbon Footprint in the Company Sistemas Operativos Móviles, Transmilenio, TECCIENCIA, Vol. 9 No. 16, 86-96, 2014, DOI: http://dx.doi.org/10.18180/tecciencia.2014.16.10.
Received: 09 May 2014 Accepted: 28 May 2014 Published: 30 July 2014
Abstract
One of the main environmental problems affecting the current world is related to climate change; high CO2 emissions of greenhouse gases have intervened directly with this change. The purpose of this study was to measure the carbon footprint that supposes the quantification of greenhouse gases by using the basic principles and requisites of the ISO 14.064-1: 2006 standard; specifications aimed at the organizational level to quantify and notify greenhouse gas emissions. The study was conducted in the company Sistemas Operativos Móviles, Transmilenio, which has an active fleet of 160 articulated buses.
Key words: Carbon dioxide, Greenhouse gases (GHG), carbon footprint.
Resumen
Una de las principales problemáticas ambientales que afecta el mundo actual está relacionada con el cambio climático, las altas emisiones de CO2 como parte de los gases de efecto invernadero, han intervenido directamente con este cambio. El propósito de este estudio es realizar la medición de la Huella de Carbono que supone la cuantificación de los gases de efecto invernadero, mediante la utilización de los principios básicos y requisitos de la norma ISO 14.064-1: 2006; Especificaciones con orientación, a nivel de la organización, para la cuantificación y notificación de las emisiones de gases efecto invernadero. El estudio tiene lugar en la empresa Sistemas Operativos Móviles, Transmilenio, que cuenta con una flota activa de 160 buses articulados.
Palabras clave: Dióxido de carbono, Gases Efecto Invernadero (GEI), huella de carbono.
1. Introduction|
The special report by the Inter-government Group of Experts on Climate Change (IPCC, for the term in Spanish) on emissions scenarios projects an increase of global greenhouse gases (GHG) emissions between 25 and 90% (CO2-eq) between 2000 and 2030 [1].
The report by the IPCC working group, titled Climate Change 2014: Impact, adaptation, and vulnerability details the impact of climate change to date, concluding that responding to climate change supposes making decisions on the actions and possible risks in a changing world [2].
Colombia is not alien to this theme, which is why the IPCC made an inventory of greenhouse gases for 2004 and concluded that the Colombian contribution to global emissions is around 0.37% of the world’s total [3]. According to the Colombian Ministry of the Environment and Sustainable Development, the volume of these emissions has shown a tendency to increase over time. Between 1990 and 2004, the emissions increased by 39%, over 180 million tCO2eq of the total emitted in the world that reaches 49 billion tCO2eq [4].
The sectors contributing the most to GHG emissions in 2004 were: agriculture (38%); energy (37%), highlighting the transportation sector with (12%), and use of soil, change of use of soil and forestry with (14%) [5]. For Colombia, the mobilization process causes 21,601,200 tCO2eq of the national total.
This document seeks to recognize the GHG emitted onto the atmosphere through the use of emission factors for the company Sistemas Operativos
Móvibles, Transmilenio. The company has an active fleet of 160 articulated buses, being one of the most used means of mass transportation in Bogotá, Colombia.
1.1 Carbon footprint
The carbon footprint analyzes GHG emissions during the life cycle of any product or service; it encompasses raw materials, production, and distribution, that is, the product or service in all its links and, thus, quantify the total emissions produced [6].
Calculation of the GHG emissions released onto the atmosphere as a consequence of any activity is what we denominate carbon footprint [7]. Measurement of the carbon footprint is done by following the ISO 14064-1:2006 standard guidelines, which contain technical specifications for the quantification and the report of GHG emissions at organizational levels [8]. After that, a measurement model was developed for the company to guarantee continuity to the annual quantification of emissions and, thus, evaluate the critical points with the greatest generation of GHG, achieving the development of mitigation programs and contributing to diminished levels of emissions produced nationally. As indicated by Marta Martín, responsible for the consultancy and training department of the consulting company dedicated exclusively to energy efficiency (CREARA), "what is important is that from the our carbon footprint it is possible to know where the GHG come from, which allow us to implement measures to diminish harmful gases emitted onto the atmosphere" [9].
2. Materials and methods
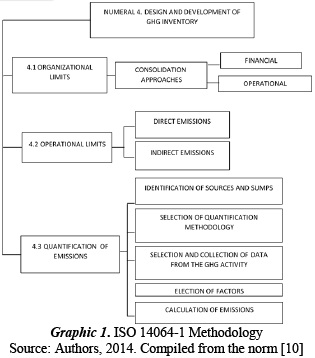
Graphic 1 describes the methodology based on the ISO 14064-1 standard: quantification and report of GHG emission and removal at organizational levels. This methodology is later used in measuring the carbon footprint of the company Sistemas Operativos Móvibles, TransMilenio.
2.1 Organizational limits
To define the organizational limits, it is important to know how the company is constituted and over which of its activities (financial and/or operational) it exerts control [11].
The company, Sistemas Operativos Móviles, was founded in 2002 under the legal structure of joint stock Company, backing the new transportation modality implemented in the city of Bogotá, by bidding as route operator in phase II and obtaining the contract with TransMilenio S.A. for Patio Américas (Bogotá).
Its main object and social activity is the mass transportation of passengers in the city of Bogotá, through the availability and maintenance of the fleet of buses. Its main activities include: fuel supply, washing of buses, motor repair, change of spare auto parts, body maintenance (body work and paint), management of tires, and administrative management of all these activities for the good operation of the fleet of buses and of the organization.
2.2 Operational Limits
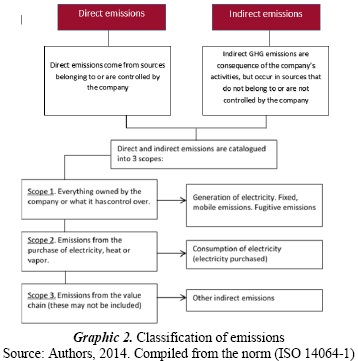
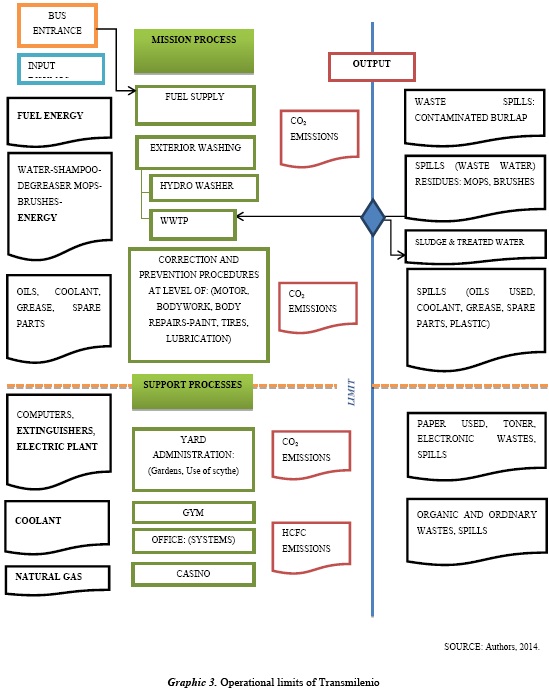
Establishment of operational limits includes identification of GHG emissions associated to the operations of the organization, these emissions are classified as shown in Graphic 2. To establish the operational limits of the processes that generate missions in the company, an analysis of the internal procedures was carried out to study the inputs (materials, raw material, energy, etc.), processes (transformation, procedures, activities), and outputs (wastes, residues, emissions) to determine the emission sources for the mobilization of the fleet. Graphic 3 shows the operational limits, determined from the analysis of the procedures.
2.3 Quantification of Emissions
Quantification of emissions leads to the following steps or procedures:
2.3.1 Identification of emission sources
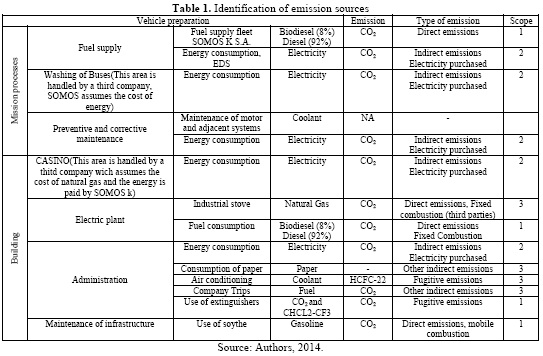
According to the classification of type of emissions (Graphic 2), and upon defining the operational limits (Graphic 3), we proceed to identify emission sources with their corresponding scope, as shown in Table 1.
2.3.2 Selection of the quantification methodology
The method used to quantify GHG emissions is a calculation based on the use of emission factors. The factors permit estimating GHG emissions from the available data of activities (like tons of fuel consumed, tons of product produced, energy consumed); the general formula to apply the emission factors is shown by the following:
- Level of Activity * Emission factors = GHG emissions (1)
2.3.3 Data selection and collection
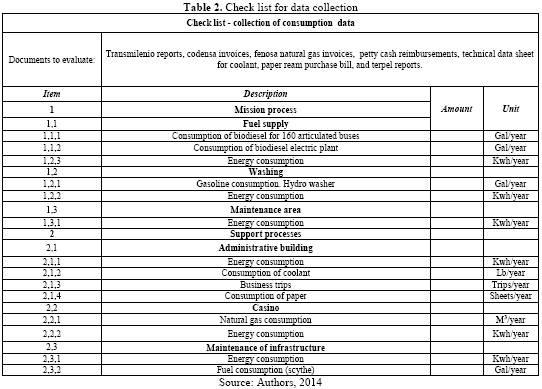
The data collected to quantify the carbon footprint were taken from 2012 and 2013 through the checklist tool (Table 2), which permits compiling in simple manner the data required [12].
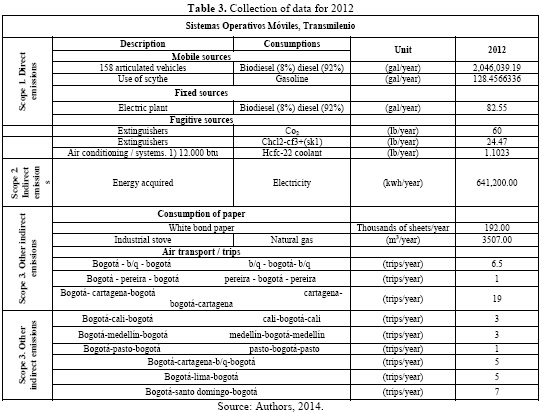
The check list was used to gather information from different GHG emission sources in company areas; Tables 3 and 4 present the data collected for 2012 and 2013.
2.3.4 Election of emission factors
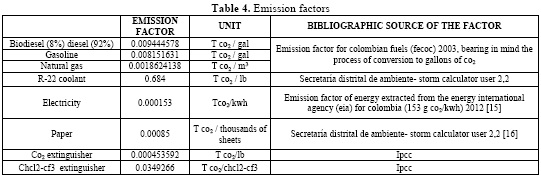
An emission factor is a representative value that seeks to relate the amount of a contaminant emitted onto the atmosphere with an amount associated to the launching of this contaminant. [13]. The compendium of emission factors has been published since 1972 by international entities, like: the Environmental Protection Agency (EPA) and IPCC among others [14].
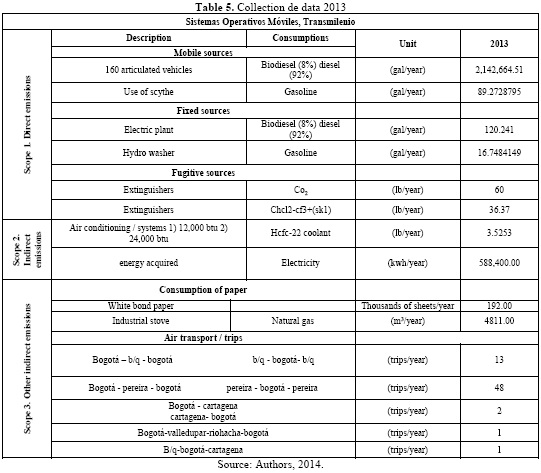
For Transmilenio, collection of emission factors was obtained from reliable sources issued by reliable authorities like: the Energy Mining Planning Unit (UPME, for the term in Spanish), IPCC, the International Civil Aviation Organization (ICAO), and from Secretaría Distrital de Ambiente (SDA). Tables 4 and 5 show the collection of the emission factors for the company.
2.3.5 Calculation of the carbon footprint
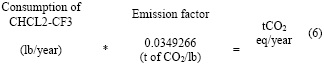
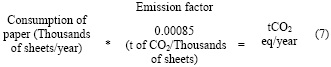
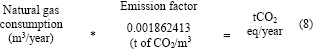
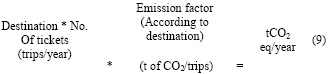
To obtain the total emissions in units of tCO2eq/year, equations were used according to the quantification methodology that states: level of activity, multiplied by the emission factor. The formulas are shown ahead:
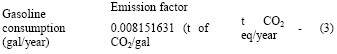
- a) Formula to calculate emissions through fuel consumption:
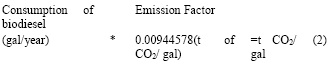
- a) Formula to calculate emissions through natural gas consumption:
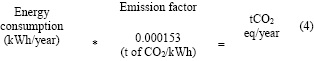
- b) Formula to calculate emissions through energy consumption:
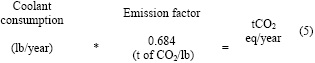
- c) Formula to calculate emissions through coolant consumption:
- d) Formula to calculate emissions through consumption of CHCL2-CF3, extinguisher:
- e) Formula to calculate emissions through consumption of paper
- f) Formula to calculate emissions through trips.
- g) Formula to calculate emissions through trips
3. Results
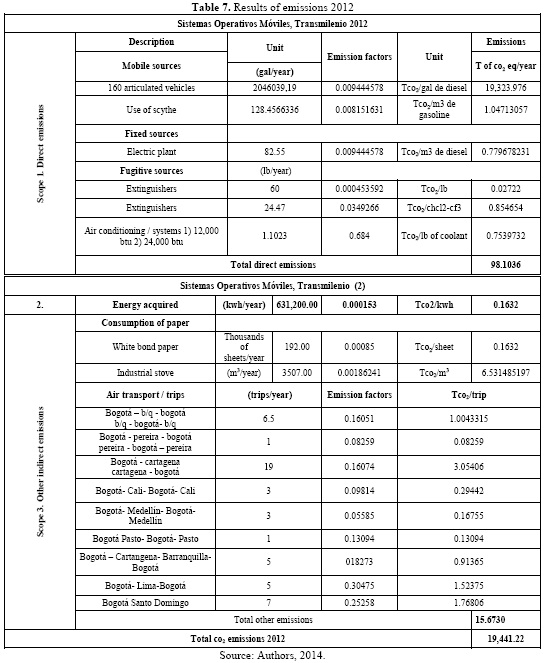
Carbon footprint measurements for the company Sistemas Operativos Móviles showed for 2012 a total of 19,441.22 tCO2eq. These values classified by emission sources are shown in Table 7.
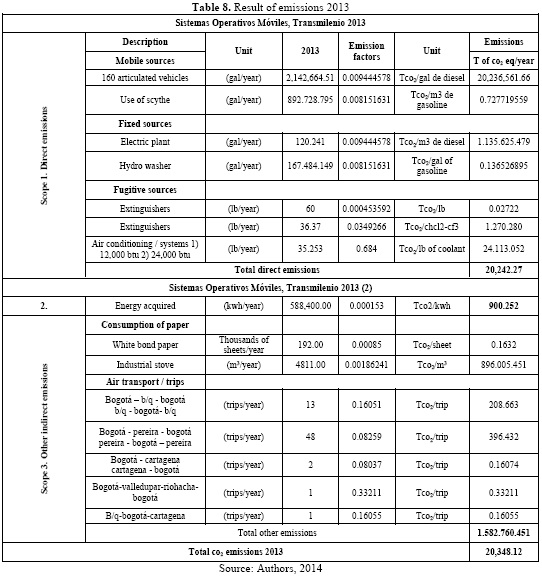
Carbon footprint measurements for the company Sistemas Operativos Móviles showed for 2013 a total of 20,348.12 tCO2eq. These values classified by sources are shown in Table 8.
4. Conclusions
For base year 2012, emissions through fuel consumption present a total of 19,323.97 tCO2eq and through energy consumption a total of 98.10 tCO2eq, with these emission sources being the most representative for a total organizational carbon footprint of 19,441.22 tCO2eq.
For 2013, the carbon footprint was equivalent to 20,348.12 tCO2eq; this was due to the increase of the fleet and, hence, the amount of fuel consumed, which increased by around 96,625.32 gal. This consumption corresponds to the emission of 912.58 tCO2eq; with respect to emissions from energy, consumption diminished by 52,800 kWh that correspond to the reduction of 8 tCO2eq/year.
Implementation of projects aimed at mitigating fuel consumption will reduce GHG emissions considerably.
Even though direct comparisons cannot be made of the emissions quantified with the total national emissions, because we have different years, it could be said that if we took as a starting point the emissions data provided by Colombia for 2004, which is 0.37% (180,010,000 tCO2eq), the 20,348.12 tCO2eq/year for 2013 from the company Sistemas Operativos Móviles correspond to 0.011% of the 0.37% of the country’s emissions.
Although the total emissions through fuel consumption represent 98% of the total emissions, 0.5% is caused by the use of electric energy, reflecting inefficiency regarding the application of low-consumption technologies.
References
[1] I.-. I. p. o. c. change, «Informe Especial del IPCC Escenarios de Emisiones,» VMO UNEP, 2000. [ Links ]
[2] I.-. G. i. d. e. s. e. c. climatico, «Cambio Climatico 2014, Impactos, adaptación y vulnerabilidad,» IPCC, Buenos Aires, 2014. [ Links ]
[3] Corporación ambiental empresarial, «Mecanismo para la mitigacion voluntaria de emisiones de carbono en Colombia,» Camara de Comercio de Bogotá, Bogotá, 2013. [ Links ]
[4] Ministerio de Ambiente y Desarrollo Sostenible, « Memoria de la segunda comunicación nacional de Colombia ante la CMNUCC,» Ministerio de Ambiente, 2010. [ Links ]
[5] IDEAM, «Inventario Nacional de gases de efecto invernadero,» Comunicacion nacional ante la convencion marco de las naciones, 2007. [ Links ]
[6] E. F. Viglizzo, «Huella de carbono, Ambiente y agricultura en el cono sur de sudamerica,» IICA, Montevideo, 2010. [ Links ]
[7] Observatorio de la sostenibilidad en España , «Manual de cálculo y reducción de huella de carbono para actividades de transporte por carretera,» 2011. [ Links ]
[8] SGS, «SGS,» 2013. [En línea]. Available: http://www.sgs.co/. [ Links ]
[9] PNUMA, Programa de las naciones unidas para el medio ambiente, «Noticias- Residuos electronicos en latinoamerica,» PNUMA, 12 August 2011. [En línea]. Available: http://www.pnuma.org/informacion/noticias/2011-08/12/. [ Links ]
[10] ISO-, «ISO 14064-1_2006. Greenhouse gases,» ISO, 2006. [En línea]. Available: http://www.iso.org/iso/catalogue_detail?csnumber=38381. [ Links ]
[11] S. D. d. A. SDA, «Guia para la elaboracion del informe de huella de carbono corporativa en entidades publicas del distrito capital,» Secretaria Distrital de Ambiente , Bogotá, 2013. [ Links ]
[12] U. E. p. agency, «Emissions Factors & AP 42, Compilation of Air Pollutant Emission Factors,» 2013. [En línea]. Available: http://www.epa.gov/ttn/chief/ap42/. [ Links ]
[13] Ministerio de ambiente y desarrollo sostenible, «Fuentes Puntuales,» 2009. [En línea]. Available https://www.minambiente.gov.co/documentos/4169_051009_fuentes_puntuales.pdf. [ Links ]
[14] Secretaria Distrital de Ambiente, «Calculadora de CO2,» 2013. [En línea]. Available: http://www.ambientebogota.gov.co/web/sda/calculadora-co2-storm1. [Último acceso: 20 November 2013] [ Links ].
[15] I. c. a. o.-. A. u. N. s. agency, «International civil aviation organization,» 2013. [En línea]. Available: http://www.icao.int/Pages/default.aspx. [Último acceso: 4 September 2013] [ Links ].
[16] UPME- Unidad de planeación Minero energetica, «Factores de emisión de los combustibles fósiles,» Ministerio de MInas y energia, Bogotá, 2003. [ Links ]
[17] I.-. I. E. Agency, «CO2 Emissions from fuel combustion- Highligts,» IEA, Paris, 2013. [ Links ]
