


Services on Demand
Journal
Article
 English (pdf)
 Article in xml format
 Article references
 Send this article by e-mail
Indicators
-
 Cited by SciELO
 -
 Access statistics
Related links
-
 Cited by Google
 -
 Similars in
SciELO
Similars in
SciELO -
 Similars in Google
Share

 Permalink
Tecciencia
Print version ISSN 1909-3667
Tecciencia vol.9 no.17 Bogotá July/Dec. 2014
https://doi.org/10.18180/tecciencia.2014.17.1
DOI: http://dx.doi.org/10.18180/tecciencia.2014.17.1
Relationship of blood pressure with the electrical signal of the heart using signal processing
Relación entre la presión sanguínea y la señal eléctrica del corazón usando una señal de procesamiento
Gendy Monroy Estrada1, Luis Enrique Mendoza2, Valentin Molina3
1 Universidad de Pamplona, Pamplona, Colombia, glominini17@hotmail.com.
2 Universidad de pamplona, Pamplona, Colombia, luis.mendoza@unipamplona.edu.co
3 Universidad Escuela Colombiana de Carreras Industriales, Bogotá, Colombia, amolinam@ecci.edu.co
How to cite: Estrada, G. M. et al., Relationship of blood pressure with the electrical signal of the heart using signal processing, TECCIENCIA, Vol. 9 No. 17., 9-14, 2014, DOI: http://dx.doi.org/10.18180/tecciencia.2014.17.1
Received: 16/Aug/2014 Accepted: 20/Sep/2014 Published: 30/Nov/2014
Abstract
Blood pressure (BP) and the electrocardiographic (ECG) signal, or electrical signal of the heart, are physical measurements that provide insight into the behavior of the cardiac system. This paper presents a novel methodology, where for the first time the relationship between BP and ECG signal is shown. Initially, to perform this study, a signal sampling of ECG signals was performed on 20 patients: eighteen healthy, between 17 and 26 years old, and two with normal BP between 50 and 78 years old. Powerlab equipment was used to record the ECG signal, with electrodes used to capture the heart signal through the lead. Once the signal samples were obtained, the R and T waves in particular were studied with the aim of reading the systolic and diastolic blood pressure separately.
In order to obtain the BP with the ECG signals, we used a wavelet transform to identify the R waves and T waves, and then to perform segmentation on the signal and extract the systole and diastole portions from the original signal. Following this procedure, neural networks were applied in order to have a system with systolic and diastolic pressure values based on the ECG signals. This application led to a total success rate of 97.305% for systole and 95.65% for diastole. In conclusion, this article can be said to demonstrate the existence of a relationship between BP and ECG signals.
Keywords: Android OS, Artificial Neuronal Network, Blood Pressure, ECG, Heart, Signal, Wavelet Transform.
Resumen
La presión arterial (PA) y la señal electrocardiografica (SECG) o la señal eléctrica del corazón, son mediciones físicas que permiten conocer el comportamiento del sistema cardíaco. Este trabajo, presenta una metodología novedosa, donde por primera vez se muestra la relación entre PA y SECG. Inicialmente, para poder realizar este estudio, se realizó la toma de muestra de señales SECG, a 20 pacientes, 18 sanos entre los 17 y 26 años y 2 pacientes con PA anormal entre 50 y 78 año, para el registro de la SECG se utilizó el equipo powerlab, donde se usaron electrodos para capturar la señal del corazón a través de la derivación DI, una vez obtenidas las muestras de las señales, se estudió en espacial las ondas R y las ondas T, con el fin de tener caracterizada la presión arterial sistólica y diastólica separadamente.
Para poder obtener la PA a través de las señales SECG, usamos transformada wavelet para identificar las ondas R y las ondas T, para luego realizar una segmentación a la señal y extraer las porciones de sístole y diástole de la señal original. Seguidamente a este procedimiento se aplicó a redes neuronales con el fin de tener un sistema que diera valores de presión sistólica y diastólica basados en las SECG. Una vez aplicada a las redes neuronales, se logró un porcentaje total de acierto de 97,305 para sistole y de 95,65 para diástole. Finalmente, se puede decir que este articulo muestra que existe una relación entre PA y SECG.
Palabras clave: Corazón, ECG, presión arterial, señal, Sistema Operativo Android.
1. Introduction
Blood pressure is one of the physiological variables which, at present, most concerns experts in the field of health, and all the more so due to the lack of an alternative to the usual method - the sphygmomanometer. Determining blood pressure (BP) with other means, such as heart signals, would mean digitizing said parameter and guaranteeing precision in the sample, at the moment that health personnel require the blood pressure measurement, without having contact with the patient.
It is important to mention that the BP indicates the force with which blood is driven through the heart. This is divided into two sections - systole and diastole. Systole, or contraction, is the phase in which the blood contained in the atrium or ventricle is ejected, and diastole, or relaxation, is the phase in which the atrium or ventricle fill with blood.
On the other hand, the ECG signal represents the electrical activity of heart cells. This impulse causes the rhythmic contraction of the heart, where the electrical performance of the heart is represented by beats. Theoretically we can infer a relationship, since in the ECG we can identify the systole, starting from the peak of the R wave to peak of the T wave, and the diastole, starting from the peak of the T wave to the peak of the R wave. These two vectors can be identified in the ECG signal because each begins in a different zone.
This subject has been studied by various researchers, and multiple studies have developed tools for studying these physiological signals [1] [2] [3] [4] [5] Our study's contribution is the revelation of a clear relationship between BP and ECG signal [6] [7] [8] [9]. The difference between our work and other studies is that we relate the two via signals processing.
Among the most important studies is "Using the heart harmonics in the oscillometry to extract the blood pressure." This study managed to find the first relationship, since it investigated the possibility of extracting the systolic and diastolic pressure of the heart with the heart's fundamental frequencies and harmonics. They present an algorithm for obtaining the systolic and diastolic pressure of blood pressure in cardiac systems, whose harmonics work with the same accuracy as commercial devices [10].
In recent years, information and medicine have come together, giving birth to telemedicine and causing major changes and important contributions in the area of health, all of which enable us to offer patients better conditions and lifestyles [11].
To carry out our study, the ECG signal was acquired by means of physical acquisition circuits or specialized equipment such as Powerlab, Once this signal is obtained, processing is applied to it by the wavelet transform. Segmentation is performed on the signal, extracting the systolic and diastolic components from the ECG signal. A database is created, and then this information is entered into a system of artificial neural networks (ANNs) that parameterize the signal. In the end, we have a visualization of the blood pressure of our patient.
The idea of this study arises because BP is currently found to be among the major sources of demand for health services in the adult population, requiring the patient to have their pressure constantly monitored and thereby causing great patient congestion in health centers while they wait for their pressure to be taken.
This study may also in the future allow for the constant monitoring of BP so that the patient can keep track of their BP every so often.
2. Methodology
The methodology consists of 5 stages. A diagram of this methodology is shown in Figure 1 below:
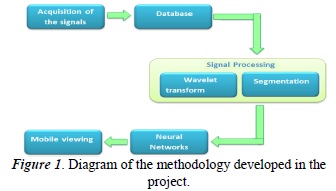
Each stage is explained below.
2.1. Acquisition of the ECG signal
At this stage the acquisition of the electrocardiographic signal is performed via Powerlab, a data acquisition system consisting of both hardware and software. It is commonly used in human physiology to record and analyze signals.
2.2. Database
In this project, the database will consist of age, sex, manually-taken blood pressure, and ECG signals, the latter being the basis for this entire study.
The study involved six healthy men, all students, and six women, of which two were elderly with impaired blood pressure and four were students with no blood pressure problems. The age of the students ranged from 17 to 26 years old while the age of the two elderly subjects ranged from 50 to 78 years old. The sampling was performed both sitting up and lying down. This was done in order to analyze whether the ECG signal varies according to the way in which the sample is taken - after the analysis it was determined that in fact the position has no effect on the variation of the ECG signal.
2.3. Processing
The processing and segmentation of ECG signals, to extract the portions of the signal which indicate systole and diastole, are performed with wavelet transforms.
The mathematical representation of the discrete wavelet transform is defined in Equation 1, [12] [13].
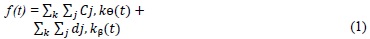
The aim of the processing in this case was to identify the peaks of the R waves and T waves. A wavelet transform was used to perform this identification, since it analyzes the signal in time and can characterize its frequency.
In this case, the detail components and discrete wavelet transform were selected. To select the wavelet families, different wavelets underwent testing until the appropriate one was determined. In our case, we chose the 'sym1' wavelet, to detect the maximum amplitude of the R wave, and a 'sym7' wavelet, to detect the maximum amplitude of the T wave.
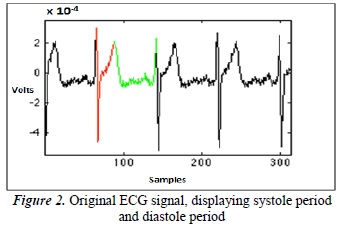
Once the peaks of the R and T waves are identified, the segments containing the information thereof are extracted. In an ECG signal, the systole is identified from half of the maximum amplitude of the R wave (red) until the maximum amplitude of the T wave (green), and the diastole from half of the maximum amplitude of the T wave until half of the maximum amplitude of the following R wave. This can be seen in Figure 2.
- 2.4.Neural Networks
The objective of the application of neural networks is to characterize the portions of systole and diastole extracted from the ECG signal. Figure 3 shows a probabilistic neural network. It consists of multiple inputs, the hidden layer that is responsible for performing the process internally, and the output layers that display the result [14] [15] [16]
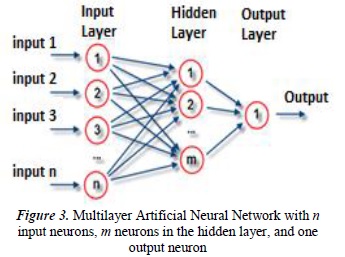
The input neurons are scaled by multiplier weight, and these inputs are weighted and then summed, as described in Equation 2.

Where X is the signal input, W is the multiplier weight, i is the channel input, and N is the total number of entries.
Neural networks were used to perform training and classification for this study. Two neural networks (ANNs) were used, one for systole and the other for diastole.
In the training of the two ANNs, we used the systole portions of the ECG signal and the actual systolic pressure measurements of each patient for the systole network, and the diastole portions of the ECG signal and the actual diastolic pressure measurements of each patient for the diastole network.
Once the ANN was trained, we proceeded to validate the system. The validation was performed with portions of systole and diastole that were not used in training and portions of systolic and diastolic signals of patients that were not used in the training. The obtained results were intriguing because they showed that a relationship does indeed exist between BP and ECG signal - even though it has not yet been determined where or what the relationship is. Nonetheless, it does effectively exist.
3. Results
The results corroborate the remarks made in previous sections. A number of tests were performed for the acquisition of a good ECG signal. The signals showed variations due to computer interference and patient movement.
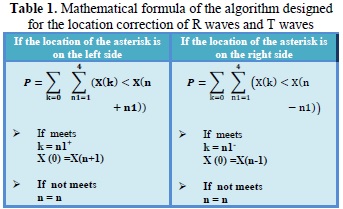
Once the signals were acquired, wavelets were selected. Figure 4 shows the location of the R wave, identified by red asterisks, and the T wave, identified by purple asterisks. Notice how the indicators of the R wave and T wave are positioned correctly. We designed an algorithm for the location correction of R waves and T waves.
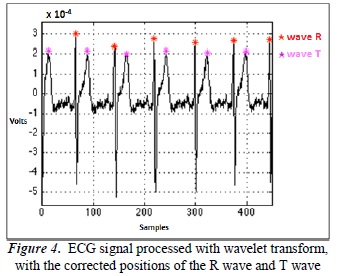
The mathematical formulas used to design the algorithm for the location correction of R waves and T waves are shown in Table 1.
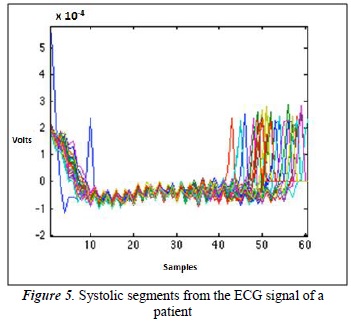
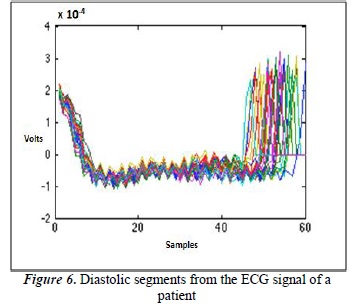
Once the R waves and T waves are correctly identified, the segmentation and extraction of the systolic and diastolic segments follow. Figures 5 and 6 show all the systolic and diastolic segments from the ECG signal of a patient. In this case, each signal has 50 systolic segments and 50 diastolic segments.
The results of the ANN coaching and classification were essential for corroborating the existence of a relationship between BP and ECG signal.
To determine the efficiency of the system, the error rate is determined using Equation 3.

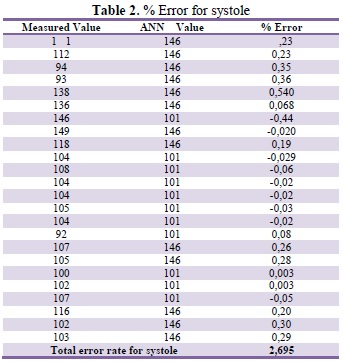
With the error rate obtained, it was determined that this methodology opens up a new way of measuring BP. That said, there is no denying that there are minor errors. This thus represents a starting point for improving upon these results. The averages of error obtained were 2.695% for systole and 4.35% for diastole, taking into account that there are no bibliographical references on the subject at this time with which to make comparisons.
Within these error rates, cases of false positives were found (see Table 1 and Table 2) - in other words, patients who are healthy and are shown to be ill - as well as cases of false negatives - patients who are ill and shown to be healthy. These system errors should be ameliorated in the future.
4. Conclusions
This system of recording, measuring, and visualizing is a useful alternative for taking blood pressure. In the future it will allow for the constant monitoring of blood pressure, on the part of the patient as well as medical centers. So if, for example, Intensive Care Units (ICUs) had a system of ECG signal acquisition, they could automatically measure blood pressure and achieve the simultaneous multi-monitoring of all patients in real time.
At the moment, we intend to display this data on mobile systems, since it would be very exciting to monitor this variable on such devices. It is important to mention that at present we are at work on a broad database for measuring the BP of newborns, infants, adolescents, adults, and seniors, ensuring that the system is error-free or at least has the lowest possible rate of errors.
For the acquisition of a good signal in PowerLab, it is important to ensure that patients make a minimum amount of movement while the signal is being obtained and to avoid all interference to obtain a clean, noise-free signal. Once the ECG signal is obtained, the R waves and T waves are identified. It is important at this point to make an appropriate mother wavelet selection. This is done through tests to ensure the exact position of the waves, and thus to extract the systolic and diastolic segments from the ECG signal without any problems. Once the system generates the BP values, they are compared with the values from our database - in this way, we validate the BP values generated by the neural network.
With the use of neural networks, the existence of a relationship between ECG signals and blood pressure is demonstrated. More in-depth study is required to determine the exact point of the ECG signal in which the patient's blood pressure can be determined.
With an interface developed for mobile viewing, a practical tool of easy use and - being designed for the Android operating system - of easy access, can be offered.
References
[1] T. Bodisco, J. D'Netto, N. Kelson y J. Banks, «Computation of ECG Signal Features Using MCMC Modelling in Software and FPGA Reconfigurable Hardware,» Procedia Computer Science, vol. 29, pp. 2442-2448, 2014. [ Links ]
[2] K. Lim, J. Jeon, M. Gyeong, H. S.B., B. Ko, S. Bae y K. S. E. Shin, «Patient-Specific Identification of Optimal Ubiquitous Electrocardiogram (U-ECG) Placement Using a Three-Dimensional Model of Cardiac Electrophysiology,» Biomedical Engineering, vol. 60, nº 1, pp. 245-249, 2012. [ Links ]
[3] A. Elbuni, S. Kanoun, M. Elbuni y N. Ali, «ECG Parameter Extraction Algorithm using (DWTAE) Algorithm. Computer Technology and Development. ICCTD,» de Computer Technology and Development, 2009. ICCTD '09. International Conference on (Volume:2 ), kota Kinabalu, 2009. [ Links ]
[4] L. Mirmohamadsadeghi y J. Vesin, «Respiratory rate estimation from the ECG using an instantaneous frequency tracking algorithm,» Biomedical Signal Processing and Control, vol. 14, pp. 66-72, 2014. [ Links ]
[5] P. Davey, «ECG,» Medicine, vol. 42, nº 8, pp. 423-432, 2014. [ Links ]
[6] A. Amritpal S, B. Barjinder y G. Gurmej Singh, « ECG vs. blood pressure (systolic, diastolic, mean and pulse) An extended approach to baroreflex sensitivity.,» Journal of Electrocardiology. , vol. 46, nº 4, p. 21, 2013. [ Links ]
[7] A. Villecco, D. de Aloysio, E. de Liberali, G. Ferrari y M. Mauloni, «High blood pressure and 'ischaemic' ECG patterns in climacteric women,» Maturitas, vol. 7, nº 2, pp. 89-97, 1985. [ Links ]
[8] V. Corino, F. Lombardi y L. T. Mainardi, «Blood pressure variability in patients with atrial fibrillation,» Autonomic Neuroscience. , vol. 185, pp. 129-133, 2014. [ Links ]
[9] G. Ward, P. Milliken, B. Patel y N. McMahon, «Comparison of non-invasive and implanted telemetric measurement of blood pressure and electrocardiogram in conscious beagle dogs.,» Journal of Pharmacological and Toxicological Methods. , vol. 66, nº 12, pp. 106-113, 2012. [ Links ]
[10] F. L. Y. K. W. V. M. K. Barbe, «Using the heart harmonics in the oscillometry to extract the blood pressure.,» de Medical Measurements and Applications Proceedings (MeMeA), 2013 IEEE International Symposium , Gatineau, 2013. [ Links ]
[11] C. R. Ibáñez, Á. Z. de Cadena y A. T. Zea, «Telemedicine: Introduction, application and development principles.,» Revista CES Medicine, vol. 21, nº 1, pp. 77-93, 2007. [ Links ]
[12] A. Awal, S. Shanawaz M, M. Ahmad y M. Abdur R, «An adaptive level dependent wavelet thresholding for ECG denoising. Biocybernetics and Biomedical Engineering,» Biocybernetics and Biomedical Engineering, vol. 34, nº 4, pp. 238-249, 2014. [ Links ]
[13] U. R. L. C. M. R. Joy Martis, «ECG beat classification using PCA, LDA, ICA and Discrete Wavelet Transform.,» Biomedical Signal Processing and Control. , vol. 8, nº 5, pp. 437-448, 2013. [ Links ]
[14] J. Sprockel, J. Diaztagle, W. Alzate y E. González, «Networks for the diagnosis of acute myocardial infarction.,» Revista Colombiana de Cardiología., vol. 21, nº 4, 2014. [ Links ]
[15] R. Nayak, L. Jain y B. Ting, «Artificial Neural Networks in Biomedica Engineering: A Review. Computational Mechanics,» New Frontiers for the New Millennium, p. 887-892, 2011. [ Links ]
[16] G. Sallo y L. David, «Distributed Approximating Functional Wavelet based neural network in ECG signal processing. Automation, Quality and Testing, Robotics.,» de IEEE International Conference., 2006. [ Links ]
