


Services on Demand
Journal
Article
 English (pdf)
 Article in xml format
 Article references
 Send this article by e-mail
Indicators
-
 Cited by SciELO
 -
 Access statistics
Related links
-
 Cited by Google
 -
 Similars in
SciELO
Similars in
SciELO -
 Similars in Google
Share

 Permalink
Tecciencia
Print version ISSN 1909-3667
Tecciencia vol.9 no.17 Bogotá July/Dec. 2014
https://doi.org/10.18180/tecciencia.2014.17.6
DOI: http://dx.doi.org/10.18180/tecciencia.2014.17.6
Evaluation of a hybrid system of renewable electricity generation for a remote area of Colombia using homer software
Evaluación de un Sistema hibrido de generación de energía renovable para un área remota de Colombia usando el software HOMER
Yecid Muñoz1, Julian Guerrero2, Adalberto Ospino3
1 Universidad Autonoma de Bucaramanga (UNAB), Bucaramanga, Colombia, ymunoz294@unab.edu.co
2 Universidad Autonoma de Bucaramanga (UNAB), Bucaramanga, Colombia, jguerrero9@unab.edu.co
3 Universidad de la Costa (CUC), Barranquilla, Colombia, Aospino8@cuc.edu.co
How to cite: Muñoz, Y. et al., Evaluation of a hybrid system ofrenewable electricity generation for a remote area of Colombia using HOMER software, TECCIENCIA, Vol. 9 No. 17., 45-54, 2014, DOI: http://dx.doi.org/10.18180/tecciencia.2014.17.6
Received: 16/Aug/2014 Accepted: 20/Sep/2014 Published: 30/Nov/2014
Abstract
Subsequent to the study of the energy demand and the evaluation of possible available resources in the remote area of Riosucio, Chocó region, Colombia, an analysis is performed on the implementation of three alternative systems of power generation. The first is a micro hydroelectric power station on the Truando River, which includes the design using HOMER software simulation, the costs of building and implementation, and its share in the energy mix. The second system is an array of photovoltaic panels in isolated configuration. This will include the design, via HOMER software simulation, of batteries, panel distribution, inverters, and connections, for a usable specific area restricted by the limited solar resource of the area. Finally, wind power is analyzed, a system that will include the determination of the most suitable turbine for the available wind resource in the area, as well as the analysis of the ideal quantity of wind generators based on its share in the energy mix and associated costs.
For each of the assessed systems, a financial analysis and the feasibility are obtained, based on the investment, percentage of energy, and the electricity savings for each of the homes.
Keywords: Renewable Energy, HOMER Software, Energy Mix, Simulation, Generation Isolated Areas.
Resumen
Posterior al estudio de la demanda energética y evaluación de los posibles recursos disponibles en la zona aislada de red eléctrica, de Riosucio Chocó en Colombia, se plantea un análisis de implementación de tres sistemas alternativos de generación: Una microcentral hidroeléctrica en el río Truando, el cual incluye el diseño por simulación con HOMER software además de los costos de construcción e implementación, así como su porcentaje energético de participación; un arreglo de paneles fotovoltaicos, en configuración aislada que incluirá el diseño por simulación con HOMER software de baterías, distribución de los paneles, inversores y conexiones, para un área específica aprovechable teniendo como limitante el recurso solar de la zona, y por último generación con energía eólica, sistema que incluirá la determinación de la turbina más apta para el recurso eólico disponible en la zona, así como el análisis la cantidad óptima de generadores eólicos, basándose en la participación energética y los costos.
De cada uno de los sistemas dimensionados se obtiene un análisis financiero, y de pre factibilidad según la inversión, porcentaje de participación energética, y el ahorro de energía eléctrica para cada una de las viviendas.
Palabras claves: Energía Renovable, HOMER Software, Mix Energético, Simulación, Generación Zonas Aisladas.
1. Introduction
Renewable energy is the solution to the environmental problems and energy deficiencies that the world currently faces. In remote populations, furthermore, the energy potential of the sun, water, and air is vital for the development of sustainable systems, given the high cost of transportation and distribution of energy. Economically and environmentally, such energy is the best alternative for these populations.
In this paper, we will apply a variety of evaluations and analyses on photovoltaic, wind, and hydropower systems. We will optimize various energy supply alternatives for a specific region where carrying out a sustainable energy project is feasible and where the environmental conditions, solar radiation, wind speed, and stream flow are optimal for its implementation, always striving for the best option in terms of investment, costs, energy efficiency [1], and return on investment.
HOMER software is our simulation tool of choice, due primarily to studies such as [2], in which an analysis of assistance tools for energy planning is performed, with special emphasis on the utilization of renewable energy. In the initial selection, the author considers HOMER, Hybrid2, INSEL, MATLAB, PROLOAD, RETScreen, RPM-Sim, SIMENERG, WDLTOOLS, and WINSYS software. In the end he focuses his study on HOMER, Hybrid2, and RETScreen, since all are highly-cited in the technical literature and have been developed by organizations which have ample experience with the issues of energy supply in remote regions and renewable energy. The study concludes that HOMER is less detailed than other simulation models for microgeneration systems, but nonetheless is more detailed in its statistical models and is the most flexible software in terms of systems that can simulate. Thus, for our study, we opted for HOMER software as a support tool for our planning methodology and for the operation of energy supply in isolated regions.
Information provided by the Institute for Planning and Promotion of Energy Solutions for Non-interconnected Areas [IPSE], which is in charge of energy supply in remote regions of Colombia, indicates that there is an electricity deficiency in the municipality of Riosucio, in the Chocó department of Colombia. Only 38.7% of homes are connected to electricity and there is no natural gas. Riosucio, located in western Colombia, has high rainfall and is bordered by the Truando River, which has a high potential for the adoption of a micro-hydropower system. On the other hand, besides hydropower, wind and solar resources will also be analyzed, relying on information from NASA, IDEAM, and CORPOEMA databases, as well as firsthand information from the IPSE.
2. Methodology
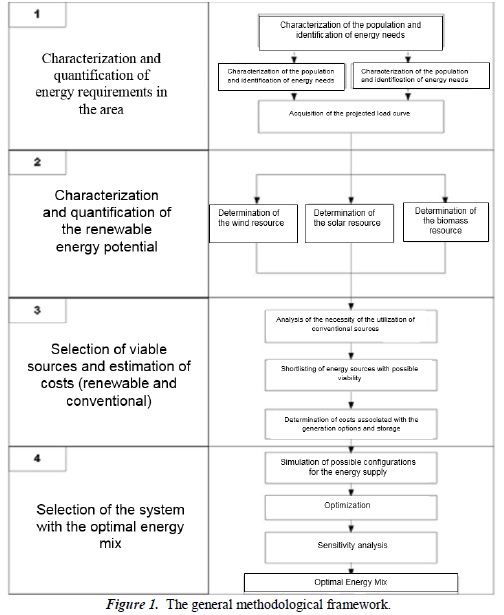
In order to take full advantage of this study, as a basis for the development of electrification systems in remote regions we first present a general methodology for regions which are not interconnected to the national grid in any way, with subsequent emphasis on regions with similar characteristics to our target region.
The concept of energy planning involves finding a selection of sources and conversion equipment with which the requirements/demands of all tasks are optimally met [3]. This "optimal" level depends on the defined objectives, such as minimizing total annual energy costs, minimizing the use of non-local resources, or maximization of the global efficiency of the system.
The design of hybrid systems is profoundly influenced by two components: one, the amount of energy that is expected from renewable resources, and two, the ability of the system to maintain a power balance between generation and consumption [4]. In the energy systems of isolated regions, the relationship between the level of reliability of supply and the cost of the system is much more pronounced in comparison with interconnected systems [5]. Thus, when designing the system, the characteristics of the future load and the operating modes of the system must be studied, with the aim of evaluating the efficiency of future operation and their impact on project execution.
The methodology that is presented here has as its principle objective the selection of generation sources which best adapt to existing energy resources and area demand, striving always for the optimization of resources and the optimal balance between generation and demand, seen in Figure 1.
3. Analysis of energy demand
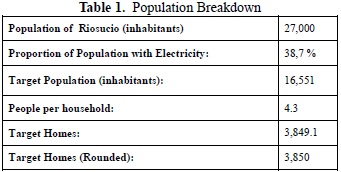
The population of Riosucio is 27,000, of which, according to the latest (2005) census of the National Administrative Department of Statistics (DANE), 38.7% have access to electricity. The target population for the supply of renewable energy, therefore, is 16,551 residents. With an average of 4.3 residents per household, 3,850 homes can be presumed in need of energy supply. See Table 1.
Now that we have the amount of target homes estimated, we shall proceed to carry out an estimation of consumption per household, in accordance with the consumption characteristics of the area and with the goal of finding an estimated median daily consumption for the area (see Table 2).
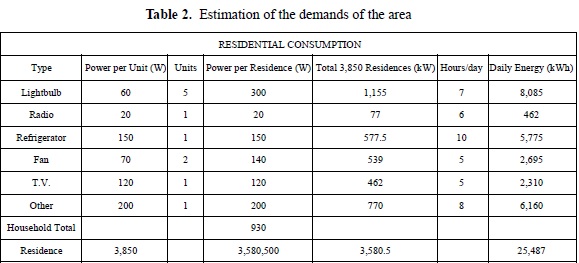
Each home consumes a total of 930W, which refers to the basic services of lighting, television, radio, refrigeration, fans, and others. Thus, the consumption of the 3,850 homes is 3,581kW, taking into account that the socioeconomic conditions do not vary much from one home to another.
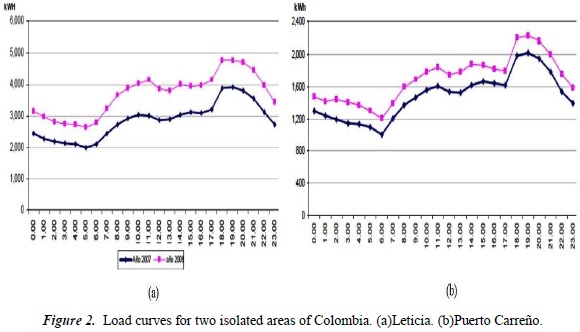
3.1. Load Curve Projection
For the projection of our load curve, we have obtained the load curves of an average day for other remote regions of Colombia. Contrasting these curves, one finds a similar pattern, as can be observed in Figure 2 for the areas of Leticia and Puerto Carreño. On the other hand, the operator of Colombia's electricity grid, the company XM, has provided us with the average daily demand curve of Colombia on a weekday, expressed in percentage in Figure 3. Contrasting this curve with those of the remote areas demonstrates the similarity in the consumption pattern and shows that it is viable to apply this national consumption curve to our remote area.
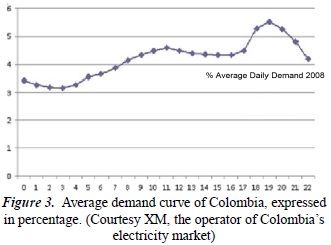
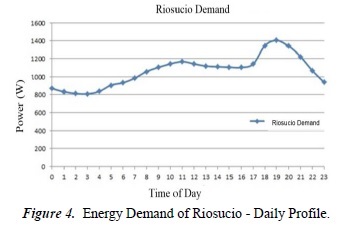
Applying the percentages to the demand calculated in Table 2, we obtain the following curve for the zone of study, which indicates an average annual consumption of 25,487 kWh, with a daily peak load of 1450kW.
4. Analysis of energy resources
4.1. Wind resource
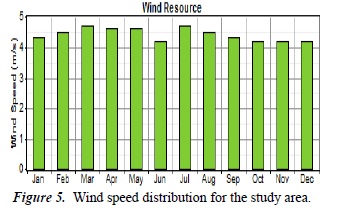
To determine the area's average monthly wind speed and average annual speed, we turn to NASA's meteorological database. Data in the coordinates of Riosucio, Chocó (latitude:26.26, longitude: 07.08) show an annual average of 4.4 m/s, which indicates that the speed of the resource in the area is low.
Subsequently, wind frequency and speed were modeled. Applying the Weibull distribution, it was determined that the best fit corresponds to k = 1,99 y c = 4,99 (m/s). Introducing this data into the software gives us the monthly distribution graph and the Weibull distribution graph, in Figures 5 and 6, respectively.
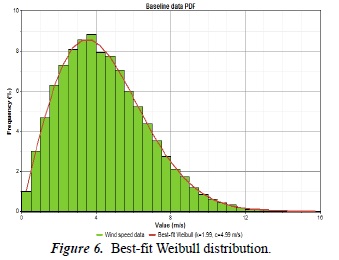
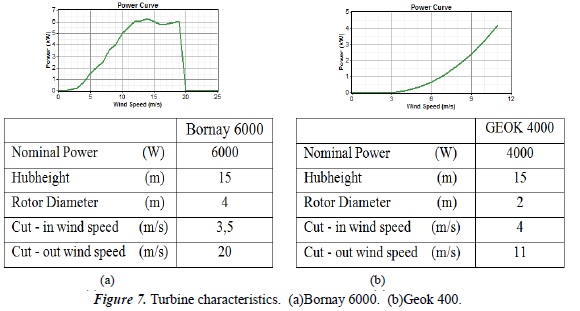
In the following tables you will find the specific characteristics of the chosen wind turbines, taking into account the behavior of wind speed [6]. This is based on the Weibull graph given by the software above, in which one observes that the low speeds with a range of 3-6 m/s are those which appear most frequently. Hence, the chosen wind turbines must be low-speed, otherwise they would not have an effect and they would not be contributing to the production of energy.
To establish the capital investment costs, a factor of 1.5 euros per kW of power produced by each wind turbine was taken into account. Masonry work and public works were included in this factor. On the other hand, the cost of each wind turbine was established according to literature found in energy journals.
4.2. Hydro resource
The water resource data in the area was provided by the Institute for Planning and Promotion of Energy Solutions for Non-interconnected Areas [IPSE] and collected by the Institute of Hydrology, Meteorology and Environmental Studies [IDEAM] from the station "La Nueva" on the Truando River, adjacent to the municipality of Riosucio, Chocó. From the data, a ten-year series is analyzed and used to simulate the average monthly stream flow.
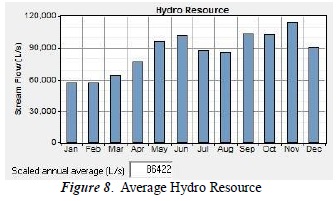
For the simulation of the hydro resource, an ecological stream flow of 11,362 L/s is taken. Even though it is possible to have a large-scale hydroelectric plant given the available stream flow, this would incur huge costs. Therefore, the Kaplan turbine is selected, due to the heavy stream flow that it handles, and at a head of less than 10m due to the topography of the terrain.
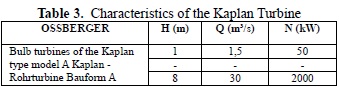
The specifications of the Ossberger Turbine are shown in Table 3. The turbine maintains an efficiency of around 85%, handling a water flow of 12 m³/s and a net head of 8m for the characteristics of the turbine, taking into account the operation curve.
The costs of the turbine, the public works and the equipment are taken from a study by England's University of Lancaster [7] where a Hydro Resource Evaluation Tool was developed. The tool employs formulas which estimate the cost of the turbine in euros and its share in the total cost of implementation.
The formula for estimating the costs of a Kaplan turbine which handles flows between 5.0m3/s - 30m3/s is given by:

Where Q and H are 12 m3s and 8 m, respectively, and Ck is in euros. We use a conversion rate to dollars of $1.2865 USD/€.
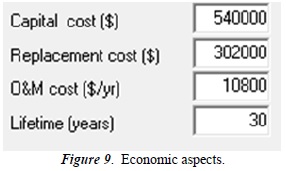
To determine the costs of the public works and equipment, we begin with the assumption that the cost of the turbine Ck represents 30% of the total cost and that the cost of public works and equipment represent 55%. This adds up to 85%, without taking into account the cost of both Design and Taxes (15%), which are not introduced in HOMER [8].
Furthermore, the cost of operation and maintenance stand at 2% of the capital cost, and the expected lifetime is taken as 30 years. The result is:
4.3. Solar resource.
The solar resource in the western region of Colombia is very abundant. Nonetheless, one must take into account the climatological considerations of the region, such as precipitation arising from a great deal of cloudiness, which leads to a much diminished solar resource which is not very constant throughout the year.
From the above, we can forecast that the role of the photovoltaic system in the energy mix is not going to be very significant.
The NASA database was used to obtain the monthly solar radiation, through 2005, of Riosucio, Chocó, with the coordinates of 7° 27' North, 77° 6' West, and with an average annual temperature of 28°C.
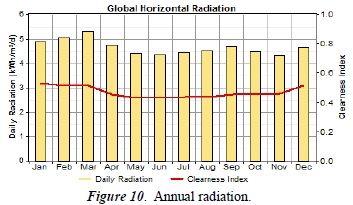
There is a monthly average of 4.64 peak hours, with which we analyze the total amount of energy that the system can produce. The total system was designed with a performance ratio of 0.8 and a lifetime of 20 years, based on [9].
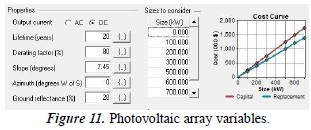
The following sizes of photovoltaic array (in kW) were considered: 0, 100, 200, 300, 400, 500, 600, 700.
The angle of the placement of the panels is 7.45°, and the clearness index of the terrain is 20%. The external effect of the temperature was not considered, since these losses are considered in the global efficiency of the system, or the performance ratio.
The cost of each installed Watt is $2.50 USD for implementation, with a replacement cost of 80%, and a cost of operation and maintenance of 0.016% per year above the total cost of implementation.
The costs were taken from the prices published by Spanish solar manufacturer ATERSA, based on 250P polycrystalline panels which have 250W of power and an efficiency of 14%.
5. Components of the hybrid system
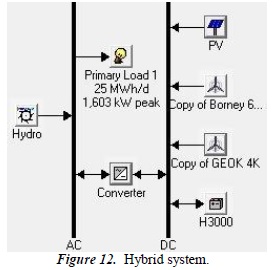
The hybrid system is composed of wind generators, a photovoltaic system, a hydropower generator, batteries, and a converter. In this context, the properties of the main components had to be determined in order to supply the AC load [10].
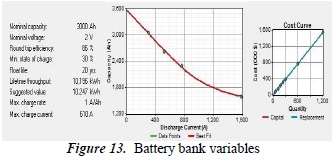
5.1. Batteries.
The Hoppecke 24 OPzS 3000 batteries were chosen, and their nominal characteristics thus follow. The cost of a battery is in the order of $1,286 USD, with which HOMER performs a scaled cost curve to determine the cost of all necessary batteries.
The size of battery string to consider ranges from 0 to a maximum value of 200, with each string having 6 batteries conforming to a total voltage of 12V.
5.2. Converter.
A converter was used with an efficiency of 90% and a shelf life of 15 years. The costs of investment are approximately $3 USD per kW, with a replacement cost of 100% and a maintenance percentage of 0.016% of the total cost of investment per year.
The variation in size in kW has a maximum value of 700 and minimum value of 10.
6. Operating principles of the hybrid system
The designed system will take into account the following considerations:
- The wind turbines and the photovoltaic array will charge the batteries, in order to provide the energy in AC by means of a converter.
- The system has a reliability of 98% per year; in other words, the coverage by all types of renewable energy only fails to cover 2% of the total annual demand.
- If the solar array and the wind turbines cannot support the demand, the battery bank will not charge, but rather will deliver the necessary energy together with the hydropower generator.
- The operating reserve is 10% of the hourly load. Meanwhile, the operating reserves of renewable generation are 20% for solar energy and 30% for wind energy. It should be made clear that the operating reserve is the margin that allows the supply of a reliable system, no matter the load variation, solar resource, or wind resource.
- In the sensitivity analysis, wind speed varied in a range of 3 m/s to 4.42 m/s, due to its variable nature in the area.
- The lifetime of the project is considered to be 25 years.
- The annual interest rate for Colombia is taken as 8%.
- The fraction of renewable resources for the hybrid system is 100%.
7. Results
According to hybrid system optimization, the optimal combination given a wind speed of 4.2 m/s is composed of a photovoltaic array of 100kw, fifty 6kW wind turbines, an 800kW hydropower generator, a 600kW converter, and a string of 300 batteries with the lowest VPN. This is at a cost of $3,086,735 USD and an energy cost of $0.026 USD per kWh.
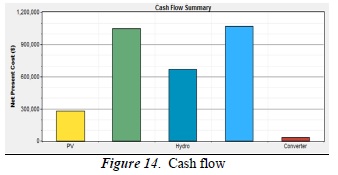
One observes in this figure that the battery bank (the green bar) represents the greatest capital cost, followed by the 6kW wind turbines (the blue bar). The net percentage of each cost is: the converter at 0.9%, the photovoltaic system at 9%, followed by the hydropower costs at 21.5%, the wind turbines at 33.8%, and the battery bank at 34.8%.
At wind speeds lower than 3.5 m/s, the wind generator system does not enter into the energy mix and the load is sustained only by the photovoltaic system and hydropower system.
The system tolerates an increase in load of up to 9% of the energy demand. Nonetheless, it should be highlighted that the population in the area has been decreasing in the last five years.
The photovoltaic array has a very limited role, at 7%, due to a high percentage of shade caused by rainfall, this being one of the rainiest locations in Colombia.
Because part of the load, 2%, remains uncovered, this increases on days of low solar radiation, and the wind energy is not sufficient to charge the batteries because of climate conditions.
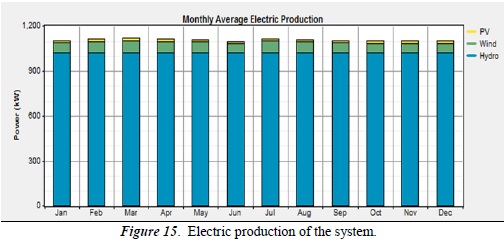
When the wind reaches speeds of 4 m/s, the energy mix takes into account all sources of energy (wind, solar, hydro, and battery) at a participation rate of 17.2% for wind, 55% for hydropower, 7% for solar, and 20.8% for batteries at peak load.
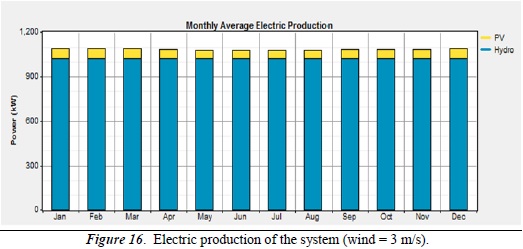
When the wind speed is at 3 m/s, the wind turbines cannot generate power, since generation begins at values greater than 3.5 m/s. Therefore, the system will be supported by the photovoltaic array at 27%, the hydropower generator at 55%, and the batteries at 18% of peak load.
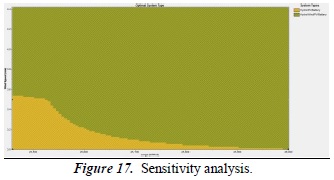
The sensitivity analysis that was carried out was based on the variation of wind speed from 3 m/s to 4.2 m/s, and the load increase of 8%. Below, the sensitivity graph is shown.
We conclude that starting at wind speeds at or above 3.5 m/s, the system can consist of the three resources: hydro, photovoltaic, wind, and the batteries, while at wind speeds of lower than 3.5 m/s, the wind turbines have no effect.
The simulation was executed in two different versions of HOMER — the previous version, v2.68 beta, and the most recent version, v2.81. Various inconsistencies were observed in the results, since at very low wind speeds in which no wind turbine can produce energy, the result yields a combination of included wind turbines. Unlike the older version, which is consistent in its results regarding wind speed, the newer version of HOMER is deemed to be fairly unreliable and should be subject to improvements.
8. Conclusions
This paper has laid out a methodology for selecting the components that would make up the optimal system for the generation of electricity in remote areas, considering the technical, economic, and social elements that are involved in planning and operation. Existing planning tools and techniques were investigated, and it was determined that HOMER software is the most appropriate tool for the application of this methodology. Nevertheless, the analysis emerging from the application of HOMER demonstrates inconsistencies in the results from version 2.81 which are not apparent in the previous version, v2.68 beta.
The methodology has been applied in the remote area of Riosucio, Colombia, where it was found that a system that combines photovoltaic, mini-hydro, and mini-wind power is highly sensitive to wind speed; therefore, it is necessary to have the wind speed data from the past two years in order to avoid uncertainty in the use of this resource.
The study also shows that the curves in the remote areas of Colombia share many similarities both between them and with the load curve of the interconnected national grid, given that the latter is imposed by the behavior of the residential sector. Accordingly, it is possible to use the behavior of the interconnected system in order to predict demand in a remote area.
Acknowledgements
The authors wish to give special thanks to Diana Zafra and Sebastián Rivas for providing valuable information for this study.
References
[1] T. Givler y P. Lilienthal, «Usign HOMER software, NREL's Micropower Optimization Model, to Explore the role of gen-sets in small solar power systems.,» National Renewable Energy Laboratory., Colorado, 2005. [ Links ]
[2] P. S. Georgilakis, «State of the art of decision support systems for the choice of renewable energy sources for energy supply in isolated regions,» International Journal of distributed energy resources, vol. 2, n°; 2, pp. 129-150, 2005. [ Links ]
[3] R. Hiremath, S. Shikha y N. Ravindranath, «Decentralized energy planning; modeling and application-a review.,» Renewable and Sustainable Energy Reviews, vol. 11, n°; 5, pp. 729-752, 2007. [ Links ]
[4] T. Ackermann, Wind Power in Power Systems. Second Edition, United Kingdom: Wiley, 2012. [ Links ]
[5] National Technical University of athens et al., «Renewables for isolated systems- energy supply and waste water treatment. Technical Annex,» Eusopean Commssion, Sixth framework programme, RISE Project., Greece, 2007. [ Links ]
[6] K. Kornbluth, R. Hinokuma, E. Johnson y Z. McCaffrey, «Optimizing wind energy for a small hybrid wind/Diesel Grid in the galapagos islands,» de Cape Peninsula University of technolohy domestic use of energy (DUE) Conference Journal, 2009. [ Links ]
[7] G. e. a. Aggidis, «The costs of small-scale hydro power production: Impact on the development of existing potential,» Renewable Energy, vol. 35, n°; 12, pp. 2632-2638, 2010. [ Links ]
[8] T. Lambert, P. Gilman y P. Lilienthal, «Chapter 15. Micropower System modeling with homer,» de Integración of alternative sources of energy, Hoboken, Wiley, 2005, pp. 379-418. [ Links ]
[9] J. Bernal y R. Dufo, «Simulation and optimization of stand-alone hybrid renewable energy systems,» Renewable and Sustainable Energy Reviews, vol. 13, n°; 8, pp. 2111-2118, 2009. [ Links ]
[10] A. Kanase-Patin, R. Saini y M. Sharma, «Integrated renewable energy systems for off grid rural electrification of remote area.,» Renewable Energy, vol. 35, n°; 6, pp. 1342-1349, 2010. [ Links ]
