


Services on Demand
Journal
Article
 English (pdf)
 Article in xml format
 Article references
 Send this article by e-mail
Indicators
-
 Cited by SciELO
 -
 Access statistics
Related links
-
 Cited by Google
 -
 Similars in
SciELO
Similars in
SciELO -
 Similars in Google
Share

 Permalink
Tecciencia
Print version ISSN 1909-3667
Tecciencia vol.10 no.18 Bogotá Jan./June 2015
https://doi.org/10.18180/tecciencia.2015.18.1
DOI: http://dx.doi.org/10.18180/tecciencia.2015.18.1
Hybrid model of the spread of Toxoplasmosis between two Town of Colombia
Modelo híbrido de propagation de la toxoplasmosis entre dos pueblos de Colombia
Carlos Peña1*, Karen García2 Hermes Martínez3
1 Universidad Sergio Arboleda, Bogotá, Colombia, carlos.pena@usa.edu.co
2 Universidad Sergio Arboleda, Bogotá, Colombia, karempgarcia@gmail.com
3 Universidad Sergio Arboleda, Bogotá, Colombia. hermes.martinez@usa. edu.co
* Corresponding Author. Tel: + 57 3257500 Ext. 2802 E-mail: carlos.pena@usa.edu.co
How to cite: Peña, C.; García, K.; Martínez, H., Hybrid model of the spread of Toxoplasmosis between two Town of Colombia, TECCIENCIA, Vol. 7 No. 18., 1-6, 2015, DOI: http://dx.doi.org/10.18180/tecciencia.2015.18.1
Received: 20 Oct 2014 Accepted: 25 Feb 2015 Available Online: 20 April 2015
Abstract
In this work, it is presented the dynamics of infection of toxoplasmosis between two nearby communities. Diffusion via of oocysts is a drainage that crosses the study area located in the Caribbean Region of Colombia. The communities considered in the model are San Marcos and San Benito Abad, cities in the Department of Cesar; and the oocysts are transported by the San Jorge River. The model is built using System Dynamics (SD) and Geographic Information Systems (GIS), considering two populations: humans and cats. From these conditions, a model is created for each community. This allows us to study the dynamics of the epidemic occurring between two communities through a transfer mean. This instrument under construction is relevant in decision-making in health policies.
Keywords: Toxoplasma, Gondii, epidemiology, DS, GIS.
Resumen
Este trabajo presenta la dinámica de la infección de la toxoplasmosis entre dos comunidades cercanas. La vía de difusión de ooquistes es un drenaje que atraviesa el área de estudio localizada en la región caribe de Colombia. Las comunidades consideradas in el modelo son San Marcos y San Benito Abad, situadas en el departamento del cesar; y los ooquistes son trasportados por el rio San Jorge. El modelo de construcción usa un sistema dinámico (SD) y un sistema de información Geográfica (GIS), considerando dos poblaciones: humanos y gatos. Desde esas condicionas, un modelo es creado para cada comunidad. Esto nos permite estudiar las dinámicas de la epidemia que se produce entre dos comunidades a través de un medio de transferencia. Este instrumento bajo construcción es relevante en la toma de decisiones en políticas de salud.
Palabras Clave: Toxoplasma, Gondii, epidemología, DS, GIS.
1. Introduction
The Toxoplasmosis Gondii (T. Gondii) parasite goes through several states in its life cycle. One of these states is known as oocysts, present in the feces of a cat infected by the parasite. These oocysts can be carried by wind and transported by various means such as rivers and drains, traveling from one geographical location to another. Currently, the spread of epidemics caused by parasites is being heavily studied by several fields of science [1] [2] [3]. This work studies the propagation of epidemics between two locations using a hybrid model between System Dynamics (SD) and Geographic Information Systems (GIS), for that there are different levels of integration between GIS and (dynamic) models. In this study, it was used "The low level linkage", which is characterized by the use of conversion programs and procedures, and data exchange between models and GIS using files [4].
The methodology of SD provides information about system variables in the temporary domain. The strategy of linking methodologies for modeling, has been used to study epidemiological [5], hydrological (watersheds) and environmental models [6]. Similarly, it has been used in problems of demand for urban land in metropolitan areas [7], in participatory modeling of the impact of trees on the farm productivity and regional biodiversity on fragmented landscapes in Central America [8], and to reflect the spatial distribution of air contaminated by traffic and the change in emissions [9]. The interest of this study is the spread of Toxoplasmosis in Colombia. T. Gondii is a protozoan organism that affects humans under immuno suppression. As an example, consider the immuno compromised individuals such as AIDS patients [10] or those subject to organ transplant [11]. Furthermore, this parasite can eventually infect the fetus of pregnant women being this causal of high risk during the period of gestation [12]. Since the cat is a definitive host of Toxoplasma Gondii, then it has been considered an important transmission vector in humans. Therefore, this vector has been used in mathematical models to study epidemics caused by this parasite [13].
In a previous work [14], SD was used to the study of toxoplasmosis. Four subpopulations were considered: men, women, cats and rats, in order to model a swine farm. This simulation was carried to study the impact of vaccination against toxoplasmosis in cats. The results of simulation concluded that vaccination in cats is not a significant factor to reduce the prevalence of toxoplasmosis in human population. One of the main applications of epidemiology is to contribute in the identification of geographical areas and communities with higher risk of disease, so these vulnerable areas require more attention of health promotion policies [15]. The advantages of using GIS are to obtain the spatial location of the studied variable, organization, updating of data and its graph representation [16], the interaction between layers of spatial information and the application of simulation models. The PCR aster and Quantum GIS programs will be used throughout all the study.
Currently, there are free software and commercial programs that implement SD as Vensim SD [17], Stella [18], iThink. In turn, GIS can be implemented in programs such as gvsig [19] or sagagis [20]. Commercial programs incorporating GIS with SD are Simile [21], Powersim Studio8 [22], and among the free software programs, it is the PCR aster program developed by the University of Utrecht. The latter is free and can be downloaded at the site PCR aster Source forge [23]. The program PCR aster contains a SD module that can generate graphical output; these results are integrated and processed in the program GIS Quantum GIS [24]
2. Methodology
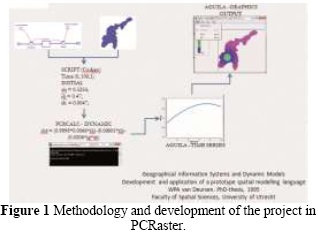
Initially the model is built for a community considering the interaction of two human populations and cats, the latter being important in the dynamics of toxoplasmosis. The structure and sequence of results generated with PCR aster is presented in Figure 1,this is due to a series of commands and instructions referred to in the script generating graphics that are displayed through the interface eagle, which is a module in PCR aster
2.1. Model
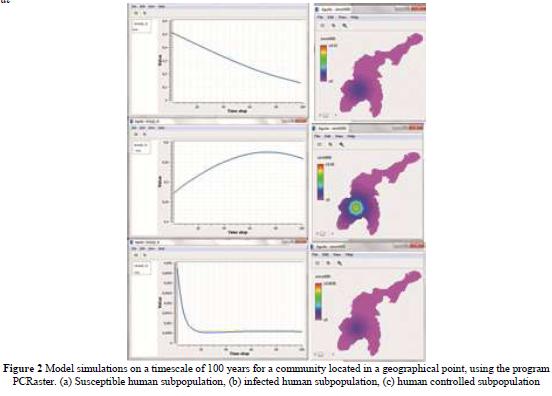
The model represents the spread of Toxoplasmosis in a community, for which a number of conditions are established taking into account particular characteristics of the area. As already mentioned, we considered two populations, the humans and the cat populations. To construct the levels data and flow diagram we rely on the causal diagram Figure 2 which was built by using previous works developed in [25] [26].
2.1.1 Hypothesis for a community
The human population is divided in three subpopulations:
- S(t) Susceptibles: Individuals of the population that could be infected with T. Gondii.
- I(t) Infected: Individuals of the infected population by T. Gondii.
- C(t) Contolled: Individuals of the infected population under treatment.
The parameters considered in the model are:
- βc, γ, µc: transmission rates
- d, dC: natural death rate
- µ: birth rate
- ε: death rate caused by T. Gondii
- p: probability of birth born without T. Gondii
- pc: probability that an infected cat give birth.
The cat population is given by:
The results of the model for a given area are presented Figure 2. It is important to note that for each step (time unit) a map is generated.
2.2. Model for two populations
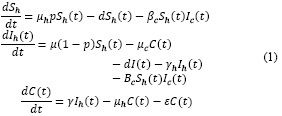
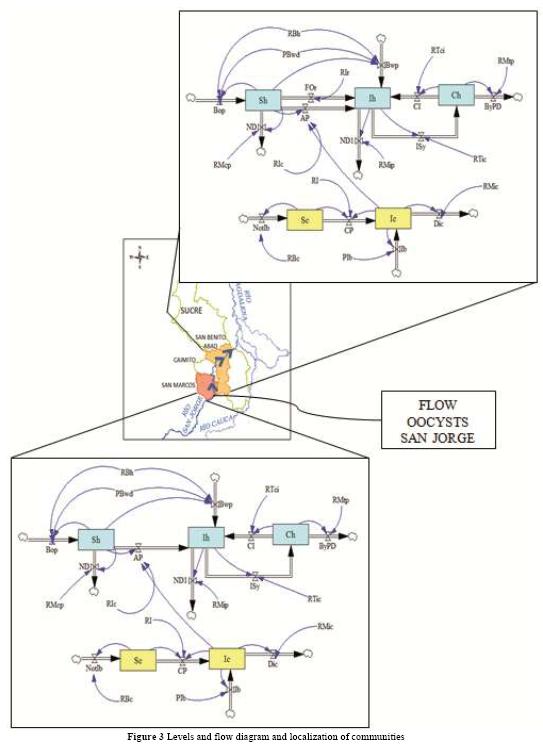
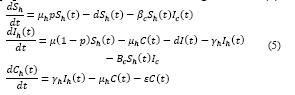
The general outline of the hybrid model is shown in Figure 3, where system dynamics can display the causal relationships of the spread of Toxoplasmosis Gondii in each community, and between two communities through a transmission channel, in this case, the San Jorge River which acts as a transport of oocysts produced by the infected cats from the town of San Marcos to the town of San Benito Abad. At this point, GIS was used, which allows involving spatial elements in the dynamic simulation of epidemiology between two communities. The following set of equations corresponds to the system of ordinary differential equations for the toxoplasmosis transmission system model between two communities [27]
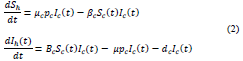
The system of equations for the human and cat population of San Benito Abad Town are given as in (2).
The cat population is given by:
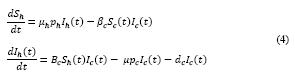
The system of equations for the human and cat population of San Marcos Town are given as in (2)
3. Results
For the simulation it was used the PCR aster program through a script that solves the system of differential equations. The simulation time taken was 40 days, the initial spread (t = 0) is given in San Marcos. The propagation in San Benito Abad occurs until day 30 (t = 30). The initial conditions of the system and the parameter values are:
- According to a study by the National Institute of Health, an overall prevalence of 47% was reported in Colombia, in 1982 [25]
- The population of infected cats in Colombia is of 47.7% and the birth rate of 6.6% [25] [26].
- For every 1000 births in Colombia is estimated that between 2 and 10 have the parasite [25].
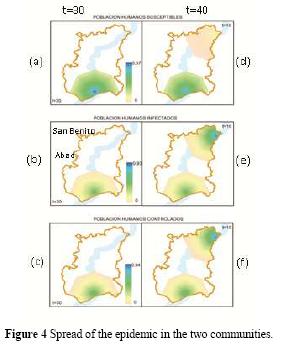
The value of the parameters are ph = 0.9898, µc 0.0066, ε = 0.00000508, βc = 0.0206, γ = 0.000232, d = 0.00601, pc = 0.3, βps = 0.54, µ = 0.2, dc = 0.0001. The simulation results for days 30 and 40 are presented in figure 4. The disease occurs initially in the town of San Marcos. After that, the San Jorge River carries the oocysts to the town of San Benito Abad. It is assumed that cats can be infected through consumption of river water and then spread the disease in the community of San Benito Abad. In the Figure 4, using PCR aster and Quantum Gis: (a) susceptible human subpopulation t = 30, (b) infected human subpopulation t = 30, (c) controlled human subpopulation t = 30, (d) susceptible human subpopulation t = 40, (e) infected human subpopulation t = 40, (f) controlled human subpopulation t = 40 Images 4(a), 4(b), 4(c) show the spread of the epidemic until day 30 in the territory of San Marcos. On the other hand, and while increasing the spread in San Marcos, oocysts are transported by The San Jorge River to the community of San Benito Abad. In 10 days, its inhabitants go from being a potential population to acquire the disease (d), to an infected population (e). In turn, other inhabitants are already being treated (f).
The results presented in Table 1 show an increase of the infected subpopulation in the community of San Marcos during the first 30 days, assuming the existence of a susceptible subpopulation to be infected (day 0 = 0.5253) that decreases over time. In addition, the subpopulation of controlled humans shows a slight decrease during the first 40 days.
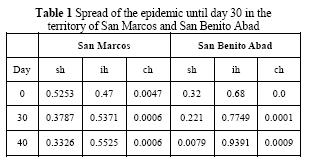
On the other hand, in the community of San Benito Abad, a decrease in susceptible population is generated. Nevertheless, the infected and controlled populations increase, which shows the possible immediate attention to those who acquired the disease. The controlled subpopulation in the community of San Marcos presents no relevant decrease during the last 10 days. This demonstrates that the disease is still present, which will generate a cycle of infection if not stopped in time.
4. Conclusions
According to the model results, the focus of the disease in its initial state is essential, during and after diagnosis and treatment. The disease continues appearing in the city of San Marcos, even after transported to another community, demonstrating that these diseases should be treated through cooperative mechanisms between communities. Attention should not only be given to those affected; but also strategies should continuously be implemented to reduce the potential for others from catching the disease. In addition to these measures of attention to the people, it is important to provide a fairly healthy environment which is free of possible modes of transmission and transportation of the disease. In this case, it can be implemented mechanisms that make the community aware about water consumption and direct attention to the subpopulation of cats.
The implementation of the hybrid model of toxoplasmosis, with methodologies SD-GIS, focused on the display of an epidemic over time and their behavior in geographical and environmental conditions. In this case, a river was a mean of propagation between the two communities. This allows taking steps in the direction of building a tool to perform risk assessments to communities, in order to strengthen prevention with changes in risk management policies for a region through government, national or local agencies.
References
[1] K. Clarke, S. L. McLafferty y B. J. Templski, «On epidemiology and geographic information systems: a review and discussion of future directions.,» Emerg Infect Dis, Publemed vol. 2, n° 2, pp. 85-92, 1996. [ Links ]
[2] T. B. Richards, C. M. Croner, G. Rushton, C. K. Brown y L. Flower, «Geographic Information Systemns and public Health: mapping the future.,» Public Health Rep., vol. 114, n° 4, pp. 59-60, 1999. [ Links ]
[3] J. Donado, F. Morilla y F. Martínez, «Dynamic model for prediction of the epidemic wave of flu A/H1/N1. Why we have made a mistake?,» de European Scientific Conference on Applied Infectious Disease Epidemiology (ESCAIDE)., Lisboa, 2010. [ Links ]
[4] W. van Deursen, «Geographical Information Systems and Dynamic Models,» University of utrecht, Faculty of spatial Sciences, Rotterdam, 2000. [ Links ]
[5] C. L. Castro, «Modelación y simulación computacional usando sistemas de información geográfica con dinámica de sistemas aplicados a fenómenos epidemiólogicos,» Revista facultad de ingenieria Universidad de Antioquia, n° 34, pp. 86-100, 2005. [ Links ]
[6] C. Aragón, L. Malczynki, E. Vivoni, V. Tidwell y G. S., «Modeling ungauged tribitaries usin geographical information system (GIS) and system dynamics.,» de Esri International User Conference Proceedings, San Diego California, 2006. [ Links ]
[7] F. Aguilera, W. Plata, J. Bosque y M. Gómez, «Diseño y simulación de escenarios de demanda de suelo urbano en ambitos metropolitanos.,» Revista internacional de sostenibilidad, tecnología y humanismo, n° 4, pp. 57-80, 2009. [ Links ]
[8] L. Gormley, «Modelaje participativo de impacto de los árboles en la productividad de las fincas y la biodiversidad regional en paisajes fragmentados en América Central.,» Agroforesteía de las Américas, vol. 10, n° 39, pp. 103-108, 2003. [ Links ]
[9] L. Chen y W. Lang, «Application Of System Dynamics With GIS For Assessing Traffic Emission Management Policy. Air Pollution IX.,» 2001. [En línea]. Available: http://www.witpress.com/elibrary/wit-transactions-on-ecology-and-the-environment/47/3625. [ Links ]
[10] D. Howe, S. Honoré, F. Deronin y L. Sibley, «Determination of genotypes of toxoplasma godii strains isolated from patients with toxoplasmosis.,» Clinical Microbial, vol. 35, n° 1, pp. 1411-1414, 1997. [ Links ]
[11] J. Dubey, D. Lindsay y C. Speer, «Structures of Toxoplasma Gondii Tachyzoites, Bradyzoites, and Sporozoites and Biology and Development of Tissue Cysts,» Clinical Microbilogy Reviews, vol. 11, n° 2, pp. 267-299, 1998. [ Links ]
[12] C. Gallego, C. Saavedra y J. Gómez, «Direct genotyping of animal and human isolates of Toxoplasma Gondii from Colombia (South America),» Acta Tropica, vol. 97, n° 2, pp. 161-167, 2006. [ Links ]
[13] A. Arenas, G. González y R. Villanueva, «Modeling toxoplasmosis spread in cat populations under vaccination,» Theoretical Pouplation Biology, vol. 77, n° 4, pp. 227-237, 2010. [ Links ]
[14] B. Hannon y R. Matthias, Dynamic Modeling of Diseases and Pests, Springer, 2009. [ Links ]
[15] Organización panamericana de la salud., «Uso de sistemas de información geográfica en apidemología. (SIG-Epi),» March 1996. [En línea]. Available: http://www1.paho.org/Spanish/sha/epibul_95-98/bs961sig.htm. [ Links ]
[16] S. Gharib, «Synthesizing System Dynamics and Geographic information systems in a new method to model and simulate environmental systems,» 12 December 2008. [En línea]. Available: https://bora.uib.no/handle/1956/3296. [ Links ]
[17] «Vensim,» Ventana systems. inc., [En línea]. Available: http://www.vensim.com. [ Links ]
[18] «Stella Professional,» Isee systems, [En línea]. Available: http://www.iseesystems.com/. [ Links ]
[19] «gvSIG Association,» gvSIG Association, [En línea]. Available: http://www.gvsig.com/en. [ Links ]
[20] «SAGA for automated geocientifici anaylses,» SourceForge, [En línea]. Available: http://www.saga-gis.org/en/index.html. [ Links ]
[21] Simulistics Ltd., «Simulistics,» Simulistics Ltd, 2011. [En línea]. Available: http://www.simulistics.com/. [ Links ]
[22] «PowerSim Software,» Powersim software AS., 2015. [En línea]. Available http://www.powersim.com/. [ Links ]
[23] «PCR aster,» Pcraster, [En línea]. Available: http://pcraster.geo.uu.nl/. [ Links ]
[24] «QGIS. A free and open source geographic information System,» Q 2.8.1., 2015. [En línea] [ Links ].
[25] D. Aranda, R. Villanueva, A. Arenas y G. González, «Mathematical modeling of Toxoplasmosis disease in varying size populations,» Computers & Mathematics with applications, vol. 56, n° 3, pp. 690-696, 2008. [ Links ]
[26] G. González, A. Arenas, D. Aranda, R. Villanueva y L. Jódar, «Dynamics of a model of Toxoplasmosis disease in human and cat populations,» Computers & Mathematics with applications, vol. 57, n° 10, pp. 1692-1700, 2009. [ Links ]
[27] C. Peia y G. Juez, «Representación Sistémica de la transmisión de toxoplasma Gondii en Colombia.,» de IX Congreso latinoamericano de dinámica de sistemas y II Congreso Brasileno de dinamica de sistemas, Brasilia, 2011. [ Links ]
