


Services on Demand
Journal
Article
 English (pdf)
 Article in xml format
 Article references
 Send this article by e-mail
Indicators
-
 Cited by SciELO
 -
 Access statistics
Related links
-
 Cited by Google
 -
 Similars in
SciELO
Similars in
SciELO -
 Similars in Google
Share

 Permalink
Tecciencia
Print version ISSN 1909-3667
Tecciencia vol.10 no.18 Bogotá Jan./June 2015
https://doi.org/10.18180/tecciencia.2015.18.5
DOI: http://dx.doi.org/10.18180/tecciencia.2015.18.5
Technical Efficiency Measurement of the Teaching Function in the Undergraduate Attendance Programs at Universidad Militar Nueva Granada
Medición de la eficiencia técnica de la función docente en los programas presenciales de pregrado de la Universidad Militar Nueva Granada
Oscar Yecid Buitrago Suescún1, Anny Astrid Espitia Cubillos2, Daniela Linares Cardenas3
1 Universidad Militar Nueva Granada, Bogotá, Colombia, oscar.buitrago@unimilitar.edu.co
2 Universidad Militar Nueva Granada, Bogotá, Colombia, anny.espitia@unimilitar.edu.co
3 Universidad Militar Nueva Granada, Bogotá, Colombia, u2901943@unimilitar.edu.co
* Corresponding Author. E-mail: Oscar.b uitraao@unimilitar.edu.co Tel: + 57 1 650 0000 Ext 1283
How to cite: Buitrago, O.; Espitia, A.; Linares, D.r Technical Efficiency Measurement of the Teaching Function in the Undergraduate Attendance Programs at Universidad Militar Nueva Granada, TECCIENCIA, Vol. 7 No. 18., 25-35, 2015, DOI: http://dx.doi.org/10.18180/tecciencia.2015.18.5
Received: 26 Feb 2015 Accepted: 05 May 2015 Available Online: 22 May 2015
Abstract
Public higher education institutions in Colombia have limited resources (and often insufficient), so it is crucial to use them adequately to fully achieve their mission objectives. This paper presents a measurement and analysis of the technical efficiency of teaching, a core mission of the undergraduate attendance programs at Universidad Nueva Granada. The method used is data envelopment analysis, as it provides relative efficiency scores of the units under study and it also gives additional information of the reference peers. This allows formulating improvement plans for the university management. Two study scenarios were defined: the first includes inputs and desirable outputs and the second takes into account undesirable outputs. Performance was analyzed for six consecutive semesters from the year 2011 and the corresponding Malmquist indices were calculated. The results are encouraging since they indicate that 30.76% of the programs are 100% efficient in all periods regardless of the scenario in which they were measured.
Keywords: Data envelopment analysis, Higher Education, Relative efficiency, Malmquist index, Undesirable outputs.
Resumen
Las instituciones de educación superior de caracter estatal en Colombia cuentan con recursos limitados (y muchas veces insuficientes), por lo tanto es perentoria hacer una adecuada utilización de ellos para lograr el cumplimiento de sus objetivos misionales. En este artículo se presenta una medición y análisis de la eficiencia técnica de la enseñanza, una misión funcional de los programas de pregrado presencial de la Universidad Militar Nueva Granada. El método utilizado se basa en el Análisis Envolvente de Datos, puesto que permite calcular índices de eficiencia relativa de las unidades objeto de estudio y además suministra información adicional para la obtención de pares de referencia. Esto permite formular planes de mejoramiento en la gestión universitaria. Se definieron dos escenarios de estudio, uno considerando entradas y salidas deseadas y otro involucrando adicionalmente una salida indeseada. Se analizó el desempeño durante seis semestres consecutivos a partir del alo 2011 y se calcularon los correspondientes índices de Malmquist. Los resultados obtenidos son alentadores puesto que indican que el 30.76% de los programas resultaron 100% eficientes durante todos los periodos analizados independientemente del escenario en que fueron medidos.
Palabras clave: Análisis Envolvente indeseadas de Datos, Educación Superior, Eficiencia relativa, Índice de Malmquist, Salidas.
1. Introduction
Improvement of processes and the rational use of resources is currently a hot topic in organizations. Within this context, productivity is defined as an indicator that reflects how efficient an organization is in the use of its inputs to produce goods and services. For this reason, entities are aware that it is a key element in contributing to increased competitiveness. Institutions of higher education (IHEs) are not outside this panorama and due to this adequate management seeks to follow up and provide support to human talent and permanently improve the use of the physical and financial resources they have to guarantee their offer of the educational service under conditions of quality, opportunity, and efficiency according to the orientations by the Colombian National Ministry of Education and society in general.
In these types of institutions, it is of interest to measure the efficiency with which tangible inputs are used in compliance of the teaching function and by being immersed within a complex phenomenon involving human peculiarities, the search continues for methods that permit approaching said measurement. On the other hand, economic conditions have led educational administrations, in general, to take into account the evaluation and control of funding, especially of public institutions, and in particular, of universities to have an optimal and rational management of their tangible resources.
Also, data envelopment analysis (DEA) is a nonparametric technique based on linear programming and permits 26 ] measuring the relative technical efficiency of units evaluated, identifying those 100% efficient that together form what is known as Pareto efficient frontier. Inefficient units are compared to points located in the frontier to find where they should be placed; said position may be expressed as a convex linear combination of the efficient units.
In Colombia, in the last decade, the use of DEA has increased to measure relative technical efficiency in educational institutions. According to Cervera, Oviedo, and Pineda [1], 12 documents exist (among articles, textbooks, and graduate and undergraduate degree works) from six universities that have applied DEA in IHE. In the specific case of Universidad Militar Nueva Granada (UMNG) the method has not been used; hence, the aim of this work was to use DEA to measure the relative technical efficiency of its professional undergraduate attendance programs in compliance of the teaching mission function. Given that the operation of a university is dynamic, in addition to the calculation of the efficiency index for six consecutive semesters, change in productivity is determined through the Malmquist index and how it is decomposed into changes in efficiency and technological changes.
1.1. Data Envelopment Analysis (DEA)
Data envelopment analysis (DEA) is a method based on linear programming and permits calculating an index of relative technical efficiency, initially introduced by Charnes, Cooper, and Rhodes [2] (model denominated CCR used assuming constant returns to scale), who concentrated on the outputs and analyzed - at that time - the efficiency in various public education centers of the United States. Later, Banker, Charnes, and Cooper [3] developed the BCC model that incorporates onto the CCR model slack variables and excess inputs and outputs and a convexity restriction for the case of variable scale returns.
According to Maza, Navarro, and Puello [4], the following are among the main advantages of DEA:
- The results are circumscribed only to the data analyzed and inferences cannot be made with respect to the universe of data.
- The data determine what is the function and does not try to estimate a function. In this sense, it is not necessary to establish an initial functional form.
- Permits diverse generalizations.
- Is much more flexible than econometric methods.
- Relaxes the convexity assumption of the sets of production possibilities.
- Due to their general nature and flexibility, it may incorporate errors of measurement and of uncontrolled variables.
The CCR model is formalized assuming the existence of n decision making units (DMU) to be evaluated, each of which produces s outputs yr from m inputs xi. To measure the efficiency of the DMUo, the model must be solved (1):
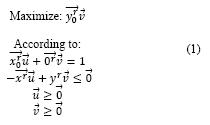
For the n DMU x is the input matrix and y is the output matrix, while the components of vector  and of vector
  are the weight associated to each of the inputs and outputs, respectively. The dual formulation of the model (1) is also used to measure efficiency, given that it permits defining comparison pairs for the inefficient DMUs.
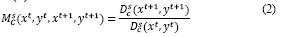
1. 2. Malmquist productivity index
It is commonly used to measure productivity change; it was introduced by Malmquist [5] and within the DEA context by Caves, Christensen, and Diewert [6]. Given a set t =1,. . ., T of time periods, a set of n DMU that transform m inputs Xij (i = 1,...,m) into s outputs yrj (r = 1,...,s), two technologies may be defined (Pastor, [7]):
- Current reference

- Global reference technology

Sub-index c indicates that both technologies have constant returns to scale.
The Malmquist index is defined on the technology TC S as expressed in (2):
Where  = min
= min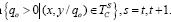
If no restrictions exist in both technologies and it is fulfilled that  , then the Malmquist index can be presented as (3):
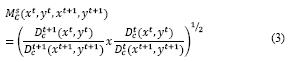
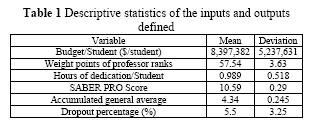
Where  is the technical efficiency for the DMU evaluated, calculated with the data from the t period for all DMUs, even that evaluated.
  is the technical efficiency for the DMU evaluated, calculated with the data from the t period+1 for all DMUs (including that evaluated),
  is the technical efficiency for the DMU evaluated, calculated with the data from the t period+1 for all DMUs minus that evaluated for which data from the t period are used and
  is the technical efficiency for the DMU evaluated, calculated with the data from the t period for all DMUs minus that evaluated for which data from the t period+1 are used.
Upon increased productivity, the value of the index is higher than one; if it diminishes, it is lower than one; and if la productivity is maintained, it is equal to one. The break down presented by Färe et al [8]. Permits determining the effects of changes in technology and of the variation of the value of the technical efficiency, as shown in equation (4).
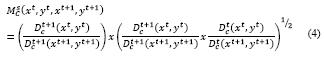
Factor  measures the change of technical efficiency of the DMU analyzed during two consecutive periods (greater than 1 indicates increased productivity and lees than 1 decreased). The term
 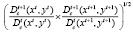 specifies how technology changed during both periods considered (values higher than 1 show technological progress and values below 1 manifest technological stagnation or retrogression).
1.3. Application of DEA in public universities
Abbott and Doucouliagosa [9], who analyzed Australian state universities at the teaching level by using the BCC model aimed at inputs, along with cluster analysis, concluded that the technical efficiency level of the universities considered is high. For their part, Kaoa and Hungb [10] evaluated the three educational fronts (teaching, research, and outreach) of the faculties at the Cheng Kung National University with the CCR and BCC models with their prior classification through break down of efficiency and cluster analysis. Erasmus and Msigwa [11] analyzed the teaching function of several Chinese state-run universities by using the BCC model aimed at inputs in three scenarios.
Agasisti and Perez [12] studied productivity in Italian and Spanish public university institutions evaluating teaching and research, comparing the CCR and BCC models aimed at outputs and concluding that the Italian universities are more efficient than the Spanish universities.
The efficiency of the state-run universities in Spain, using DEA, is evaluated by Murias et al. [13], Garcia and Palomares [14], Gómez [15], and Fernandez et al. [16]; the first apply the CCR model aimed at outputs and determine the results are better for the universities located in wealthier areas; the second evaluate teaching and research results through CCR and BCC models aimed at outputs and calculate the Malmquist productivity indices; the third highlights the potentiality of DEA for these types of measurements in the public sector, uses the method with CCR constant scale yields along with BCC variable yields and concludes that the number of efficient universities is higher in the models with variable yield than in those of constant yield; the last, through BCC and CCR models aimed at outputs study the mission teaching and research functions after implanting the LOU. Cunha and Rocha [17] do the same in Portugal by contrasting the results of the public universities by evaluating teaching through CCR and BCC models aimed at inputs and conclude that few are efficient.
In Colombia, Rodriguez [18] evaluates outreach activities in the units at Universidad Nacional by applying the CCR model aimed at outputs, concluding that the comparison among departments is not valid given the diversity of disciplines with significant differences related to the needs for investment. Also, Garcia and González [19] measure the efficiency of Colombian public universities by using DEA, applying the CCR model aimed at outputs, and a complementary cluster analysis to analyze performance at the research and teaching levels during the period from 2003 to 2009.
Soto, Arenas, and Trejos [20] compare the results obtained by the model of the State-run University System (SUE, for the term in Spanish) based on the technique of multivariate analysis of principal components combined with linear regression (Farrell, [21]) and DEA, models used to measure performance in research and formation in Colombian public universities; given the inconsistencies found with the application of the SUE model, they conclude that DEA is more suited to evaluate the efficiency of universities with respect to the production factor, given that the SUE model (Roll, Cook, and Golany [22]) does not specifically measure efficiency, but rather calculates a regression line where the degree of excellence or inferiority of the universities is measured by the magnitude of the deviation with respect to the central trend line, while DEA measures the best performance, evaluates the performance of each university, and permits designing improvement strategies to become efficient. Likewise, Visbal and Palacios [23] evaluate IHEs that are part of the SUE through BCC and CCR models aimed at inputs, complemented with Logistic Regression Analysis; upon determining the scale efficiency they find that 80% of the 20 universities are inefficient globally. Soto et al. [24] use CCR and BCC models aimed at outputs to evaluate undergraduate programs at Universidad Tecnológica de Pereira, considering the mission teaching and research functions e investigation, as well as the SUE that does not include outreach activities.
For UMNG, no reports were found on the application of DEA to measure the relative technical efficiency of the undergraduate attendance programs in compliance of the mission teaching function. Given that the operation of a university is dynamic, in addition to calculating efficiency during six consecutive semesters, this work seeks to determine the change in productivity through the Malmquist index and its corresponding break down in changes of efficiency.
2. Methodology
2.1. Definition of DMUs
In defining the DMUs, you must start from the fact that Universidad Militar Nueva Granada has seven faculties that offer 73 graduate programs and 16 undergraduate programs. The undergraduate programs offered are 13 at the university professional level (Applied Biology, Business Administration, Public Accounting, Economy, Law, Civil Engineering, Industrial Engineering, Mechatronics Engineering, Multimedia Engineering, Telecommunications Engineering, Medicine, International Relations and Political Studies, Administration of Safety and Occupational Health), and three at the technological level.
To evaluate the efficiency of the mission teaching function at UMNG, the study considered the 13 university professional attendance programs at the University, defining each of them as a DMU. Data were collected discriminated by semester for the periods comprised between 2011-I and 2013-II in each of the directions of the program and the academic vice rectory.
2.2. Inputs and outputs considered
To identify and measure the inputs, this study examined those resources used by each functional unit to carry out teaching activity. This considered the budget for student assigned by each program, the number of hours each professor of the program has signed to teaching activities, y el and the average rank of the professors of the program. Regarding this last input, the study kept in mind the number of full-time professors the program has available from each of the categories within the professor ranks (aide, assistant, associate, full) and the points were weighed based on Article 8 of Decree 1279 of June 19, 2002 [25], which establishes the wage and benefits routine for State-run university professors.
Regarding the outputs, these were defined as the average score of each program in the State exam administered by ICFES to students in their last semesters (SABER-PRO), the accumulated general average of the students during their undergraduate, and as undesired output the dropout percentage was computed.
Table 1 shows the descriptive statistics for the inputs and outputs considered, calculated with all the DMUs and periods studied.
2.3. DEA scenarios and models implemented
To measure the efficiency of the undergraduate attendance programs at UMNG two scenarios were considered:
- One that considered that with the inputs defined we may obtain as outputs the scores measured internally (accumulated general average) and that measured by an external entity (SABER-PRO).
- Another one that keeps in mind the presence of undesirable outputs in compliance with the teaching function. This scenario considered as undesired output the dropout index of each of the programs.
The models implemented parking that outputs, given that what is sought is to indicate to each program how to improve their outputs with the level of inputs they currently have.
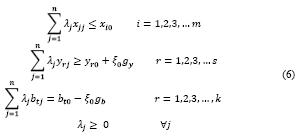
For scenario 1, the corresponding model is the CCR (Equation 5) (with constant returns to scale given that the programs not compete for budget). This model was solved for 2011, 2012, and 2013, bearing in mind the two semesters per year.
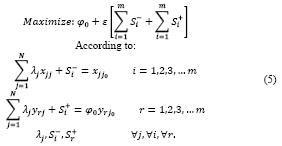
For the DMU jo, which with m inputs xij (i =1,...,m) produces s outputs yrj (r=1,...,s), St-, St+ are the slack variables (or excess) of the inputs and outputs and ε is a non- Archimedean infinitesimal number. φ0* is the optimal value of efficiency, and λk* represents the factor in which the DMUk is reference peer for the DMUo evaluated.
The model given by equation (5) must be solved once for every DMU in each of the time periods on the planning horizon. In the case studied, scenario 1 has three restrictions of the type:  (one for each input) and two of the type:
  (one for each desired output).
Scenario 2 considers the presence of the dropout rate as an output (undesired); because of this it is necessary to recur to the concept of distance directional function (DDF)

Proposed by Chung, Fare, and Grosskopf [26] and which permits incorporating inputs and undesirable outputs. With this approach, efficiency is measured in the direction indicated by a directional vector  that is defined in flexible manner. This factor seeks the maximum expansion of the desired outputs in the gy direction and the maximum contraction of the undesirable outputs in gb. The DDF model to measure the relative efficiency of a DMUo is:
Max ξ;0
Subject to:
In the model (6) the terms by correspond to the undesirable outputs.
In this situation, we have three restrictions of class  (one for each desired input), two of the type
 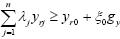 (one for each desired output), and one of the type
 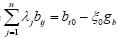 for the dropout percentage undesired output. For each time period analyzed the corresponding model (Equation 6) is run for each DMU.
3. Results and discussion
Herein, we present the results obtained upon applying data envelopment analysis to the totality of the university professional undergraduate attendance programs of the seven faculties at Universidad Militar Nueva Granada, evaluated during the period 2011-I to 2013-II. The models implemented were run on MaxDea software to obtain efficiency indices, the Malmquist index and its break down.
3.1. Efficiency indices
Table 2 to
Table 4 show the results obtained (in parentheses those of scenario 2) upon solving DEA models (5) and (6) with the inputs and outputs presented
Table 1. Regarding the relative technical efficiency of the undergraduate attendance programs at UMNG, it is notable that Public Accounting, Law, and Industrial Engineering results deficient in all the periods independent of the scenario analyzed, as noted in Table 2. The programs of Business Administration, Economy, and Multimedia Engineering also have outstanding efficiency.
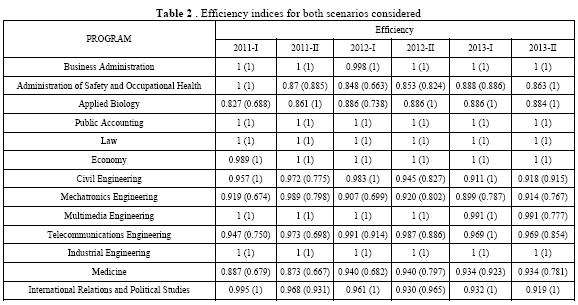
Considering scenario 1, the mean efficiency of all the programs during the six semesters analyzed is 95.9% with Applied Biology being the lowest (87%), Figure 1, followed by Administration of safety and occupational health (88.7%); these two being the only ones not exceeding 90%. Upon considering the presence of the dropout rate as undesired output (scenario 2), from Table 2 and Figure 1 it may be extracted that the mean efficiency of the programs drops to 92.34%, with the programs of Public Accounting, Law, and Industrial Engineering remaining as efficient at 100%, but now Business Administration and Economy are added to this group. The programs most favored upon incorporating the undesired output are International Relations and Political Studies and Applied Biology, probably because they treat adequately the student dropout phenomenon.
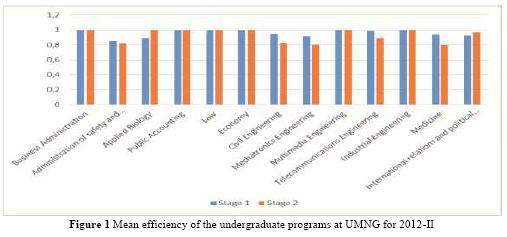
Conversely, the mechatronics and telecommunications engineering programs dropped their efficiency notably when measured bearing in mind the dropout rate, as evidenced in Table 2 and Figure 1.
3.2. Productivity changes
Regarding the Malmquist index, considering that values greater than one indicate increased productivity, less than one a decrease, and the unit with no change, analysis of the data reported in Table 3 evidences that on average and during the periods analyzed there is no change in productivity, given that for scenario 1 the value of the index is of 0.997 and for scenario 2 it is 1.015.
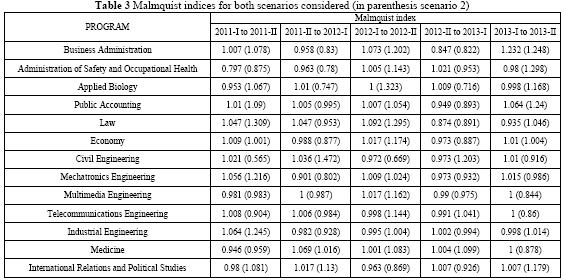
Figure 2 seems to show that the programs of Public Accounting, Law, Industrial Engineering, and International Relations and Political Studies have increased productivity under scenario 2. Nevertheless, the means over the values from Table 3 for those programs show that the Malmquist indices obtained are 1.04; 1.098; 1.036, and 1.037, respectively, all close to the unit.
A specific analysis of the data from Table 3 shows that during the periods 2011-I to 2011 and 2012-I to 2012-II the Law program under scenario 2 increased its productivity, as it also occurred with Civil Engineering 2011 -II to 2012-I and Industrial Engineering 2011-I to 2011-II. With scenario 1, no program had a notable increase of productivity. On the contrary, during the period 2011-I to 2011 -II Administration of Safety and Occupational Health, Law in 2012-II to 2013-I, and Business Administration in 2012-II to 2013-I had.
Scenario 2 is the most demanding regarding productivity changes; in 2012-II to 2013-I Applied Biology, Public Accounting in 2012-II to 2013-I, Law in 2012-II to 2013-I, Economy in 2011-II to 2012-I and 2012-II to 2013-I, Civil Engineering in 2011-I to 2011-II and 2012-I to 2012-II, Mechatronics Engineering in 2011-II to 2012-I, Multimedia Engineering in 2013-I to 2013-II, Telecommunications Engineering in 2013-I to 2013-II, and Medicine in 2013-I to 2013 -II had notable decreases in productivity, which may be explained with the results from.
Table 4. It is highlighted that during the last two periods considered there are no notable changes in productivity.
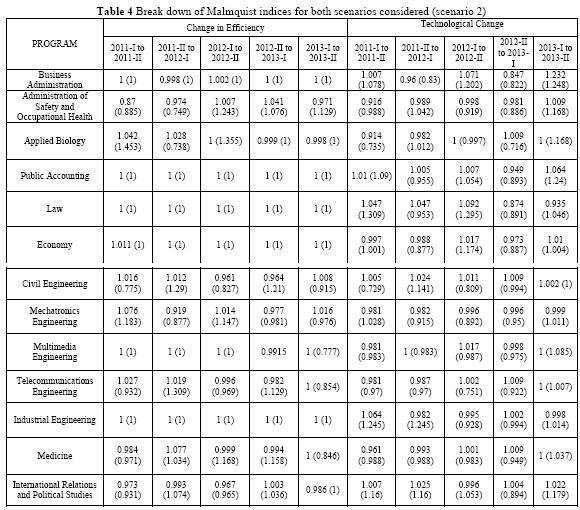
Through
Table 4, the indices reported in Table 3 may be interpreted. On average efficiency and technology changes have values of 0.998 and 0.999 in scenario 1 and 1.01 and 1.00 for scenario 2. This corroborates the appreciation that on average there are no productivity changes (measured through the Malmquist index) in the programs evaluated during the periods 2011-I to 2013-II.
The results shown in
Table 4 explained the specific behaviors of the productivity changes for each program during specific periods. For example, between periods 2013-I to 2013-II the program of Multimedia Engineering measured under scenario 2 diminished its productivity (Malmquist index = 0.844, (Table 3) and this change is broken down in decreased deficiency (0.777).
Table 4) and in a slight technological progress (1.085, Table 4).
3.3. Referents for each target program and values
With data envelopment analysis we can identify with respect to what program can we compare those the result inefficient and determine which is the value of the outputs that can be required from each of them. Table 5 presents the pertinent results from scenario 1 for the last period analyzed.
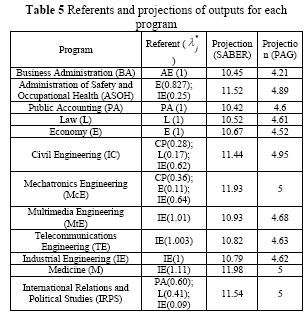
From Table 5, it may be noted that the programs of Business Administration, Public Accounting, Law, Economy, and Industrial Engineering, by being 100% efficient, are kept as reference peers for themselves and increased value of the outputs is not required of them. The Industrial Engineering program is a referent for all the programs evaluated with efficiency below 100% (the value in parentheses is the factor of importance program has as reference peer for that which is not efficient). For its part, Economy is a reference peer for Administration of Safety and Occupational Health and Mechatronics Engineering, while Law is for International Relations and Political Studies, and Public Accounting is a referent for Mechatronics Engineering, Civil Engineering, and International Relations.
With the information from the second column on Table 2 we may design the collaboration schemes among different academic programs, choosing the most academically related referents or those with the highest value of 1. The last two columns from the same table indicate how much can be required in the improvement plans from each program. Of course, the academic setting has its peculiarities and these must be kept in mind during the analysis, for example, nothing can required of a program with an accumulated average of five (measured over five), these types of results must be understood as that with the currently available resources the academic performance may be increased. These types of considerations must be made with all the inputs and outputs involved during the analysis.
In the educational setting, interpretations of results of DEA-type models (or others like stochastic frontier) must be done without losing sight of the complexity of the system. A specific aspect is the fact that the efficiency indices obtained are comparative among the DMUs involved and, hence, do not permit identifying structural problems. This means that even by having efficient DMUs, it may be that the amount of resources assigned is not adequate and for optimal operation additional budget may be necessary. It is also important to highlight the fact that the intangibles of the pedagogic process are not being considered.
4. Conclusions
This study used DEA, CCR, and DDF models (under constant return) to measure the relative technical efficiency of 13 undergraduate attendance programs at Universidad Militar Nueva Granada during six consecutive semesters from 2011-I to 2013-II. The CCR model (scenario 1) considered three desired inputs and two desired outputs for the measurement, while in the DDF model an undesired output was incorporated (scenario 2). With the efficiency indices obtained, productivity changes were also calculated through the Malmquist index.
The results show that the mean relative efficiency of the programs evaluated during the periods considered in 95.9% (with standard deviation of 0.0497) under scenario 1 and 92.34% (with standard deviation of 0.114) scenario 2.
Although in both cases the level of efficiency is high, it is evident that scenario 2 is the most demanding because it incorporates to the teaching mission the management of the student dropout rate.
The results are robust in the sense that the programs that are 100% efficient during the six semesters are the same independent of the scenario: Public Accounting, Law, and Industrial Engineering (the three belonging to different faculties). Besides, the mean of the Malmquist indices evidences that productivity during the time analyzed has remained constant.
Data envelopment analysis not only provides results to measure an efficiency index, but also permits tracking and breaking down productivity changes, establishing objective values to carry out improvement plans and design referencing schemes; all these aspects are useful in university administration bearing in mind that education is a complex phenomenon with huge social impact. Hence, DEA is a tool that can contribute to improving the management of tangible resources in IHEs, but whose results must be interpreted respecting the characteristics of each context in particular.
Acknowledgments
This work is a product derived from project INV-ING-1542, funded by the Vice-Rectory of Research at UMNG - in effect for 2014.
References
[1] A. Cervera y W. Oviedo Garcia, «Revisión bibliográfica de la aplicación de la metodología DEA en el ámbito educativo colombiano,» Civilizar Ciencias Sociales y Humanas, vol. 13, n° 25, 2013. [ Links ]
[2] A. Charnes y W. Cooper, «Auditing and Accounting for Program Efficiency and Management Efficiency in Not-for-Profit Entities,» Accounting, Organizations and Society, vol. 5, n° 1, pp. 87-107, 1980. [ Links ]
[3] R. D. Banker, A. Charnes y W. Cooper, «Some Models for Estimating Technical and Scale Inefficiencies in Data Envelopment Analysis,» Management Science, vol. 30, n° 9, pp. 1078-1092, 1984. [ Links ]
[4] F. J. Maza Avila, J. L. Navarro España y J. G. Puello Payares, «Fue eficiente la asignación de recursos en el suministro de agua potable en el departamento de Bolivar- Colombia en el período 2007-2008?,» Entramado, vol. 8, n° 1, pp. 58-70, 2012. [ Links ]
[5] S. Malmquist, «Index numbers and indifference surfaces,» Trabajos de estadística, vol. 4, n° 2, pp. 209-242, 1953. [ Links ]
[6] D. Caves, L. Christensen y E. Diewer, «Multilateral Comparisons of Output, Input, and Productivity Using Superlative Index Numbers,» The economic Journal, vol. 92, n° 365, pp. 73-86, 1982. [ Links ]
[7] J. T. Pastor y C. A. Knox Lovell, «A global Malmquist productivity index,» Economics Letters, vol. 88, n° 2, pp. 266-271, 2005. [ Links ]
[8] R. Fare, S. Grosskopf, B. Lindgren y P. Roos, «Productivity changes in Swedish pharamacies 1980-1989: A non-parametric Malmquist approach,» Journal of Productivity Analysis, vol. 3, n° 2, pp. 85-101, 1992. [ Links ]
[9] M. Abbott y C. Doucoliagos, «The efficiency of Australian universities: a data envelopment analysis,» Economics of Education Review, vol. 22, n° 1, pp. 89-97, 2003. [ Links ]
[10] C. Kao y H.-T. Hung, «Efficiency analysis of university departments: An empirical study,» Omega, vol. 36, n° 4, pp. 653-664, 2008. [ Links ]
[11] F. K. Erasmush y R. Msigwa, «Efficiency of Higher Learning Institutions: Evidences from Public Universities in Tanzania,» Journal of Education and practice, vol. 4, n° 7, 2013. [ Links ]
[12] T. Agasisti y C. Perez- Esparrells, «Comparing Effiency in a crosscountry perspective: the case of italian and spanish state universities,» Higher Education, vol. 59, n° 1, pp. 85-103, 2010. [ Links ]
[13] P. Murias, J. M. Rodriguez y D. Rodriguez, «A Composite Indicator for University Quality Assesment: The Case of Spanish Higher Education System,» Social Indicators Reseach, vol. 89, n° 1, pp. 129-146, 2008. [ Links ]
[14] A. Garcia- Aracil y D. Palomares Montero, «Evaluación of spanish universities: Efficency, technology and productivity change,» de Pirme- Latin América conference, Mexico City, 2008. [ Links ]
[15] J. M. Gómez Sancho, «La evaluación de la eficiencia en las universidades públicas españolas,» Universitat de Lleida, Lleida. [ Links ]
[16] Y. Fernandez Santos, A. Marinez Campillo y J. M. Fernández Fernández, «Evaluación de la eficiencia y el cambio de productividad en el sistema universitario publico español tras la implantación de la LOU,» Review of public economics, vol. 205, n° 2, pp. 71-98, 2013. [ Links ]
[17] M. Cunha y V. Rocha, «On the effiency of public higher education institutions in protugal: An exploratory study,» University of Porto, Porto, 2012. [ Links ]
[18] G. I. Rodriguez Lozano, Indicadores DEA (Data Envelopment Analysis) de eficiencia y productividad para las actividades de extensión universitaria. Aplicación en la Universidad Nacional de Colombia, Bogotá: Universidad Nacional de Colombia, 2011. [ Links ]
[19] A. P. Garcia Amado y M. González Hurtado, «La evaluación de la eficiencia de las unviersidades públicas en Colombia utilizando el analisis evoilvente de datos (AED). Trabajo de grado,» Universidad Industrial de Santander, Bucaramanga, 2011. [ Links ]
[20] J. Soto, W. Arenas Valencia y A. Trejos, «La producción académica como uno de los indicadores del desempeño de las universidades públicas colombianas desde la perspectiva del análisis envolvente de datos,» Scientia et Technica, vol. 2, n° 28, 2005. [ Links ]
[21] M. J. Farrell, «The measurement of productive efficency,» The royal statistical society. Series A., vol. 120, n° 3, pp. 253-290, 1957. [ Links ]
[22] Y. Roll, W. D. Cook y B. Golany, «Controlling Factor Weights in Data Envelopment Analysis,» IIE Transactions, vol. 23, n° 1, pp. 29, 1991. [ Links ]
[23] D. Visbal Cadavid y F. Palacios Gómez, «Evaluación de la eficiencia relativa en el uso de recursos de las universidades públicas colombianas mediante la metodología deata envelopment analysis,» Universidad de los Andes, Bogotá, 2005. [ Links ]
[24] J. Soto Mejia, M. E. Bernal y W. Arenas Valencia, «Enfoque metodológico para medir la calidad de los programas académicos de la universidad Tecnologica de Pereira,» Scientia et Technica, vol. 15, n° 42, pp. 111-116, 2009. [ Links ]
[25] Presidencia de la república de Colombia, Decreto 1279 de 2002. "Por el cual se establece el régimen salarial y prestacional de los docentes de las Universidades Estatales.", Bogotá, 2002. [ Links ]
[26] Y. H. Chung, R. Fare y S. Grosskopf, «Productivity and undesirable outputs: a directional distance function approach,» Journal of Environmental Management, vol. 51, n° 3, pp. 229-240, 1997. [ Links ]
