


Services on Demand
Journal
Article
 English (pdf)
 Article in xml format
 Article references
 Send this article by e-mail
Indicators
-
 Cited by SciELO
 -
 Access statistics
Related links
-
 Cited by Google
 -
 Similars in
SciELO
Similars in
SciELO -
 Similars in Google
Share

 Permalink
Tecciencia
Print version ISSN 1909-3667
Tecciencia vol.11 no.21 Bogotá July/Dec. 2016
https://doi.org/10.18180/tecciencia.2016.21.7
DOI: http://dx.doi.org/10.18180/tecciencia.2016.21.7
Analysis through Dynamic Temporal Sequence Alignment in SpO2 Signals
Análisis en Señales SpO2 a través de Alineamiento Dinámico Temporal de Secuencia
Valentín Molina1,2*, Manuel Cuadra1,2, Luis J. Martínez1,2, Horderlin V. Robles1,2,3
1 Ingeniería Biomédica, Universidad ECCI. Bogotá, Colombia.
2 GINIC-HUS, Hospital Universitario de la Samaritana. Bogotá, Colombia.
3 DEMA, Universidad del Sinú, Elías Bechara Zainúm, Montería, Córdoba, Colombia.
* Corresponding Author. E-mail: amolinam@ecci.edu.co
How to cite: Molina, V., Cuadra, M. Martínez, L. J., Robles, H. V., Analysis through dynamic temporal sequence alignment in SpO2 signals, TECCIENCIA, Vol. 12 No. 21., 39-43, 2016, DOI: http://dx.doi.org/10.18180/tecciencia.2016.21.7
Received: 28 Sept 2015 Accepted: 21 Jul 2016 Available Online: 19 Aug 2016.
Abstract
In this paper a methodology for the alignment of waves in the photoplethysmography (PPG) register signal is shown. The procedure uses algorithms for dynamic programming and for optimization in order to generate a single segmentation of these waves in the PPG signal and the individual reconstruction of each wave. By aligning a pattern signal for the photoplethysmography, it is possible to make an individual segmentation of waves present in the PPG signal. Once the reconstruction of each individual wave is obtained, these data are indexed in an array, which enables easier temporary markers such as the individual location of each peak to the oxygen saturation (SpO2) signal analysis.
Keywords: Dynamic Programming, Sequence alignment, Photoplethysmography.
Resumen
Este artículo muestra una metodología para el alineamiento de ondas en la señal de registro de fotopletismografía (PPG). El procedimiento usa algoritmos para programación dinámica y optimización para generar una única segmentación de estas ondas en la señal PPG y la reconstrucción individual de cada onda. Alineando una señal patrón para la fotopletismografía, es posible hacer una segmentación individual de las ondas presentes en la señal PPG. Una vez se obtiene la reconstrucción de cada onda individual, estos datos se indexan en un arreglo, lo que permite facilitar marcadores temporales como la ubicación individual de cada pico al análisis de señal de saturación de oxígeno (SpO2).
Palabras clave: Programación dinámica, Alineamiento de secuencia, Fotopletismografía.
1. Introduction
Digital PPG is a simple optical method that can be easily implemented and inexpensive. It is generally used to measure changes in blood volume through the emission and reception of light on the skin surface at peripheral sites of the body like fingers, toes, ears and forehead [1] [2].
The PPG signal obtained as a result of the application of this method can be affected by natural conditions, sensor location, skin conditions (humidity, color, thickness), respiration, the perfusion phenomenon, viscosity and viscoelasticity properties of the arteries, arterial stiffness, and the reflected waves from peripheral sites that amplify and modify the form of the wave [3] [4] [5].
This signal has been used in a wide range of medical equipment for measuring oxygen saturation in the blood, blood pressure, cardiac output, to assess autonomic function, and detect peripheral vascular diseases [1]. In order to have this capability, the equipment must have tools to allow for the manual or automatic location of the fiducial points on the PPG signal.
Traditionally, detection of the systolic peak (maximum value) of the PPG signal has been used to obtain indicators from which one is able to estimate the arterial stiffness index, pulse wave velocity (PWV), pulse wave transit time (PWTT), and heart rate variability (HRV). These parameters have allowed for the assessment of the vascular effects of aging, hypertension, and atherosclerosis [6] [7] [8]. Other notable applications in which PPG peak signal detection has played a key role, are related to the measurement of baroreflex sensitivity [9], diagnosis of damage to the arteries [10], as well as diagnosis of peripheral vascular disease [11], ventricular ejection time, and arterial stiffness [12].
Therefore, peak detection has become an important tool for signal analysis of PPG in the time domain element. Furthermore, many studies have found that HRV, extracted from the PPG signal can be used as an alternative and reliable measure of HRV [13] [14] [15] [16] [17] [18] [19]. Even though there are methods of obtaining the HRV by detecting R peaks in the electrocardiographic signal (ECG) which have proved to be accurate and reproducible [20] [21] [22] [23] [24] [25] [26] [27], there is no much information regarding the methods for obtaining the HRV from the construction of pulse to pulse time-series based on detecting fiducial points in the PPG signal [15] [17] [19]. Many of the algorithms used for the detection of the peak in the PPG signal employ multiple stages of complex processing and have additional further disadvantages when they employ additional variables such as heart rate in order to set the logical criteria in decision making, which adds more complexity to the process [28].
Other algorithms based on thresholds are able to process the minimum and maximum amplitudes in the PPG signal at certain time intervals but have the limitation of not being able to distinguish the difference between the peak of the incident wave and the reflected wave when the amplitude of the latter is comparable to the first and is temporarily close [29]. In the absence of suitable algorithms, PPG signals end up being recorded manually in order to obtain the desired components (peaks), and in other cases the algorithms that have been developed do not reach the desired performance, the generality and the robustness required for analysis. Whereas other types of signals and analyses are successful, such as ECG [28] [6] [29] [30].
In [31] is proposed a method to pulse onset, systolic peak and dicrotic notch detection on the arterial blood pressure (ABP) waveforms. This approach is based on zero-crossing point of the first derivative of ABP signal, combined with amplitude and time adaptive threshold makes a final decision about the correct position points. This method presents suitable values of sensitivity, positive predictivity and error rate for onset and systolic peak detection. However, it can be affected by noise and artefacts present in the ABP signal. Nowadays, most of automatic methods used for pulses onset detection without R peaks as reference are affected by reflected waves, fluctuations and noise of the baseline, motion artefacts, high amplitudes variations due to respiration and others physiologic process, and others. Furthermore, the gold standard for onset definition does not exist [32] [33].
The following work uses the dynamic temporal sequence alignment to adjust or contract the different registered segments of the PPG signal in order to determine the maximum value of each of the waves that make up the registered signal and thereby obtain the HRV this way. The method makes a temporary (local) signal alignment of the PPG, in order to temporarily file the signal data into an array belonging to the waveform of each registered signal [34] [35]. In this way it could recover the timing with the maximum amplitude values of the pulse waves without using other reference signals.
2. Background
In the field of biosignal analysis, it is very common to compare between two or more sequences in order to find similarities between them or temporal correlation derived from the behavior of the analyzed data. Thus being able to generate the proper development of the alignment process of a large amount of sequence data using a pattern as a reference point in order to find similarities between the used reference point pattern and the sequence being analyzed at specific moments in time [35]. The local alignment algorithm optimized by Gotoh [36] through the use of dynamic programming [37] combines the information stored in matrices and the analyses of the data coming from different neighboring areas (diagonally, above, and below) of each specific data point.
As a consequence of that the algorithm uses the data points stored in the pointer array (Ptr) in order to keep a record of the origin of the maximum occurrence value caused by the alignment or comparison between a sample of the pattern and the signal being analyzed. This process is repeated until all waves are reconstructed after the alignment.
3. Methods
The method is based on the following steps in order to achieve the individual segmentation of the PPG waves, as well as for the extraction of their maximum amplitude values.
a. Score Analysis: analyzes the slopes of the waves that make up the signal, with the objective of being able to evaluate how similar the pattern sample and the analyzed signal are (sequence).
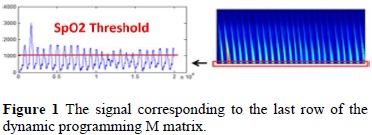
b. Alignments: performs a search initiating at the generated signal in the last row of the dynamic programming M matrix, in order to find the coordinates where the scores reached their maximum value, and it also generates an umbrella for the signal in order to reconstruct all the waves of the PPG log.
c. Reconstruction: Once located the maximum scores generated indexed by the local alignment algorithm, a reconstruction is done by source of generation of each peak in each of the samples.
Achieving an adequate umbrella for the generated signal in the last row of the M matrix, allows us to effectuate an optimal reconstruction [36] [35].
4. Results and discussions
Figure 1 shows the contents of the M matrix after the alignment between all the segments of the PPG signal and the pattern signal. Taking into consideration that the last row of said matrix contains in itself both the representation between the alignment of the pattern signal and each wave of the signal, it was possible, by applying a thresholding process, to find the initialization coordinates of where the reconstruction started for each individual wave that made up the log registry.
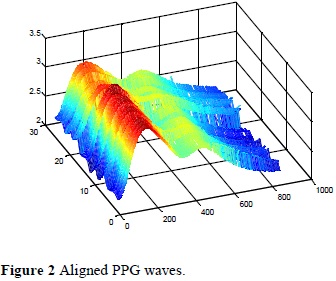
After the reconstruction the alignment and indexation of the waves was obtained and it is shown in Figure 2, and from these results, it was possible to obtain the maximum values of the PPG waves, shown in Figure 3.
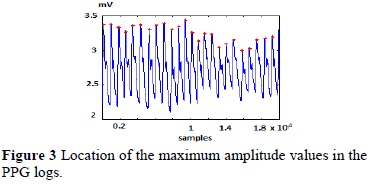
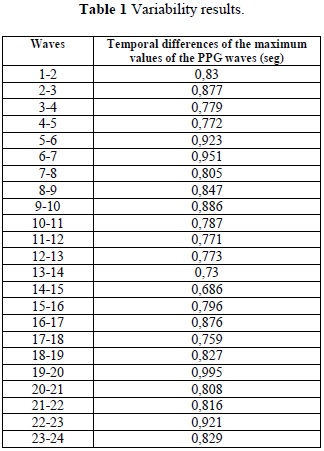
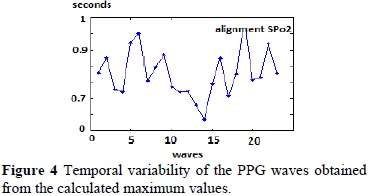
After obtaining the maximum values of the PPG waves, the temporal difference between waves were quantified (Table 1), and through the reconstruction of this variability curve it was possible to develop the variability graph shown in Figure 4.
5. Conclusions
The application of the dynamic temporal sequence alignment method applied to PPG signals allowed for the individual segmentation of the log records of photoplethysmography measurements and the acquisition of the maximum values associated with each of the wave values that made up said log registry records.
These maximum values in turn allowed the construction of the temporal variability of the PPG signals, showing the potential that this method may have in applications where an analysis of the modifications is required for the occurrences of the pulse wave for diagnostic purposes. The results show a simple way to find the maximum values of SpO2 signal, also providing that once rebuilt all signal waves and indexed data in a matrix, they will be more readily available to do some other type quantifications on the SpO2 signal. This method could be used to calculate clinical parameters derived pulse wave such as pulse transit time, without using time reference markers obtained from the record of other signals as electrocardiogram.
References
[1] Allen J 2007 Photoplethysmography and its application in clinical physiological measurement Physiol. Meas. 28 R1-R39. [ Links ]
[2] Hertzman A B 1937 Photoelectric plethysmography of the fingers and toes in man Proc. Soc. Exp. Biol. Med. 37 529-42. [ Links ]
[3] Jung D, Kim G, Kim K, Choi B, Suh D, Jeon G, Ye S 2007 Change of pulse wave velocity in arm according to characteristic points of pulse wave International Conference on Convergence Information Technology 821-826. [ Links ]
[4] London G M, Guerin A P 1999 Influence of arterial pulse and reflective waves on systolic blood pressure and cardiac function J. Hypertens. 17 S3-S6. [ Links ]
[5] Nichols W, Edwards D G 2001 Arterial elastance and wave reflection augmentation of systolic blood pressure: deleterious effects and implications for therapy J. Cardiovasc. Pharmacol. Ther. 6 5-21. [ Links ]
[6] Nenova, B., Iliev, I. 2010. An automated algorithm for fast pulse wave detection. Int. J. BIOautomation, 14(3), 203-216. [ Links ]
[7] O'Rourke M F 1999 Isolated systolic hypertension, pulse pressure, and arterial stiffness as risk factors for cardiovascular disease Curr. Hypertens. 1 204-211. [ Links ]
[8] Willum-Hansen T, Staessen J A, Torp-Pedersen C, Rasmussen S, Thijs L, Ibsen H, Jeppesen J 2006 Prognostic value of aortic pulse wave velocity as index of arterial stiffness in the general population Circulation 113 664-670. [ Links ]
[9] Rienzo, M.D., Castiglioni, P., Mancia, G., Pedotti, A., Parati, G. 2001. Advances in estimating baroreflex function. IEEE Eng. Med. Biol. Mag., 20(2), 25-32. [ Links ]
[10] Hlimonenko, I., Meigas, K., Vahisalu, R. 2003. Waveform analysis of peripheral pulse wave detected in the fingertip with photoplethysmograph. Measurement Science Review, 3(2), 49-52. [ Links ]
[11] Erts, R., Spigulis, J., Kukulis, I., Ozols, M. 2005. Bilateral photoplethysmography studies of leg arterial stenosis. Physiol. Meas., 26, 865-874. [ Links ]
[12] Foo, J.Y.A., Wilson S.J., Williams, G., Harris, M.A., Cooper, D. 2005. Pulse transit time as a derived non invasive mean to monitor arterial distensibility changes in children. Journal of Human Hypertension, 19, 723- 729. [ Links ]
[13] Charlot K, Cornolo J, Brugniaux J V, Richalet J P and Pichon A 2009 Interchangeability between heart rate and photoplethysmography variabilities during sympathetic stimulations Physiol. Meas. 30 1357-69. [ Links ]
[14] Gil E, Orini M, Bailón R, Vergara J M, Mainardi L and Laguna P 2012 Photoplethysmography pulse rate variability as a surrogate measurement of heart rate variability during nonstationary conditions Physiol. Meas. 31 1271-90. [ Links ]
[15] Hayano J, Barros A K, Kamiya A, Ohte N and Yasuma F 2005 Assessment of pulse rate variability by the method of pulse frequency demodulation BioMed. Eng. Online 4 62. [ Links ]
[16] Lu G and Yang F 2009 Limitations of oximetry to measure heart rate variability measures Cardiovasc. Eng. 9 119-25. [ Links ]
[17] Lu G, Yang F, Taylor J A and Stein J F 2009 A comparison of photoplethysmography and ECG recording to analyse heart rate variability in healthy subjects J. Med. Eng. Technol. 33 634- 41. [ Links ]
[18] Schäfer A and Vagedes J 2012 How accurate is pulse rate variability as an estimate of heart rate variability? Int J Cardiol, doi:10.1016/j.ijcard.2012.03.119. [ Links ]
[19] Selvaraj N, Jaryal A K, Santhosh J, Deepak K K and Anand S 2008 Assessment of heart rate variability derived from finger-tip. photoplethysmography as compared to electrocardiography J. Med. Eng. Technol. 32 479-84. [ Links ]
[20] Afonso V X, Tompkins W J, Nguyen T Q and Luo S 1999 ECG beat detection using filter banks IEEE Trans. Biomed. Eng. 46 192-20. [ Links ]
[21] Martinez J P, Almeida R, Olmos S, Rocha A P and Laguna P 2004 A wavelet-based ECG delineator: evaluation on standard databases IEEE Trans. Biomed. Eng. 51 570-81. [ Links ]
[22] Nunan D, Donovan G, Jakovljevic D G, Hodges L D, Sandercock G R and Brodie D A 2009 Validity and reliability of short-term heart-rate variability from the Polar S810 Med. Sci. Sports Exerc. 41 243-50. [ Links ]
[23] Porto L G and Junqueira L F Jr 2009 Comparison of time-domain short-term heart interval variability analysis using a wrist-worn heart rate monitor and the conventional electrocardiogram Pacing Clin. Electrophysiol. 32 43-51. [ Links ]
[24] Ruha A, Sallinen S and Nissila S 1997 A real-time microprocessor QRS detector system with a 1 ms timing accuracy for the measurement of ambulatory HRV IEEE Transactions on Biomedical Engineering 44 159-67. [ Links ]
[25] Smolander J, Juuti T, Kinnunen M L, Laine K, Louhevaara V, Männikkö K and Rusko H 2008 A new heart rate variability-based method for the estimation of oxygen consumption without individual laboratory calibration: application example on postal workers Appl. Ergon. 39 325-31. [ Links ]
[26] So H and Chan K L 1997 Development of QRS detection method for realtime ambulatory cardiac monitor Proc IEEE EMBS Chicago USA 1 289-92. [ Links ]
[27] Vidaurre C, Sander T H and Schlögl A 2011 BioSig: The Free and Open Source Software Library for Biomedical Signal Processing Computational intelligence and neuroscience 935364. Avail. at: http://www.pubmedcentral.nih.gov/articlerender.fcgi?artid=3061298&tool=pmcentrez&rendertype=abstract. [ Links ]
[28] Aboy, M., McNames, J., Thong,T., Tsunami, D., Ellenby, M.S., Goldstein, B. 2005. An automatic beat detection algorithm for pressure signals. IEEE Trans. on Biomed. Eng., 52 (10), 1662-1670. [ Links ]
[29] Shin, H.S., Lee, C., Lee, M. 2009. Adaptive threshold method for the peak detection of photoplethysmographic waveform. Comp. in Biol. Med., 39, 1145-1152. [ Links ]
[30] Treo, E.F., Herrera, M.C., Valentinuzzi, M.E. 2005. Algorithm for identifying and separating beats from arterial pulse records. Biomedical Engineering online, 4, 48. [ Links ]
[31] Li B N, Dong M C, Vai M I 2010 On an automatic delineator for arterial blood pressure waveforms Biomedical Signal Processing and Control 5 76-81. [ Links ]
[32] Xu P., Bergsneider M., Hu X., Pulse onset detection using neighbor pulse-based signal enhancement Medical Engineering & Physics 31 337-345, 2009. [ Links ]
[33] Quintero, J.E., Manotas, G. F., Galeano, Y. A. & Tellez, D. M., Design and development of transcutaneous electrical simulation of equipment for neuromuscular rehabilitation in individuals whit facial palsy, TECCIENCIA, vol. 9, n° 16, pp. 43-49, 2014. [ Links ]
[34] Gotoh O. An improved algorithm for matching biological sequences. J. Mol. Biol., vol. 162, pp. 705-708, 1982. [ Links ]
[35] Valentín Molina, Gerardo Ceballos, Hermann Dávila, Ecg Signal Analysis Using Temporary Dynamic Sequence Alignment, IEEE xplore, 2013. [ Links ]
[36] Ceballos V. Grieken Gerardo; Paredes Q. José Luis. Pattern recognition in capillary electrophoresis using multiresolucional analysis and dynamic programming, 2005. [ Links ]
[37] Bellman Richard. Dynamic Programming. Princeton Universiry Press: Princeton, N. J., 1957. [ Links ]
[38] Estrada, G. M. et al., Relationship of blood pressure with the electrical signal of the heart using signal processing, TECCIENCIA, Vol. 9 No. 17., 9-14, 2014, DOI: http://dx.doi.org/10.18180/tecciencia.2014.17.1 [ Links ]

