


Serviços Personalizados
Journal
Artigo
 Inglês (pdf)
 Artigo em XML
 Referências do artigo
 Enviar este artigo por email
Indicadores
-
 Citado por SciELO
 -
 Acessos
Links relacionados
-
 Citado por Google
 -
 Similares em
SciELO
Similares em
SciELO -
 Similares em Google
Compartilhar

 Permalink
Tecciencia
versão impressa ISSN 1909-3667
Tecciencia vol.11 no.21 Bogotá jul./dez. 2016
https://doi.org/10.18180/tecciencia.2016.21.10
DOI: http://dx.doi.org/10.18180/tecciencia.2016.21.10
Measurement of Complex Dielectric Permittivity in Oils from High-Voltage Transformers Using a Coaxial Probe
Medición de la Permitividad Dieléctrica Compleja en Aceites de Transformadores de Alta Tensión Usando una Sonda Coaxial
Ernesto Aguilera Bermúdez1*, Oswaldo Rodríguez Rico1,
1 Escuela de Ingenierías Eléctrica, Electrónica y de Telecomunicaciones, Universidad Industrial de Santander, Bucaramanga, Santander, Colombia
* Corresponding Author. E-mail: ernesto.aguilera@radiogis.uis.edu.co
How to cite: Aguilera, H., Rodriguez, O. V., Measurement of Complex Dielectric Permittivity in Oils from High-Voltage Transformers Using a Coaxial Probe, TECCIENCIA, Vol. 12 No. 21., 60-66, 2016, DOI: http://dx.doi.org/10.18180/tecciencia.2016.21.10
Received: 01 Dec 2015 Accepted: 24 May 2016 Available Online: 31 Aug 2016.
Abstract
In this paper a methodology for the alignment of waves in the photoplethysmography (PPG) register signal is shown. The procedure uses algorithms for dynamic programming and for optimization in order to generate a single segmentation of these waves in the PPG signal and the individual reconstruction of each wave. By aligning a pattern signal for the photoplethysmography, it is possible to make an individual segmentation of waves present in the PPG signal. Once the reconstruction of each individual wave is obtained, these data are indexed in an array, which enables easier temporary markers such as the individual location of each peak to the oxygen saturation (SpO2) signal analysis.
Keywords: Dynamic Programming, Sequence alignment, Photoplethysmography.
Resumen
Este trabajo presenta los resultados obtenidos en la medición de la permitividad dieléctrica compleja de algunas muestras de aceite de transformadores de alta tensión en un rango de frecuencias comprendido entre 100 MHz y 3GHz. Se tienen en cuenta tres tipos de muestras de aceite: nuevas, usadas y aquellas muestras usadas a las que se les ha realizado un proceso de filtración para su recuperación y nuevo uso. Las mediciones son realizadas utilizando una sonda de bajo costo adaptada a partir de un conector coaxial SMA con terminación abierta. Los valores obtenidos en un analizador de redes vectorial VNA del coeficiente de reflexión, medido en la superficie de contacto entre la sonda y el aceite, son usados para calcular la parte real e imaginaria de la permitividad dieléctrica compleja mediante el uso de modelos teóricos de la terminal abierta del cable. Los resultados obtenidos permiten dar confianza en este método de medición y caracterización de los aceites de acuerdo al valor de la permitividad dieléctrica compleja, ya que concuerdan con algunos valores reportados en la literatura obtenidos por métodos diferentes.
Palabras clave: espectroscopia dieléctrica, sonda coaxial, coeficiente de reflexión, transformadores de alta tensión, aceites paranínficos.
1. Introduction
Dielectric spectroscopy is a branch of applied magnetism, in charge of implementing measurement techniques that permit quantifying and characterizing the different storage processes and energy dissipation through the effects of electric polarization taking place when a material is exposed to electromagnetic radiation. In the frequency domain, material polarization is characterized by the complex relative dielectric permittivity of the medium ∈(,T)= ∈^' (,T)-j ∈^'' (,T), which is a function of frequency and temperature T. The amount of electromagnetic energy that can be stored by the material exposed to radiation is proportional to the real part ∈^', and the amount of electromagnetic energy dissipated in heat is proportional to the imaginary part ∈^''. In the radiofrequency range different methods exist to conduct the dielectric spectroscopy of a material, among the most used is the use of parallel plate capacitors, resonators, and microwave guides in which the material to be characterized is introduced [1].
Another widely used technique, due to its low cost and easy implementation, is the use of an open-ended coaxial cable probe. The substance of interest is placed in contact with the probe surface and the reflection coefficient S_11 is measured through a vector network analyzer (VNA). Then, different theoretical or circuital models are used to relate the measurements of the reflection coefficient to the real and imaginary part of the complex dielectric permittivity. In [2] Piuzzi and Merla use a circuital model composed of two parallel capacitors, associated to the electromagnetic effects that occur on the contact surface between the surface of the coaxial cable and the sample being tested. In [3] Baker uses a model of electromagnetic fields to model this same effect.
Among many of the fields of application of dielectric spectroscopy there is medicine and the food industry. It is important to electromagnetically characterize the different tissues of the human body to dosage the amount of radiation required during therapy, whether it is for muscular rehabilitation or treatment of a cancerous tumor [4]. In the microwave heating industry, as in - for example - pasteurization processes and food defrosting, numerical simulations permit optimizing processes by reducing costs and improving the quality of the final product without compromising its qualities or producing its deterioration. Just as the quality of a food product can be determined from many factors, like its density, color, or fluidity, the value of the complex dielectric permittivity in function of frequency is also used to characterize some qualities from different products. García and Torres in [5] calculate the dielectric permittivity of wine within a frequency range between 200 MHz and 3 GHz by using an open-ended coaxial probe, and Jan and David Vrba in [6] studied the complex dielectric permittivity of sunflower oil and olive oil.
This work presents the results obtained by measuring the complex dielectric permittivity of some oil samples from high-voltage transformers in a frequency range comprised between 100 MHz and 3 GHz. Degradation of these oils with time of use produces the appearance of different substances, like gases, water, and cellulose among many others. Diverse methods exist to characterize and measure these substances associated to serious damage in the transformers and to their poor operation; all this leads to high maintenance and repair costs. Three types of oil samples are considered in general: new, used, and those used samples that have undergone a filtering process for their recovery and new use. The measurements were made by using a probe adapted from a low-cost open-ended SMA coaxial connector. The values obtained in a VNA of the reflection coefficient are converted into the real and imaginary part of the complex dielectric permittivity by using theoretical models of the cable's open end. In [7] Dervos and Paraskevas show work similar to the work presented herein, but the transformer oil samples are characterized by using a high-cost measurer of RLC parameters; besides, the frequency range analyzed by them goes from 20 Hz to only 1 MHz].
2. Methods
The technique used in this work to measure the complex dielectric permittivity of oils from high-voltage transformers is based on knowledge of the admittance associated to the boundary between the SMA probe surface and the sample of the substance to be measured. This requires two steps: 1. From the measurement of the amount of energy reflected on the contact interphase between the border of the coaxial probe and the substance measured, impedance is measured in the frequency range of interest and, hence, the admittance, for this purpose the network analyzer is used; 2. Through an adequate circuital model, admittance is related to some values of the circuital elements, which implicitly include the probe's geometric shape and the conductivity and polarization parameters of the sample measured. The following offers a detailed description of these steps.
2.1 Theoretical model
The transmission line theory relates the amount of electromagnetic energy transmitted and reflected that occurs in a change of medium with their impedance or admittance values in the following manner:
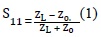
Where ZL is the impedance of the transmission medium and Z0 is the impedance of the incident medium. S11 is the reflection coefficient that measures the relationship between the amounts of energy reflected with respect to the amount of incident energy. Equation 1 may easily be converted into a relation between the reflection coefficient and the admittance of the transmission medium.
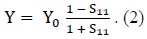
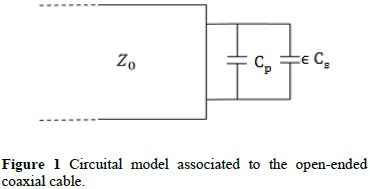
Given admittance Y()=G()+jB() associated to the coaxial probe terminal, an adequate circuital model is associated to relate its real and imaginary parts with the real and imaginary part of the complex dielectric permittivity, ∈^' and ∈^''. Different models are found in literature, which bear in mind the phenomena of polarization and losses, including radiation losses [8]. Figure 1 shows a model that presents two parameters associated to two parallel capacitances, Cs and Cp. These consider effects, like the distribution variation of the electric field on the borders of the coaxial and losses in the dielectric. Equation 3 presents the total admittance of this circuit, YL.
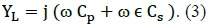
Here, ∈ represents the complex dielectric relative permittivity of the medium, ∈= ∈^'-j ∈^'', ∈^' corresponds to the dielectric constant and ∈^'' to the loss constant.
By equaling the real and imaginary parts of equations 2 and 3, we obtain a system of two equations, 4 and 5, from which we can clear ∈^' and ∈^'' from the measurements of the reflection coefficient and the values of Cs and Cp.
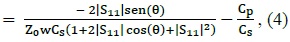
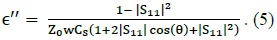
Here, |S_11 | is the magnitude of the reflection coefficient and θ its phase angle. Values of Cs and Cp must be previously obtained from the same equations through a process using a substance of known complex dielectric permittivity in the frequency range of interest:
Among the substances most used as reference to determine Cp and Cs values are distilled water and some alcohols of known concentrations. The scientific literature reports the values measured from constants ∈^' and ∈^'' via different methods, within a varying range of frequencies and temperatures [9]. It is advisable for these parameters to be obtained with substances of properties similar to those that will then be measured. Sometimes it is necessary to recur to a theoretical dispersion model to be taken as reference, like the Debye model, with one or several relaxation times, or the Lorentz model. Equation 6 characterizes the complex dielectric permittivity of a single relaxation time, τ, Debye model in function of frequency.
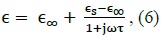
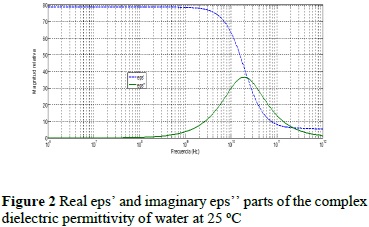
Where ∈_s is the low-frequency permittivity or static permittivity, while ∈_∞ describes the permittivity behavior for high frequencies. The relaxation constant, τ, depends on temperature. Figure 2 shows the values of ∈^' and ∈^'', according to the Debye model for water at 25 °C. The value of ∈_∞ is 5.60, ∈_s is equal to 78.8, and the value of τ is 8.3 picoseconds.
2.2 Theoretical model
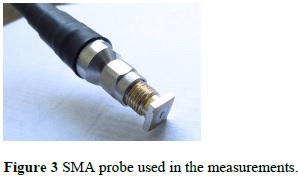
To measure the reflection coefficient of the substance of interest a vector network analyzer (Rohde&Schwarz ZVL) was used operating at a frequency range between 9 kHz and 3 GHz. It is connected to a coaxial cable connected to the measurement probe. The measurement probe is made up of an SMA-type coaxial connector with the interior connector cut and polished, to have a flat surface as uniform as possible. This is fundamentally important when seeking to measure solid substances because this guarantees better contact between the surfaces, avoiding air zones in the interphase that can prejudice the measurements. Figure 3 shows the probe adapted for the measurements connected to the end of the VNA coaxial cable.
Prior to measuring the reflection coefficient with the VNA, the calibration process must take place. Generally, the equipment's own calibration kit is used, composed of three different loads: a short, an open circuit, and load adapted to the instrument's input port. To avoid moving the reference plane from the point where the instrument is calibrated to the point where the measurement is performed, which would entail additional processes, like numerical simulations or de-embedding [8], the calibration was carried out directly on the measurement plane on the SMA surface probe. For this purpose, a short circuit was simulated by placing in contact the probe surface with a piece of aluminum foil; for the open circuit the probe was left out in air, and as adapted load the calibration kit's own load was used.
3. Results and discussions
3.1 Calculation of Cp and Cs parameters
As already mentioned, it is adequate, whenever possible, to take as substance of reference a substance with characteristics similar to those that will be measured. Due to this, to measure the dielectric permittivity of oils from high-voltage transformers, we took olive oil with 0.3% degree of acidity, which is easily acquired, and its analytical dispersion model reported in [6] at 25 °C. Equation 7 specifies the model along with the parameters required:
In this equation, the value of ∈_∞ was taken as 2.39, ∈_s is equal to 3.08, the value of f_r is 315 MHz, and the value of β is 0.33.
The values configured in the VNA for the reflection coefficient measurements of the olive oil and the other substances were the following:
- Frequency range: 100 MHz - 3 GHz.
- Number of samples within the frequency range: 201.
- Intermediate filter: 1 kHz.
- Power: 0 dBm.
- Averaged factor: 10.
All measurements were carried out at 26 °C.
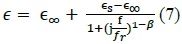
Upon measuring the magnitude of the reflection coefficient |S_11 | and its θ phase, these are replaced in equations 4 and 5, along with the values of ∈^' and ∈^'' from the Debye model and the Cp and Cs values are calculated for each frequency. Figure 3 shows the results obtained, note typical values in the order of tenths of a picofarad.
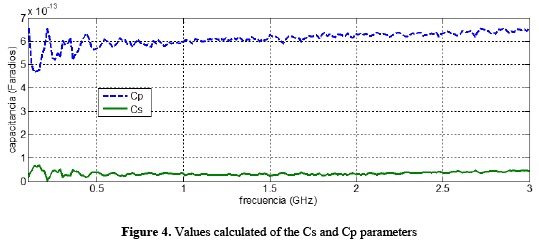
The validity of the circuital model employed can be tested by using the Cp and Cs values obtained to calculate the dielectric permittivity of the same substance of reference -olive oil- again using equations 4 and 5 and comparing the results with those of the Debye model in the specified frequency range. Figure 5 shows these results where good coincidence is appreciated.
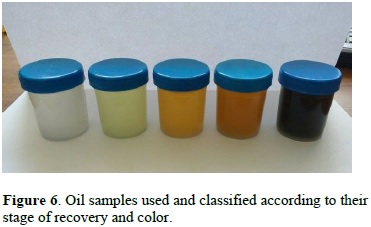
The samples from high-voltage transformer oils used are paraffinic type, different from the oils used in previous decades, which were already banned due to their high content of toxic substances, including Polychlorinated Biphenyls (PCBs). These oil samples correspond to the different stages of their recovery, from the moment they are received, until they leave the complete filtering process. For comparison, a simple of new oil is also included. Figure 6 shows the spectrum of oils used, which are well differentiated by the tonality of their color: the darkest corresponds to a completely burnt oil and the clearest is the new oil.
3.2 Calculation of ∈^' and ∈^''
The samples from high-voltage transformer oils used are paraffinic type, different from the oils used in previous decades, which were already banned due to their high content of toxic substances, including Polychlorinated Biphenyls (PCBs). These oil samples correspond to the different stages of their recovery, from the moment they are received, until they leave the complete filtering process. For comparison, a simple of new oil is also included.
Figure 6 shows the spectrum of oils used, which are well differentiated by the tonality of their color: the darkest corresponds to a completely burnt oil and the clearest is the new oil.
By numbering the oils from left to right, from the clearest, sample 01, to the darkest, sample 05, they are assigned the following classification.
- Sample 01: new oil.
- Sample 02: completely filtered oil.
- Sample 04: oil in intermediate stage of recovery.
- Sample 05: burnt oil received for recovery.
Sample 03 corresponds to another oil received that corresponds to a different transformer, delivered for recovery but it is not burnt.
Figure 7 shows the results obtained from the dielectric constant of three of the oil samples: new oil, recovered oil, and burnt oil without processing; Figure 8 shows the value of the corresponding loss constant.
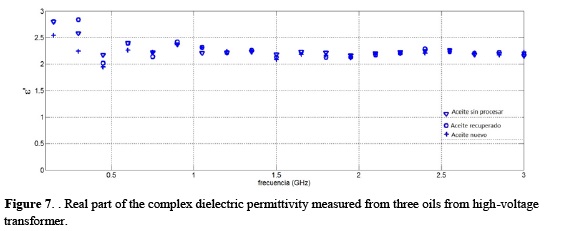
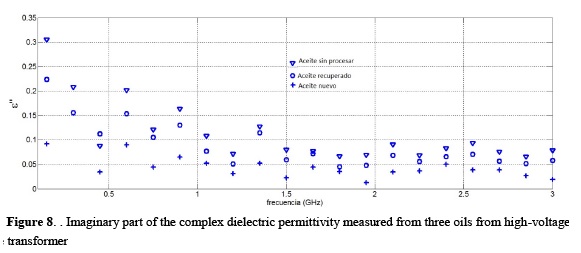
The results obtained permit formulating a series of observations:
Low values of the dielectric constant, and more so those of the loss constant, are of the same order of magnitude as those reported by Dervos in [7]. Low losses agree with that expected of an insulating oil to manage high voltages.
While in the frequency range considered, 100 MHz - 3GHz, the dielectric constant remains almost constant, the loss constant diminishes. This decrease agrees with loss model proportional to 1/, associated to the decrease of mobility of the ionic loads as frequency increases, while polarization does not undergo big variations.
The value de la loss constant measured in the oils agrees with that expected. Lower losses are evidenced in the new oil, while the highest losses occur in oil that has not gone through the filtering or recovery process. It is worth noting that the qualities of the new oil are better than those of recovered oil. Losses in the oil are related to diminished level of oil insulation.
As with other techniques, which classify the degree of insulation of the oils according to color, pH value, dielectric rigidity, etc.; the results evidence that the measurement of the loss constant can be used as an extra classification factor that can be then related to some
degradation factors of the oil: creation of gases, appearance of water, cellulose contamination, etc.
4. Conclusions
This work presented the complex dielectric permittivity measurements of some oil samples from high-voltage transformer by using a low-cost coaxial probe and an impedance reader. The results obtained agree with those reported by other authors who use different measurement methods. These results also provide reliability for this measurement method to be used as an extra means to classify the working condition and useful life of oils. As an interesting case, the study shows how an oil that has undergone a recovery process does not present the same conditions as a new oil. Subsequent works should correlate the measurements obtained herein with some of the oils' degradation factors.
5. Acknowledgments
This work was supported by the division of the Vice-Rectory of Research and Extension, VIE, at Universidad Industrial de Santander, UIS, through internal research project code 1355.
References
[1] Agilent Technologies, "Agilent Basics of Measuring the Dielectric Properties of Materials," Notes of Application, June. 2006. [ Links ]
[2] E. Piuzzi; C. Merla, "A Comparative Analysis Between Customized and Commercial System for Complex Permittivity Measurements on Liquid Samples at Microwave Frequencies," IEEE Transactions on Instrumentation and Measurements, vol. 62, n5, pp. 1034-1045, May. 2013. [ Links ]
[3] J. Baker, "Analysis of an Open-Ended Coaxial Probe with Lift-Off for Nondestructive Testing," IEEE Transactions on Instrumentation and Measurements, vol. 43, n5, pp. 711-717, Oct. 1994. [ Links ]
[4] M. Kuhn; M. Awida, "Open-Ended Coaxial Probe Measurements for Brest Cancer Detection," IEEE Radio and Wireless Symposium, pp. 512-515, Jan. 2010. [ Links ]
[5] A. García, J. L. Torres, "Dielectric Characteristics of Grape Juice and Wine," Biosystem Engineering, vol. 88, n3, pp. 343-349, Jul. 2004. [ Links ]
[6] J. Vrba and D. Vrba, "Temperature and Frequency Dependent Empirical Models of Dielectric Properties of Sunflower and Olive Oil," Radio-engineering, vol. 22, n4, pp. 1281 -1287, Dec. 2013. [ Links ]
[7] C. T. Dervos, C. Paraskevas, "A Complex Permittivity Based Sensor for the Electrical Characterization of High-Voltage Transformer Oils," Sensors, vol. 5, pp. 302 -316, May. 2005. [ Links ]
[8] S. Seewattanapon, P. Akkaraekthalin, "A Broadband Complex Permittivity Probe Using Stepped Coaxial Line," Journal of Electromagnetic Analysis and Applications, vol. 3, pp. 312 -318, Aug. 2011. [ Links ]
[9] A. P. Gregory, "Table of Complex Permittivity of Dielectric Reference Liquids at frequencies Up to 5 GHz," ResearchGate, Technical Report, Jan. 2012. [ Links ]

