


 English (pdf)
 Article in xml format
 Article references
 Send this article by e-mail
 Cited by SciELO
  Cited by Google
  Similars in
SciELO
Similars in
SciELO  Similars in Google
 Permalink
1. Introduction
Important progress in computational systems, regarding capacity and velocity, make it possible to find hardware and software technologies available for simulation in the area of fluids dynamics using computational fluid dynamics (CFD) techniques. These technologies can be employed as a valuable support tool in the process of design, optimization, and analysis of turbo-machinery and other elements, like nozzles, diffusers, and smokestacks, among others. With this tool, we can simulate the behavior of fluids and their interaction with different components. This can reduce significantly the time of development of new turbo-machines and their optimization [1].
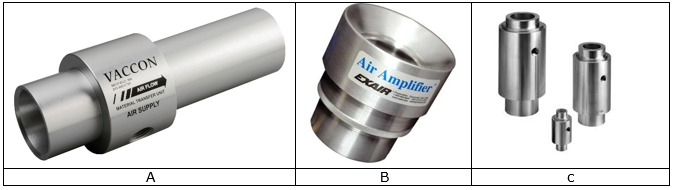
Henri-Marie Coandă (1885-1972) discovered the Coandă-effect; it is the capacity of a flow to follow a curved surface without detaching from the boundary layer. The Coandă-effect has been studied and implemented in different fields of engineering, among them, aerospace applications, like control of boundary layer in short take-off and landing aircraft; industrial applications, like pneumatic transport of particulate material [2], low-level ventilation systems, amplifiers, and air extractors, like those shown in Fig. 1.
Devices using the Coandă-effect present some advantages with respect to conventional systems because these do not have moving parts, do not generate vibrations, do not require special assembly structures or electrical installations, have reduced mass, and are easy to operate. These advantages permit ejectors to require low maintenance. In spite of their presenting greater advantages with respect to conventional ventilation systems, industrial research and implementation of Coandă-effect ejectors is limited due to the lack of studies to better characterize their operation and the incidence of operational and geometric parameters.
The aim of this work was to analyze an air ejector through computational fluid dynamics implemented in the Fluent package by Ansys® V 16.2. The ejector analyzed is widely used in industry due to its operating characteristics and - especially - because it reaches a four-fold multiplication factor of volumetric flow. The results obtained from the simulation are contrasted with experimental results obtained from the real evaluation of the ejector in different operating conditions. The subsequent sections will present the ejector operation, its theoretical foundations, numerical modeling, simulation, results, discussions, and conclusions.
2. Framework
2.1 Operating principle
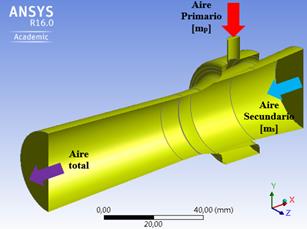
Generally, air ejectors under the Coandă-effect are constituted by a control volume that contains four regions, which - in turn - has three open boundaries and an internal transference interface of variable separation; the ejector’s geometry is shown in Figure 2. The first region of the control volume is the suction region in which the secondary air or air to eject is suctioned toward the ejector’s subsequent regions.
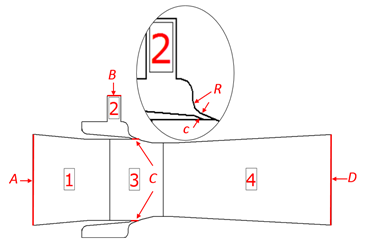
Figure 2 Representative zones of the Coandă-effect ejector (ZH30-X185 by SMC®). Key: 1. Suction, 2. High pressure, 3. Mixture, 4. Ejection, A. Secondary air intake, B. Primary air intake, C. Primary/Secondary air interface, D. Mixed air exhaust, R. Curvature radius, c. Curved nozzle gap.
This region has the inlet port of the secondary air. The second region is the high-pressure region, which is an annular chamber around the final stage of the suction region; here, the primary air or ejector air is injected through the high-pressure inlet (second boundary). In this region, high-pressure air is distributed in the annular chamber and is forced to exit through the curved nozzle that is the interface that communicates the high-pressure region with the mixture region; around this interface 3, the mass flow of primary air converts its flow energy into kinetic energy.
Figure 2 shows the interface between the high-pressure region 2 and the mixture region 3 of the ejector; it has a separation-c variable that calibrates the flow rate. The mixture region is the third region where the mixture process of the primary and secondary fluids occur. This process is complex and difficult to describe, given that the primary fluid adheres to the walls of the region, taking a high angular and tangential rate and generating viscous shear stress between both fluids, which permits exchange of linear and angular moment between them.
This allows dragging or suctioning the secondary air; the primary air undergoes the Coandă-effect given that it adheres to the cylindrical surface and there is no detachment from the boundary layer. The last region is that of ejection-4. In it, the primary and secondary fluids complete their mixture and form a uniform flow that leaves the ejector this is function of the longitude of the ejection zone 4.
The performance of this device is strongly influenced by geometric and operational parameters, especially the geometry of the injection channel of primary air determined by separation-c from the interface between the high-pressure region 2 and the mixture region 3. The curvature radius-R in the mixture zone and the relation between the pressure of the primary air with respect to the pressure from the secondary air determine the efficiency of the device.
2.2 Theoretical framework
Coandă-effect ejectors are subjected in most applications to conditions of turbulent and compressible flow. This study considers a compressible, isothermal, Newtonian fluid under stationary flow conditions and does not consider external forces that interact with the fluid. Equations of amount of movement and conservation of the mass under these considerations are expressed, respectively:
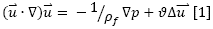

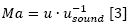
Where p represents pressure and u velocity. The compressibility effects are determined by calculating the Mach (Ma) number, equivalent to the relation between the fluid rate and the speed of sound for the same conditions, as shown:
2.3 Current status
Few modeling works are available on Coandă-effect ejectors, which gives rise to improving some existing devices. Researchers in [3] formulated a calculation code to study Coandă-effect ejectors; this study was mainly supported on experimental speed measurements of the secondary air by using anemometers of Doppler Effect conducted for two different ejector geometries. The formulation of correlations assumes the primary fluid as isentropic in the mixture zone. This calculation model can be implemented satisfactorily in low-pressure applications, where the isentropic conditions in the mixture zone are considerably close to the nature of the flow.
Researchers in [4] presents two calculation models at subsonic and supersonic regime, finding that for subsonic and supersonic regime, the compressibility effects of the primary air are not correctly replicated and the wall effects are not characterized in the generation of the boundary layer. Researchers in [5] conducted a parametric study through computational simulation of fluids and experimental speed measurements of the secondary air to optimize a Coandă-effect ejector. According to the author, the dimension of the separation-c from the interface between the high-pressure region and the mixture region is fundamental with respect to the ejector’s performance.
From literature and experimental tests, it may be possible to obtain a similar behavior of the influence of the separation-c from the interface and ejector efficiency, verifying improvement in the speed profiles in the mixture zone, mainly finding increased velocities as the separation-c diminishes at the output of the high-pressure chamber [7]. Although several works have studied the influence of geometric and operational parameters, a correlation that permits estimating the behavior of the fluid within the ejector (fields of velocity and pressure) was not found in the state-of-the-art. This, to determine the influence of the separation-c and the pressure of the primary air (compressed air) in the ejector’s energy efficiency. The aim of this computational analysis consists in improving the energy efficiency of an existing commercial ejector under the operating conditions recommended by the manufacturer, varying the separation-c with respect to that established in the device.
3. Numerical Model
All computer-assisted engineering processes, and especially those using fluid dynamics techniques, use five sequential steps in their development: the first step is the construction of a geometric model that represents adequately in three dimensions the components of solids of the object under study. The second is the creation of the volume of fluid that is limited by the solid boundaries of the geometric model - this volume will be analyzed through CFD techniques.
Discretization is the third step; here, the volume of the fluid is divided in very small cells, thus, generating what is known as finite volumes. Equations of balance of mass, energy, and moment will be solved in these infinitesimal volumes.
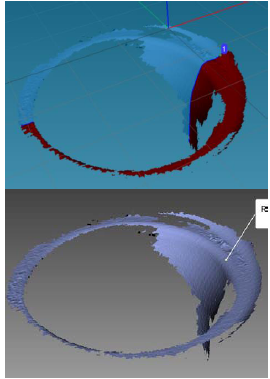
Figure 3 Partial digitalization of the curvature radius R from the region of injection of primary air toward the mixture region
The fourth step is the configuration of the simulation process, which decides the energy models, turbulence, temporal state, variables to analyze, residues sought by solving the. The last step is simulation, which runs the configuration in high-performance computers that permit solving the balance equations by using the given boundary models and conditions.
3.1 Geometry
The ejector’s 3D model was carried out by using the DesignModeler module by Ansys®, performing a geometry survey of the commercial ejector (ZH30-X185 by SMC®) and conducting the basic operations of volume generation in CAD software. The ejector is composed of two pieces; the first contains the suction region and half of the high-pressure region and of interface C. The second contains the sections that complete the high-pressure region and mixture region and the air ejection region; these two pieces are assembled through a precision threaded system between them with which separation-c from interface C is calibrated (Figure 2).
The annular and mixture zones - given their characteristic of being zones of high geometric complexity - had to be treated in special manner. These were partially reconstructed through a 3D digitalization process by using a 3D scanner (Artec Spider®) and the cloud treatment of points in the Artec Studio® 9.0 software, which permitted establishing the curvature radius-R of the output interface C from the high-pressure zone to the mixture zone, as shown in Figure 3.
Due to commercial reasons, the complete scan of the device is not shown, as well as the assembly and the parts that comprise it. Two models of the ejector were constructed, which presented a separation-c in the interface of 0.3 and 0.8 mm for the first model and for the second model, respectively.
These values correspond to higher and lower separations to the separation-c established by the manufacturer, which is not found in middle of the range selected.
A hypothesis assumed upon selecting these separations consists in supposing a sonic flow (Ma = 1) with the separation-c recommended by the equipment’s manufacturer; the value of the lower separation is taken slightly close to the value established by the manufacturer. This is done to avoid flow stagnation due to restriction and obtaining supersonic conditions (Ma>1), the higher separation of 0.8 mm is assumed to obtain in the simulation a subsonic flow and, thus, evaluate the device’s performance under different flow regimes.
3.2 Volume of fluid
This volume is created through Boolean operations, where the negative is extracted from the solid model, that is, it only considers the geometry of the air volume contained by the ejector. When having two models, it was necessary to have two fluid volumes, corresponding to a 0.3- and 0.8-mm separation-c.
3.3 Discretization process and boundary conditions.
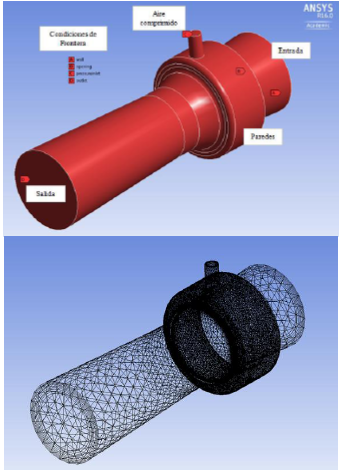
The discretization process of the control volume was carried out in the Meshing® module of the commercial software Ansys V16.2®; approximately 2.5-million hexahedral and prismatic elements represent the air volume within the ejector. To adjust the number of elements that make up the control volume, the study used a dynamic adaptation of the mesh every 250 iterations, having as adjustment value the velocity gradient normalized between 0 and 0.5, that is, a mesh-refining process takes place in those elements with normalized velocity gradient above 0.5. To guarantee correct treatment of the boundary layer close to the ejector’s wall, a treatment was used to improve the meshing near the walls and values of y+ were established between 5 and 30.
The boundary conditions associated to the control volume are shown in Figure 5 and were established in the following manner: total pressure of 0.2, 0.25, and 0.3 MPa for the supply of compressed air (mp), which correspond to the midrange of operating pressure suggested by the equipment’s manufacturer (0.1 to 0.5 MPa). Total pressure of 0.1 MPa of the input of the secondary air (ms), and at the output. Total air temperature of 300 K was established in both input zones and at the output of the control volume. Condition of wall without sliding was established as representation of the ejector’s surfaces.
3.4 Configuration of the numerical model
The solution process of the Navier Stokes equations for a three dimensional and compressible flow was conducted in the Ansys Fluent® program V16.2.
An implicit solution method, of Roe-FDS flow type and second-order spatial discretization guarantee a reliable solution. The fluid selected is air as ideal gas. The turbulence model corresponds to the k-ε RNG together with the energy equation to bear in mind the fluid’s density variation [6]. To start the system of equations, select the hybrid initialization option, which diminishes calculation time considerably for a compressible flow.
The simulation process was performed on a Dell® Precision T7600 Workstation, belonging to the Group on Advanced Materials and Energy at Instituto Tecnológico Metropolitano in Medellín (MATyER-ITM). Simulation processes were run between 40 and 140 h, according to the case analyzed. The convergence criteria for the simulation processes were determined based on the least squares residues (LSR); additionally, the primary and secondary mass flows were monitored constantly to guarantee stability of the mass balance in the control volume.
Configuration of the model took place progressively to avoid divergence in the residues. First-order discretization, Courant number of 0.1 and relaxation term of 0.15 were established as the system’s initial solution, then, each of the configuration terms was increased, as well as the pressure of the compressed air, which was established initially at 0.15 MPa with increments of 0.5 MPa until reaching the value of the pressure desired.
Finally, a second-order discretization for the equations of amount of movement and energy were established in the final solution of each of the simulations made.
4. Results and Discussion
Velocity contours on the ejector’s symmetry plane are shown in Figure 6 for the different pressure configurations of the compressed air and separation-c. Note that the velocity profile corresponds to the typical profiles of Coandă-effect ejectors, which are characterized for having higher velocity in the zone close to the walls [1]. Due to the operating conditions of the ejector, air behaves as an ideal gas.
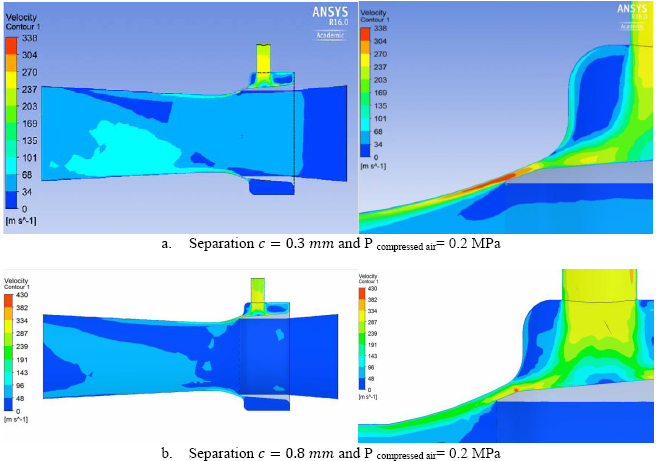
Figure 1 Velocity contours in the symmetry plane in function of the pressure of the compressed air and the separation c of the interface of the high-pressure region and the mixture region
Considering this, and knowing that the separation-c that communicates the high-pressure region with the mixture region is similar to a nozzle, it is important to ensure that the fluid in this region be sonic and, thus, guarantee condition s of optimal velocity and pressure at the output of separation-c, precisely in the mixture region. This guarantees increments of pressure and velocity that help the drag of the secondary mass flow (m_s) from the input.
By analyzing the velocity contours for each of the configurations shown, it may be concluded that the best configuration of the ejector corresponds to a separation-c=0.3 mm, where the Mach number is approximately 1, while supersonic conditions are present in the interface C between the high-pressure region and the mixture region characterized by the separation-c (Figure 6 a and c).
For the configuration presented in Figure 6e (c = 0.3 mm; 0.3 MPa), velocity increases through the interface between the high-pressure region and the mixture region. The flow regime in this configuration becomes supersonic, which generates a restriction that impedes the output of the primary air contained in the high-pressure region toward the mixture region and, hence, a decrease in the relation between the secondary mass flow with respect to the primary (Table 1).
Given that the scope of this work does not integrate experimental results on the commercial device used, a qualitative comparison is made of the numerical results obtained through the computational simulation process with respect to the experimental and numerical results available in [7]. Although these results correspond to a geometry for which a separation-c equivalent to 0.2 and 0.4 mm is presented, along with a primary air pressure (compressed air) of 0.6 MPa, it is found that the velocity profiles obtained through computational simulation for the different configurations of this study (Table 1) are similar to the profiles obtained experimentally for Coandă-effect ejectors with similar dimensions. Figure 7 shows a comparison of the different velocity profiles obtained in the mixture region for the different configurations of separation-c and operating pressures of the compressed air. It can be seen that the velocity close to the ejector walls in the mixture region and of the nozzle is higher than for the ejector’s central region, which is why this zone presents a pressure drop and, hence, an air mass thrust from the suction region (opening) to the ejector outlet.
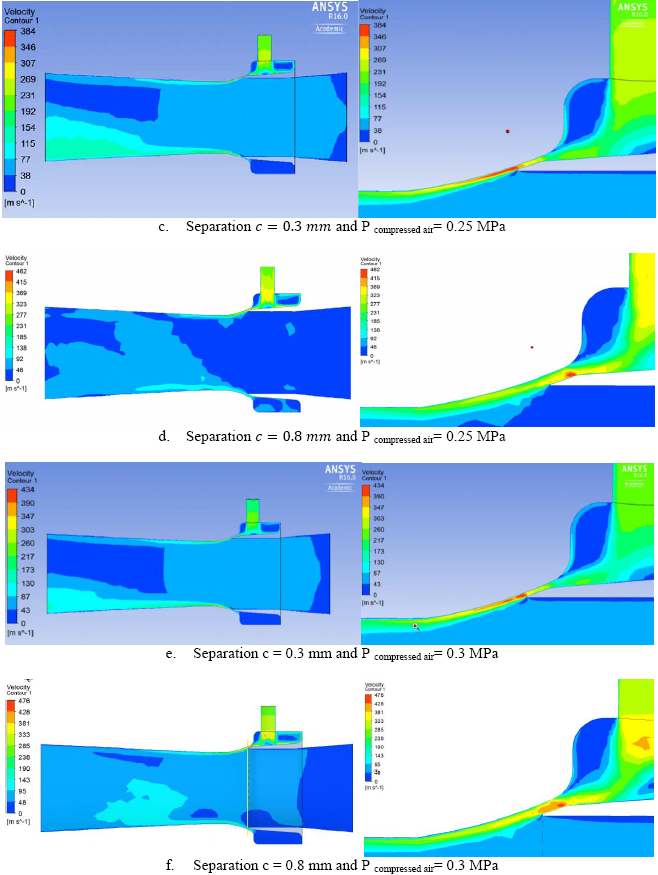
Figure 2 (cont’d) Velocity contours in the symmetry plane in function of the pressure of the compressed air and the separation c of the interface of the high-pressure region and the mixture region
Qualitatively, the behavior of the present simulation corresponds to the experimental results used in [7]; however, a difference of velocity is noted between the zone of interface C close to the tube of compressed air above 412 m⁄s and the lower part of 348 m⁄s for the configuration of c = 0.3 mm and compressed air pressure of 0.3 MPa (black line). For the configuration of c = 0.3 mm and compressed air pressure of 0.2 MPa, we have values of 246 m⁄s and 307 m⁄s. These differences of velocity are due mainly to the air in the high-pressure region presenting recirculation and, hence, losing kinetic energy considerably, reflected in the air’s output velocity in interface C from the high-pressure region toward the mixture region in the low part of the ejector. This recirculation phenomenon and the difference of output velocity of the high-pressure zone is seen in Figure 8.
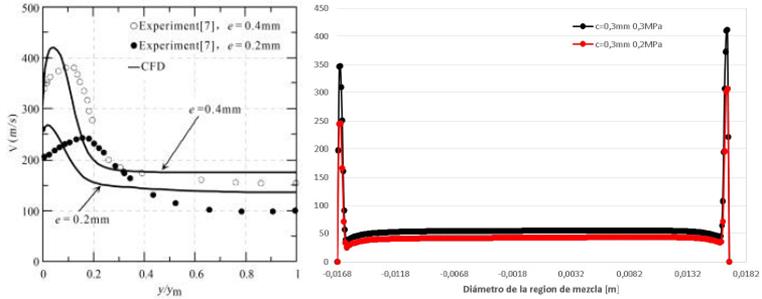
Figure 3 Qualitative comparison of the velocity profile in the mixture region. Left: Velocity curve in function of the normalized radius, pressure of the compressed air of 0.6 MPa, and separation c = 0.2 and 0.4 mm, adapted from [0]; Right: Velocity curve of the present simulation for separation c = 0.3 mm and pressure of the compressed air of 03 MPa (black line) and 0.2 MPa (red line)
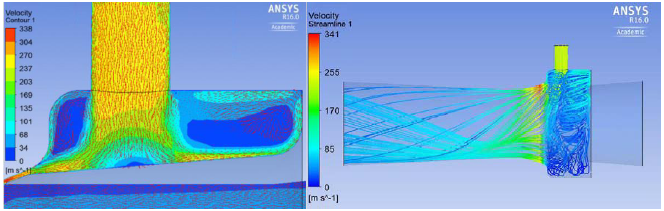
Figure 4 Contour of flow vectors and lines for separation-c = 0.3 mm and pressure of primary compressed air of 0.2 MPa. Recirculation and drop in velocity of the output air in the high-pressure zone
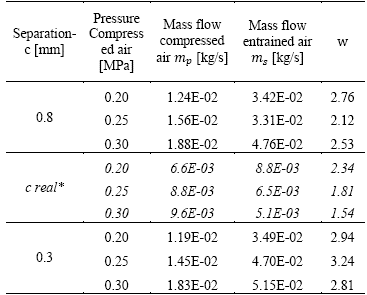
According to [7] the w factor determines, under an energy perspective, the efficiency of the Coandă-effect ejector, which is defined as the relation between the entrained or secondary mass flow (m_s) with respect to the injected or primary mass flow (m_p).
As seen in Table 1, we note that separation-c, which communicates the high-pressure zone with the mixture zone, is inversely proportional to the w factor. This means that the ejector is more efficient when separation-c diminishes with respect to the c value of the model of the commercial ejector analyzed, clarifying the existence of a minimum separation-c to respect to avoid constriction of the compressed air toward the mixture zone.
5. Conclusions
Computational simulation of fluids has demonstrated the vast importance of the geometric parameter of separation-c in the operation of the Coandă-effect ejector. For separation-c=0.3 mm, the ejector presents a relation between the entrained air (m_s) with respect to the primary air (m_p) close to 3 (Table 1).
Another important factor in ejector operation consists in guaranteeing a sonic flow (Mach 1) through the channel that communicates the high-pressure zone with the mixture zone; this is to guarantee supersonic flow conditions in the mixture zone and increase the flow of entrained air. Future work is required on Coandă-effect ejectors to optimize their energy efficiency.
Experimental validations and optimization processes will be carried out in a second phase of this study to improve the geometry of the commercial ejector analyzed, and the inconveniences presented in the high-pressure zone due to air recirculation.

